
A Clustering Analysis Method for Massive Music Data
2021-11-26 08:01:46YanpingXuSenXu
Modern Electronic Technology 2021年1期
Yanping Xu Sen Xu
School of Information Engineering,Yancheng Institute of Technology,Yancheng,JiangSu,224051,China
ABSTRACT Clustering analysis plays a very important role in the field of data mining,image segmentation and pattern recognition.The method of cluster analysis is introduced to analyze NetEYun music data.In addition,different types of music data are clustered to find the commonness among the same kind of music.A music data-oriented clustering analysis method is proposed:Firstly,the audio beat period is calculated by reading the audio file data,and the emotional features of the audio are extracted; Secondly,the audio beat period is calculated by Fourier transform.Finally,a clustering algorithm is designed to obtain the clustering results of music data.
Keywords:Spectral clustering algorithm K-mean Music similarity Audio period extraction
1.Introduction
In recent decades,the explosive growth of information is constantly generated from the network due to the amazing development speed of the Internet in China.However,in order to find useful information from the huge amount of information,simple statistics and computing can no longer meet the needs of the public and major companies.Data mining,machine learning and other fields have developed rapidly,and have become the main algorithm of big data companies.We can find out some characteristics in the massive data by setting certain rules and conditions.NetEyun Music already contains 35 million different songs and music.Besides,about 50 albums are released every week in the United States,with an average of about 12 songs per album.How to quickly classify a large number of music and songs has become a difficult problem.The results obtained from the classification of audio files by computer are more convenient for us to study the differences between different types of music.In addition,it is also convenient for us to directly recommend the same type of music to users.
Cluster analysis automatically divides the data elements in an unsupervised environment.Besides,it finds out the scientific research method of hidden rules.The clustering process is the process of dividing the data into different clusters according to different characteristics and unused statistics.Generally speaking,the data elements should have greater similarity in each independent class.However,the elements between different clusters should have greater differences.
In view of the music data,this paper introduces the clustering analysis method,and calculates the emotional characteristics based on the audio content.In addition,it classifies the audio types according to the emotional characteristics of each audio so as to realize the automatic classification of massive music data.
A clustering analysis method for music data is proposed.Firstly,the audio beat period is calculated by reading the audio file data,and the emotional features of the audio are extracted; Secondly,the Fourier transform is used to calculate the audio beat period; finally,a clustering algorithm is designed to obtain the music data clustering results.
2.Music Melody
The melody of audio refers to a sequence composed of pitch length and intensity.The staff we usually see is an expression of music melody.In addition,a single part with certain logic is played on the basis of certain debugging and beat according to the pitch,length and intensity of the melody,which becomes a piece of music.Monophonic music can be composed of a single part of music as a whole,or it can be synthesized by multiple parts of music.Music as an art form of emotional expression,the main means of expressing emotion in music is the melody in music.It can also reflect people's inner feelings through melody.The soul and foundation of music is the melody in music.There are various expressive elements of music in the melody.However,the two essential elements of the melody are pitch and rhythm.Various uneven contours formed by the combination of pitch ups and downs in the process of continuous performance,which are called pitch lines.It can only be formed when continuous sounds of different pitches,different timbre and different lengths are combined with a variety of different rhythms of music.
The organic combination of tone,pitch and rhythm forms the melody of music.Music expresses an emotion through melodies.You must convert the emotional signal in music into another way of expression that can be recognized by the computer if you want to use a computer to analyze and identify it.In this paper,MP3 file is used to extract audio features.
3.Audio Feature Extraction
3.1 Obtaining Music Beat Period by Autocorrelation Function
Fast Fourier transform(FFT)is used to process audio files.FFT is based on the discrete Fourier transform(DFT).
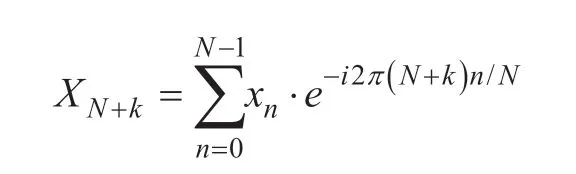
The symmetry property of DFT is derived,that is,
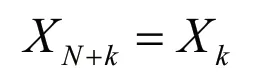
Further,it is:
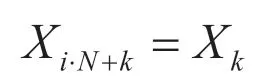
DFT is divided into odd and even parts according to this property.

Only half of the operation is performed to get the value of the whole spectrum for each Fourier transform.If Nbank 2 is even,each part can be divided into smaller parts by recursive operationfor each part.It is why the sampling value of most FFT is set to 2k.Generally speaking,the time complexity of FFT is O(nlogn),which greatly improves the computing speed of DFT.
This paper uses 0 to shield the frequency of 0~20Hz and 12.5~22.5kHz where the sensitivity function is insufficient because the frequency between 20 and 12500 is standardized in the ISO226-2003 standard.Firstly,the audio file is divided into frames.Secondly,the frequency with the highest amplitude of each frame of audio data is saved in a frequency sequence by Fourier transform.Finally,and the autocorrelation operation is done on the frequency sequence.
This paper uses the power sum of each frame as another reference sequence to do autocorrelation operation considering that it takes a long time to do Fourier transform for each frame.Figure 1 and figure 2 are the comparison of two groups of experiments.The audio used in it is irreplaceable.From top to bottom,the frame length is 2s,1s~1/32s.

Figure 1.Autocorrelation function with the strongest frequency intensity as the main data
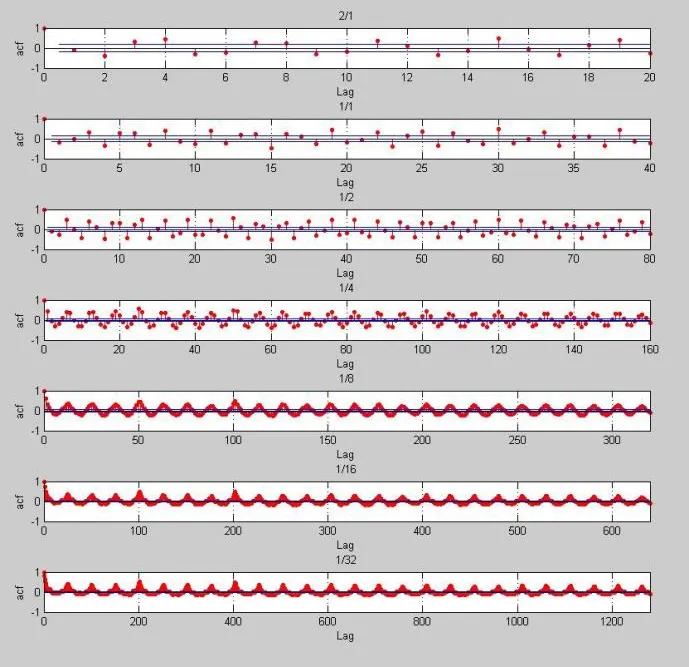
Figure 2.Autocorrelation function with power as the main data

Figure 3.Autocorrelation function of 24 songs

Figure 4.Result diagram corresponding to function combination(a)
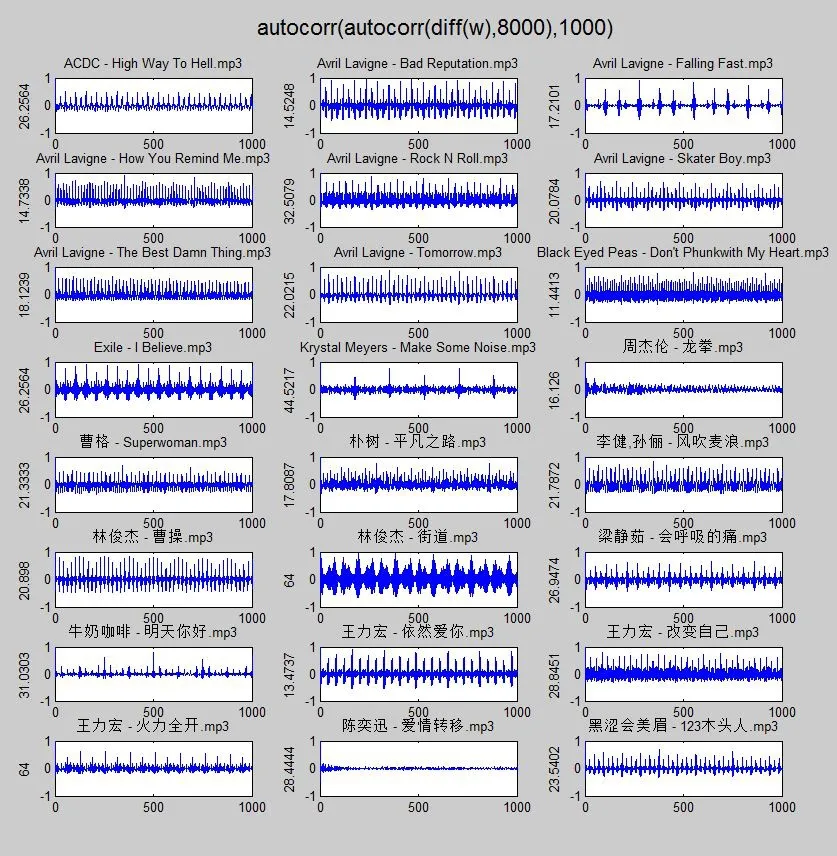
Figure 5.Result diagram corresponding to function combination(b)
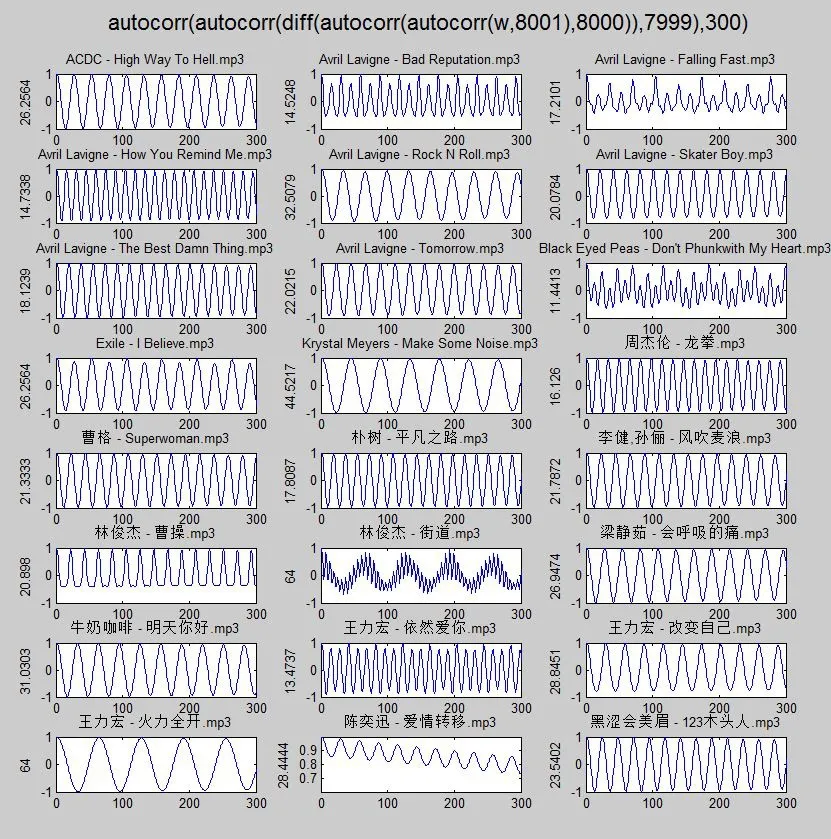
Figure 6.Result diagram corresponding to function combination(c)
According to the experimental results,there is no great difference between the two methods.In addition,because the direct calculation of power is faster,this method is used to extract the beat period features.As a result,the change of frame length from 1 to 16 seconds has no effect on the calculation of the period.As a consequence,this paper takes 0.01 seconds as one frame when calculating the beat period.
3.2 Audio Feature Extraction
Considering the following algorithm in order to extract the periodic features of audio:
a)Taking the maximum value in a certain interval as the minimum value of the beat period.
We carefully observe the autocorrelation function of the above figure for a).As a result,it is found that the position of about 0.5 seconds is actually the second peak,and the first peak is about 0.25 seconds.How to judge which peak is a period has become a difficult problem.It is considered that the threshold can be set,and the peak beyond the threshold is the position of the beat period.However,we find that the setting of the threshold has a great influence on the result after counting more than 300 audio files.A little higher than 0.01 will increase the beat cycle of about 60 audio.
The selection of interval has become the problem for b).According to the above figure,if the interval selection is[1600],the maximum value is 1,and the second largest value is 200.Considering that the part where the offset of the autocorrelation function is 0 is meaningless,the left side of the interval is set to 1.Besides,we cannot simply judge the position of the beat cycle.
We first observe the power autocorrelation function of 24 audio in figure 3 in order to better extract audio features.
The properties of autocorrelation functions are explained here.The above autocorrelation functions all use autocorr function,and the specific formula is different from the previous autocorrelation function.The formula is as follows:

In the formula,N is the length of the power sequence,mean(x)is the mean value of the power sequence,sum(x2)is the sum of squares of the power sequence,and the ratio is only for normalization.The purpose of subtracting the mean is to prevent the function value from fluctuating too much.However,it does not affect the calculation of the period.According to the formula,we can see that the autocorrelation function has attenuation.In other words,the larger the k value,the closer R(k)to 0.In addition,when the sequence is long enough,the multiple autocorrelation function will not affect the position of the periodic wave crest.Besides it also has a certain denoising function.
The proof that noise does not affect periodic signal detection:
The existing periodic signals(m)and the periodic signalwcan be set as composite signalx=s+w,then the autocorrelation function is
Then she seized Hansel with her bony hand and carried him into a little stable, and barred the door on him; he might scream as much as he liked, it did him no good
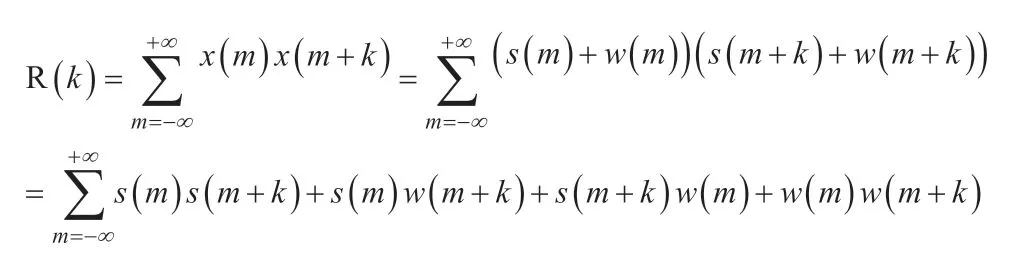
In the formula,sandware independent of each other,thenR(k)=Rs(k)+2CsCw+Rw(k)
In the formula,onlyRs(k)has periodicity,CsCwis the DC component,andRw(k)is approximately zero whenRw(0)is 1 and K is other values.
As a consequence,the autocorrelation function is directly used to detect the period in the case of a certain noise.
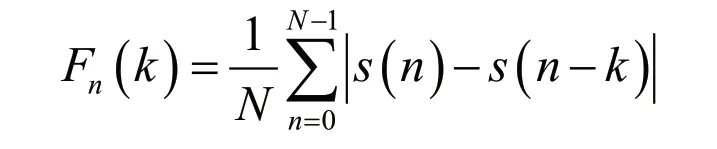
Li Zhijun and others[14]mentioned that the combination of AMDF and ACF can be used to make a large number of multiplication into addition operations to shorten the running time of individual autocorrelation functions when optimizing the autocorrelation function.AMDF is the average amplitude difference function,and its function is defined as:
This paper tests this point of view as follows:
A.Whether the autocorr function uses loops to calculate and value
All the autocorrelation functions in this paper are calculated by autocorr.
This paper combines the audio power with the following functions according to the property that multiple autocorrelation does not affect the fundamental frequency period and the difference operation can make the non-stationary time series more stable.
a)autocorr(diff(autocorr(w,8001)),1000);
b)autocorr(autocorr(diff(w),8001),1000);
c)autocorr(autocorr(diff(autocorr(autocorr(w,8001),8000)),7999),300).
The following images are obtained,as shown in figure 4-figure 6:
Compared with the above results,it can be found that the function obtained by using autocorr(autocorr(diff(autocorr(autocorr(w,8000),8000)),7999)is very close to the sinusoidal function,and then the Fourier transform is performed on the obtained sequence.In addition,the position of the highest peak is the position of the minimum period of the audio.
Four ordinary students were found to have the number of beats according to the rhythm of the music.After all,the acceptable rhythm is often between 1s and 0.4s.In this experiment,the experimental results of some songs are multiplied by 2 or 4 until the period falls into the ear recognizable range and put into the Max column in order to prove that the rhythm heard by the human ear is an integer multiple of the fundamental frequency.Table 1 shows the comparison between the sample and the experiment.

Table 1.Comparison of beat cycle results
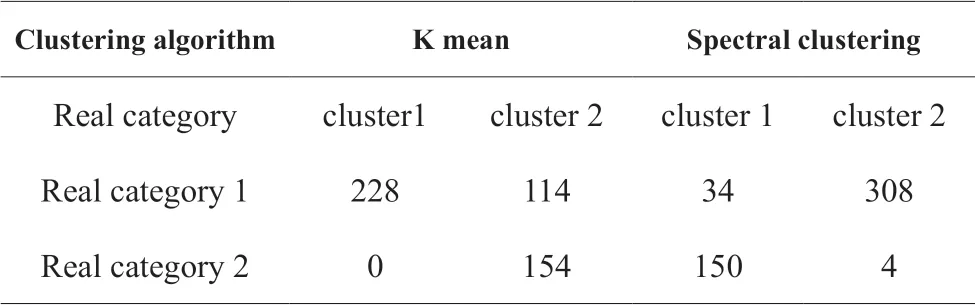
Table 2.Obfuscation matrices obtained by different clustering algorithms
The error of 3 audio is 25%,and the error of the other songs is less than 2%.It is found that these three pieces are 3 / 4 beat music.As a consequence,there is a 25% error between 4 / 4 beat music and 4 / 4 beat music.
This method is simple and unified,and is suitable for all songs.As a consequence,this method is used in the later audio melody feature extraction.
4.Audio Similarity
We can divide the audio signal into frames according to the audio period,extract the frequency and power sum of each frame to form the music melody,and then calculate the similarity of these sequences through the extraction of the audio period.
4.1 Audio Similarity Algorithm Based on Emotional Tendency
Thayer proposed an AV model with regard to the emotional characteristics of audio[15].It establishes a plane Cartesian coordinate system,and the horizontal axis is V(Valence),and the vertical axis is A(Arousal).The coordinate value of the horizontal axis reflects the enthusiasm,and the value of the vertical axis reflects the quiet degree of the audio.In this model,audio clarity is directly divided into four regions,which correspond to four emotional categories:fast,nervous,sad and calm.
We simply classify the influence factors of the vertical axis as the logarithm of the sequence variance of the power sum of each frame according to Thayer's model.In addition,the influence factors of the horizontal axis as the frequency sequence variance at the peak of the frame spectrum.That is:
A=log(var(w));V=var(fd);
In the formula,w is the power sum sequence of each frame and fd is the frequency sequence corresponding to the maximum value in the difference sequence of the spectrum of the two frames.Var is a function of variance.The reason why fd takes the difference as the main feature is that people are more sensitive to the changing frequency than the constant frequency.For example,we often ignore the drumbeat in the background music and focus on the changing part of the song when we listen to music.
In the meanwhile,we add a Z axis,Z=log(mean(w)),that is,the average of power sum,as the third feature that affects audio.For each piece of music,we have a vector(a,v,z),based on which we draw a three-dimensional distribution image of 496 pieces of music.
Next,we carry on the clustering analysis to these data points.In addition,the following briefly introduces the commonly used clustering algorithms.
4.2 K-means Clustering
The early idea of K-means clustering algorithm is put forward by Hugo Steinhaus[17].This algorithm has become one of the most famous and commonly used clustering algorithms because the algorithm is simple to implement,low time complexity and space complexity,and satisfactory results can be obtained for many simple clustering problems.
First of all,the algorithm assumes that the mean of each cluster is fixed and known.As a result,the problem becomes to add a cluster for each sample x,so that the intra-class distance criterion is minimized.Besides,difficulty of the algorithm is how to find the mean of each cluster.After all,it is impossible to obtain the mean of each cluster before knowing which samples each cluster contains.In addition,the mean of the cluster can only be obtained according to all the samples in the cluster.
We first enter k initial values as the k class,and then put the data points into the nearest class at one time to get the mean value of each cluster.In addition,we input the data points again according to these averages.The clustering center does not change after many iterations.In this case,the clustering result is a better solution with the smallest intra-class distance criterion.
However,the disadvantage of K-means clustering is also obvious.The intra-class distance can not be guaranteed to be the minimum for the final output results though the K-means clustering algorithm has been proved to be convergent through limited steps.Moreover,K-means clustering will also converge to the local minimum solution according to the different selection of initial values.In addition,it is often difficult to get better clustering results if the K setting deviates from the actual problem.
In view of these problems,we can also choose to optimize the K-means algorithm in advance.For example,the output of the initial value to select k points with the largest distance from each other,select the appropriate distance function and so on according to the prior knowledge to select a better value of K.
4.3 Spectral Clustering Algorithm
Spectral clustering algorithm transforms the aggregation of elements into a kind of graph segmentation,and divides the undirected graph of data elements into several optimal subgraphs,which is different from most clustering algorithms.As a result,it minimizes the cost of segmentation.in order to achieve the purpose of clustering[2,3,9].
The basic steps of spectral clustering are:
a)Inputting data;
b)Normalized Laplace matrix;
c)Calculating the smallest k eigenvalues and the corresponding eigenvector;
d)Clustering Eigenvectors(a small number of Eigenvectors)by k-means.
The advantage of spectral clustering is that there is no theoretical basis for the selection of feature vectors if we directly use the k-means algorithm for clustering analysis of undirected graphs.The introduction of Laplace matrix into spectral clustering adds physical meaning to the segmentation of graphs.In other words,for the dimensionality reduction of high-dimensional space,finding the eigenvector of Laplace matrix is equivalent to the dimensionality reduction of high-dimensional space.
4.4 Comparison of Clustering Results
We compare the type distribution map of the original file with the type distribution map of the original file for K-means and spectral clustering.The original audio type is the playlist type of NetEase Yun music.For example,all music on the playlist is set to the light music type if a playlist is named light music.In addition,if the playlist type is rock,all songs on the playlist are set to rock.Finally,each point is colored and drawn on a two-dimensional plane,which is a type distribution map.Figure 7(a)shows the type distribution of 469 pieces of music,in which the positive triangle is rock,rap and other exciting music; The inverted triangle is electric sound and DJ audio; Circles represent light music and soothing music.Let's divide them into one category for the time being because of the characteristics of rock and sound.Figure 7(b)is the result of clustering using K-means,K=2.Fig.7(c)is the clustering result obtained by using spectral clustering,K=2.
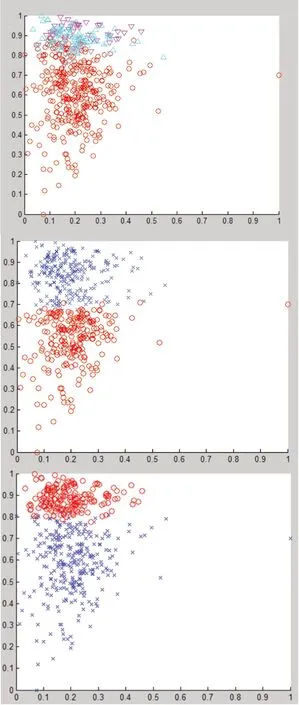
Figure 7.(a)Real type distribution map(b)Clustering results of K-means(c)Clustering results of spectral clustering
We find that the density of audio types is different in different regions though several groups of data are crossed in the experiment.Compared with the two clustering methods,the spectral clustering algorithm is closer to our actual situation.
The fitting results of the two clustering results and the real results are shown in tables 2 and 3,respectively.
It can be seen that the clustering effect of K-means algorithm is not ideal,and the clustering effect of spectral clustering is ideal.
5.Conclusion
A clustering analysis method for music data is proposed.Firstly,the audio beat period is calculated by reading the audio file data.Besides,the emotional features of the audio are extracted.Secondly,the Fourier transform is used to calculate the audio beat period.Finally,a clustering algorithm is designed to obtain the clustering results of music data.
Acknowledgments
Thisre search was partially supported by the National Natural Science Foundation of China(grant 62076215)and the Talent Introduction Project of Yancheng Institute of Technology under Grant No.XKR2011019.
 Modern Electronic Technology2021年1期
- Modern Electronic Technology的其它文章
- Investigation on the Application Value of Infrared Forehead Temperature Gun in Body Temperature Screening of New Crown Epidemic
- Design and Implementation of Mobile Intelligent Hidden Danger Inspection System
- An Improved NID Steganography Method for Low Bitrate Speech on VoIP
- Product Promotion Prediction Model Based on Evaluation Information
- Impact of Photovoltaics