Fabric changes induced by super-absorbent polymer on cement-lime stabilized excavated clayey soil
Xi Bin, Lingling Zeng, Xiozho Li, Xiusong Shi, Shuming Zhou, Fuqing Li,e
a Key Laboratory of Ministry of Education for Geomechanics and Embankment Engineering, Hohai University, Nanjing, 210098, China
b College of Civil Engineering and Architecture, Zhejiang University of Technology, Hanzhou, 310014, China
c State Key Laboratory for Geomechanics and Deep Underground Engineering, School of Mechanics and Civil Engineering, China University of Mining and Technology, Xuzhou, 221116, China
d Beijing Urban Construction Design and Development Group Co., Ltd., Beijing,100037, China
e Seazen Holdings Co., Ltd., Shanghai, 200062, China
Keywords:Fabric Soil stabilization Microstructure Super-absorbent polymer (SAP)
ABSTRACT This paper studies the microstructure variation induced by super-absorbent polymer(SAP)to understand the mechanism of macroscopic strength improvement of stabilized soil. The fabric changes of cement-lime stabilized soil were analyzed with respect to the variation of SAP content, water content, lime content and curing time, using mercury intrusion porosimetry (MIP) tests. It can be observed that the delimitation pore diameter between inter- and intra-aggregate pores was 0.2 μm for the studied soil,determined through the intrusion/extrusion cycles. Experimental results showed that fabric in both inter- and intra-aggregate pores varied significantly with SAP content, lime content, water content and curing time. Two main changes in fabric due to SAP are identified as: (1) an increase in intra-aggregate pores (<0.2 μm) due to the closer soil-cement-lime cluster space at higher SAP content; and (2) a decrease in inter-aggregate pores represented by a reduction in small-pores(0.2-2 μm)due to the lower pore volume of soil mixture after water absorption by SAP, and a slight increase in large-pores (>2 μm)due to the shrinkage of SAP particle during the freeze-dry process of MIP test.Accordingly,the strength gain due to SAP for cement-lime stabilized soil was mainly due to a denser fabric with less interaggregate pores. The cementitious products gradually developed over time, leading to an increase in intra-aggregate pores with an increasing proportion of micro-pores (0.006-0.2 μm). Meanwhile, the inter-aggregate pores were filled by cementitious products, resulting in a decrease in total void ratio.Hence, the strength development over time is attributable to the enhancement of cementation bonding and the refinement of fabric due to the increasing cementitious compounds.
1. Introduction
The explosive growth of urban population during last three decades in major cities of China resulted in the depletion of urban land space and overwhelmed road traffic system.Hence,there were raising demands for development of underground space. For example,about 32 cities in China have been building or planned to build subway system, which will consist of the largest subway systems in the world (Zhang et al., 2020). These underground activities avoidably generated a large amount of excavated soils and rocks during construction, which was (220.7 ± 11) × 106m3in 2016-2018 just for subway construction (Liu et al., 2017; Wang et al., 2018). According to the geological composition, the excavated materials consisted of rock, gravel, sand, clay and other materials. Commonly, coarse particle materials such as rock, gravel and sand can be easily reused on site as raw materials,whereas the clayey soil excavated was characterized as problematic materials with poor engineering properties, possessing high water content due to underground excavation technology such as tunnel boring machine (TBM) (Shi and Zhao, 2020). In the region of eastern and southern China, most of cities were located along the river, in coastal and piedmont plain, covered by thick Quaternary sediments. Hence, the clay-rich soil was the main component,consisting of 30%-50%of total amount of excavated soil due to the local geological conditions in this area (Zhang et al., 2020). This clayey soil with high water content was regarded as waste materials dumped into the landfill,with very low recycling rate in China.Another source of urban clay slurry was generated from dredging projects against flooding from climate change. The volume of dredged soil from Yangtze River Economic Belt region in China was about 60 × 106m3annually (Zeng et al., 2015; Bian et al., 2016,2018).Due to the fact that the disposal of clayey soil and import of raw material for urban construction were high-cost,accounting for 5%-30%of total infrastructure project fee(Magnusson et al.,2015),there is increasing awareness to reuse excavated soil as construction raw materials, which possesses potential benefits of reducing environmental and ecological impacts.

Table 1 Composition (%) of Portland cement and lime (after Bian et al., 2018).
From the geotechnical and geological engineering view,certain treatment (physical or chemical method) should be implemented to improve the engineering properties of excavated soil, meeting the mechanical requirements of earthwork constructions(Horpibulsuk et al.,2009;Jiang et al.,2015;Du et al.,2016).Limecement stabilization is widely recognized as an effective technique for the clayey soil. The engineering properties such as strength,modulus, permeability, and durability due to environmental change of stabilized soil have been extensively studied(Chew et al.,2004;Consoli et al.,2009;Horpibulsuk et al.,2010;Choobbasti and Kutanaei,2017;Atahu et al.,2019;Wu et al.,2020;James,2020).To deal with soils with high water content,additional additives such as fly ash,metakaolin,and phosphogypsum were commonly added to consume the water and improve the cementation strength for economical purpose (Horpibulsuk et al., 2009; Zhang et al., 2014;Zeng et al., 2021). However, the effectiveness of water reduction among these conventional materials was limited.Bian et al.(2016,2017a, b) has proposed a method using super-absorbent polymer(SAP) to improve the mechanical characteristics of stabilized soil with notably high water content. The unconfined compressive strength, compressibility and triaxial strength properties were significantly enhanced due to addition of SAP. Specifically, to achieve the same extent of strength properties, the cost of treatment via SAP was lower than that of fly ash,phosphogypsum and others at the same initial water content (Bian et al., 2017a, b). Hence, the usage of SAP can be regarded as an effective method to improve the engineering properties of clayey soil with high water content.
It has been recognized that the mechanical characteristic improvement of stabilized soil due to chemical additives is directly correlated with microstructure as well as mineralogy change(Bell,1996; Horpibulsuk et al., 2009; Du et al., 2014, 2020; Wang et al.,2017). Quantitative and qualitative analyses of microstructure changes during stabilization have been linked with macroscopic mechanical properties, using scanning electron microscope (SEM),mercury intrusion porosimetry(MIP),environmental SEM coupled with energy dispersive X-ray spectrometry (SEM-EDX) and other test methods. It can be summarized that the chemical reaction between binders and soil resulted in the bonding of soil particle,as well as the refinement of pore size distribution of soil, improving the mechanical characteristic of stabilized soil (Du et al., 2014; Le Runigo et al., 2009; Cui, 2017; Wang et al., 2017). Bian et al.(2018) conducted a series of SEM observations on stabilized soil with SAP, and showed that the pore distributions of stabilized soil were refined by SAP,resulting in strength improvement.However,quantitative analysis of the fabric changes (pore size distribution)with respect to the mechanical property improvement of stabilized soil with SAP is still lacking, which is vital for understanding the mechanism of strength enhancement due to addition of SAP.
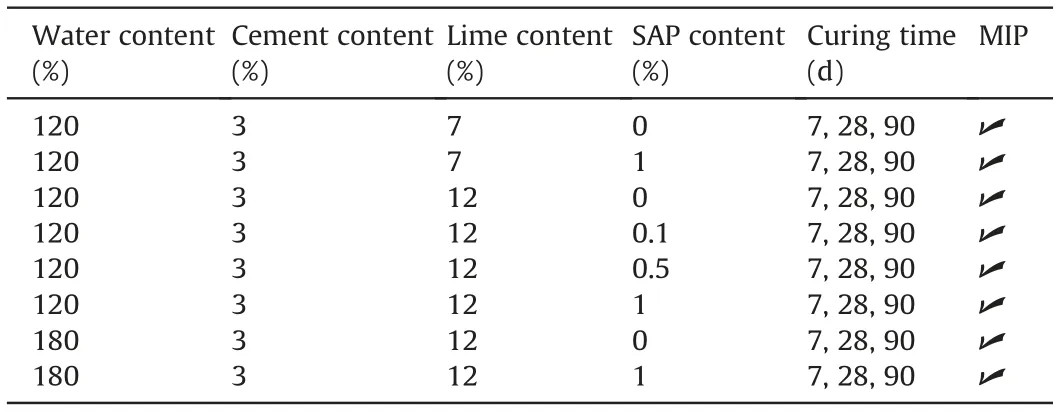
Table 2 Test program.
This study aims at investigating the mechanism of fabric change for stabilized excavated soil at high water content with the presence of SAP. A series of MIP observations was carried out on the stabilized soil at varying SAP content,lime content,water content,and curing time. The change in soil fabric (pore size distribution)was interpreted at different microstructure levels, which was finally linked with the strength improvement.
2. Materials and methods
2.1. Materials and sample preparation
The natural soil used for the experimental investigation was a high-plasticity clay (26% clay, 65% silt, and 9% sand), with liquid limit of 60%and plastic limit of 30%.The ordinary type of Portland cement(32.5R/N)and quicklime were used as stabilizing binders in this study. The ratio of CaO to SiO2for the cement used is 2.64,exceeding 2; and MgO content is 3.5% higher than 2%, which is compliance with the guidelines of the European cement standard(BS EN 197-1:2011, 2011). The CaO content of quicklime is 95.3%.The main properties of the cement and lime are presented in Table 1.The SAP used in this study was a suspension-polymerized,covalently cross-linked acrylamide/acrylic acid copolymer.The dry bulk density of SAP is 800 kg/m3,and the dry particle size is 120-150 μm.
Soil slurry at certain water contents(120%and 180%)was firstly produced by mixing the natural soil with predetermined quantity of water to a homogeneous state. The usage of SAP was to absorb water and eventually reduce the water content of the slurry.Hence,SAP particles (0%, 0.1%, 0.5% and 1% by weight of dry soil) were added into the soil slurry for water absorption.Afterwards,cement(3% by weight of dry soil) and lime (7% and 12% by weight of dry soil)were poured into the pre-absorbing SAP-soil slurry and mixed for 10 min to achieve uniformity. Subsequently, the mixture was moved into a mold to obtain samples, which were then cured in a controlled environment (20°C ± 2°C and 95% relative humidity)for different curing times (7 d, 28 d, and 90 d). The detailed experimental program is shown in Table 2.
2.2. Clay mineralogy
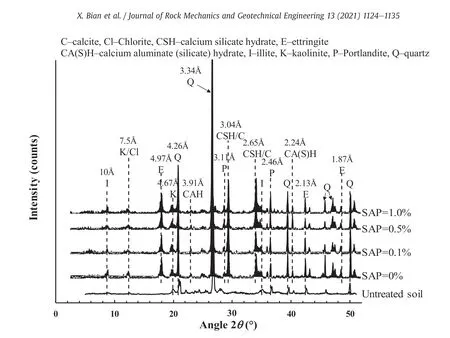
Fig.1. X-ray diffraction patterns of untreated and stabilized soils (after Bian et al., 2018).
X-ray diffractometry was used for measuring the mineralogical composition of untreated and stabilized soils.Fig.1 shows that the main minerals of untreated soil are quartz and clay minerals with the presence of illite (d ≈10 Å, where d is the distance between the clay monolayers), kaolinite (d ≈7.15 Å and 4.67 Å) and chlorite (d ≈7.15 Å). For the stabilized soil, the main hydration products were identified as calcium silicate hydrate (CSH)(d ≈3.04 Å and 2.65 Å), calcium aluminate (silicate) hydrate(CAH/CASH) (d ≈3.91 Å and 2.24 Å), and ettringite (d ≈4.97 Å,2.13 Å, and 1.84 Å). It should be emphasized that the intensity of the hydration products was almost the same irrespective of SAP content, indicating that SAP particle did not participate in the chemical reactions among the cement, lime and soil particles(Bian et al., 2018).
2.3. Experimental methods
The pH values of stabilized soil at different curing times were measured through HORIBA D-54 pH meter (ASTM D4972-2019,2019). The soil samples were firstly air-dried and then passed through a 2 mm sieve.Afterwards,the soil powder was mixed with distilled water (10 g soil and 50 mL water) to obtain the soil fluid,with a 3-min vibration mixing and a 1-h delay period. The fluid temperature during the pH test ranged from 21°C to 23°C.For each sample, triplicate measurements were conducted to minimize the error, and the average value of pH was reported.
The microstructure of stabilized soil was investigated using MIP test with working pressure from 3.6 kPa to 210 MPa,corresponding to the detectable pore size diameter of 0.006-350 μm.Before MIP test, the soil samples were cut into small cubes (1-2 cm3), rapidly frozen using liquid nitrogen, and then vacuum-cooled at -210°C,below its boiling temperature (-196°C). Then the lyophilized samples were subjected to freeze-dry procedure using a freeze dryer for sublimation of about 24 h(Delage et al.,2006;Bian et al.,2019a,b, 2020). This procedure has been proved to be a proper method to minimize the microstructure disturbance during dehydration (Delage et al., 2006; Liu et al.,2020).
3. Experimental results
3.1. pH value and unconfined compressive strength
Fig. 2 presents the variation of pH value, as well as unconfined compressive strength (qu) at different contents of SAP, lime and water,where w is the water content,Apis the SAP content,and ALis the lime content.From the pH measurements(pH value>10 for all samples), the high alkalinity of pore water provided the required chemical environment for the full development of pozzolanic reactions.Data of quobtained have been presented previously in Bian et al. (2018). For a given curing time, the measured pH value showed little change with SAP content. This suggested that the presence of SAP in the stabilized soil would not participate in the chemical reaction among cement, lime and soil. However, a significant increase in quwas observed,implying that the effect of SAP on the mechanical behavior of stabilized soil may result from the improvement of microstructure,which will be discussed in detail.
For a given SAP content,the measured pH value decreased with curing time, accompanied with a rapid increase in qu. This is attributable to the time-dependent pozzolanic reaction, which consumed portlandite and formulated cementitious products(Chew et al.,2004).Also,higher pH value was observed for soil with higher lime content and lower water content. Meanwhile, quincreased with lime content and decreased with water content at a given SAP content. These behaviors are consistent with previous findings of stabilized soil (Lorenzo et al., 2004; Al-Mukhtar et al.,2010; Du et al.,2014).
3.2. Microstructure analysis
3.2.1. Effect of SAP
Figs. 3-5 show the typical pore size distribution curves of the samples at different SAP contents after 7 d,28 d and 90 d of curing,respectively, where e is the initial void ratio. The relationship between the cumulative intruded mercury void ratio (em) and the entrance pore diameter is presented in the cumulative intrusion curves.Meanwhile,the variation of differential intrusion void ratio with the entrance pore diameter is illustrated in the density function curves.The initial void ratio of soil sample is also presented in the figures. In this study, the swollen SAP particle was not eliminated from the soil sample used for MIP test in order to keep the integrity of pore structure.As a result,the calculation of void ratio in this study considered the after-curing water and the water absorbed by SAP. It should be emphasized that the after-curing water content reported in Bian et al. (2016, 2018) was defined as the water content without calculating the water absorbed by SAP,thus this definition can be used to illustrate the effect of SAP on strength increase. In other words, at the same curing time and cement and lime contents,the initial void ratio in this study was the same for different SAP contents, as shown in Figs. 3-5.
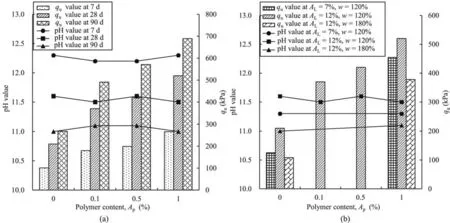
Fig. 2. Variation of pH value and qu: (a) Different SAP contents; and (b) Different lime and water contents (28 d of curing).

Fig. 3. Pore size distribution at different SAP contents at 7 d of curing (w = 120%, and AL = 12%).

Fig. 4. Pore size distribution at different SAP contents at 28 d of curing (w = 120%, and AL = 12%).
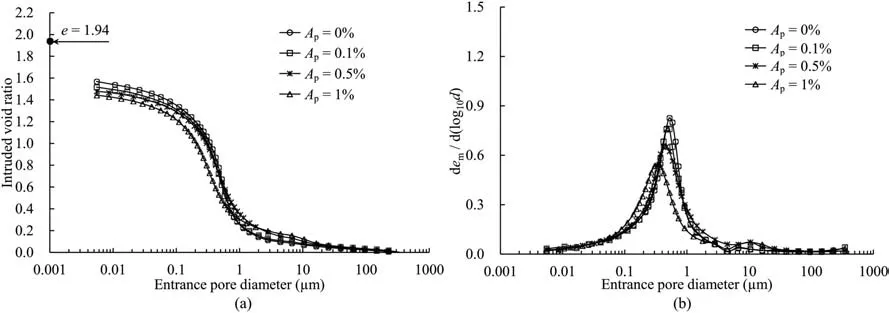
Fig. 5. Pore size distribution at different SAP contents at 90 d of curing (w = 120%, and AL = 12%).
It can be observed that the microstructure of stabilized soil with different SAP contents showed significantly heterogeneous distribution at a given curing time. The final intruded void ratio decreased with the SAP content irrespective of the curing time.Hence, the difference between the initial void ratio and final intruded void ratio increased with the SAP content.This difference corresponded to the undetectable pores (<0.006 μm), which was the detection limit of MIP measurement in this study. Moreover,Horpibulsuk et al. (2010) suggested that the change in stabilized soil was mainly due to the variation of pores with size of around 0.1-1 μm. Hence, to illustrate the change in pore size distribution due to SAP in detail, four pore families were divided according to the characteristic of density function curves of stabilized soil with SAP as follows: undetectable pores (<0.006 μm), micro-pores(0.006-0.2 μm),small-pores(0.2-2 μm)and large-pores(>2 μm).
At curing time of 7 d, the density function curves with 0% SAP showed a unimodal pattern with a mean pore size of 0.75 μm.This behavior of unimodal pore distribution mode was consistent with the typical pattern of cement and lime treated soil with water content higher than the optimum water content(Horpibulsuk et al.,2010;Russo and Modoni,2013).With an increase in SAP content,a new pore family with a mean pore size of 10-20 μm appeared.Hence, the curves turned to a slightly bimodal pattern. Compared with the soil without SAP, the appearance of SAP affected both kinds of pores. When SAP content increased from 0% to 1%, the mean pore size of small-pores decreased from 0.75 μm to 0.5 μm,with a decrease in the corresponding frequencies. Meanwhile, a slight increase in large-pores was observed.The undetectable pore volume also showed an increase tendency with SAP content.
Similar trends were observed in Figs.4 and 5 for curing times of 28 d and 90 d,respectively:(i)a unimodal pattern for soil with 0%SAP changed to a bimodal pattern for soil with SAP ranging from 0.1%to 1%;(ii)a decrease in mean size as well as the corresponding frequency in small pores; and (iii) an increase in large-pores and undetectable pores.
Fig. 6 illustrates the variation of intruded void ratio corresponding to the four pore families with SAP content. The results obtained at different curing times from 7 d to 90 d were quite similar: the largest proportion of pore families was small-pores with the pore size ranging from 0.2 μm to 2 μm, accounting for 38%-58% of total pore. This observation was in agreement with those of cement-lime treated soil with high water content(Horpibulsuk et al.,2010).The large-pores(>2 μm)consisted of the lowest proportion in the soil mixture,ranging from 7%to 22%.The micro-pores (0.006-0.2 μm) and undetectable pores (<0.006 μm)lay between these two pore families. The small-pore void ratio decreased significantly with the increase in SAP content,the same trend as the decrease in after-curing water content (Bian et al.,2018). On the contrary, an increase in undetectable pores and micro-pores with SAP content was observed at 7 d,28 d and 90 d of curing. This increase might be attributable to the change in soil fabric due to cementitious products, which will be discussed in latter sections. Meanwhile, the large-pore void ratio slightly increased with the increase in SAP content at all curing times.This behavior was due to the fact that the SAP particle size was shrunk from 120 μm in the original shape to about 20-80 μm during the freeze-dry process of sample preparation in MIP test. This also contributed to the appearance of peak pore families of around 10-20 μm for stabilized soil with SAP, in comparison with those without SAP (see Figs. 3-5).
3.2.2. Effect of water content
Fig. 7 depicts the change in pore size distribution curves with water content at 28 d of curing. For a given SAP content, the final intruded void ratio showed a clear increase tendency with water content.Regarding the density function curve,a significant change occurred in the mean pore size, which increased from 0.59 μm to 0.76 μm and from 0.36 μm to 0.65 μm when the water content increased from 120% to 180% for soil with 0% and 1% SAP,respectively.
Detailed pore families distribution at different water contents are shown in Fig.8.It can be observed that the increase in total void ratio when the water content increased from 120% to 180% was associated with a significant increase in small-pore void ratio,and with a slight increase in large-pore and undetectable pore void ratios. Contrarily, the micro-pore void ratio decreased with the increase in initial water content.
The typical changes of pore size distribution curves with lime content are presented in Fig. 9. A significant decrease in final intruded void ratio was observed with an increase in lime content,which corresponded to the decreasing tendency of after-curing water content with lime content. Slight decreases in the mean pore size of small-pores and corresponding frequency with the increase in lime content were also observed.
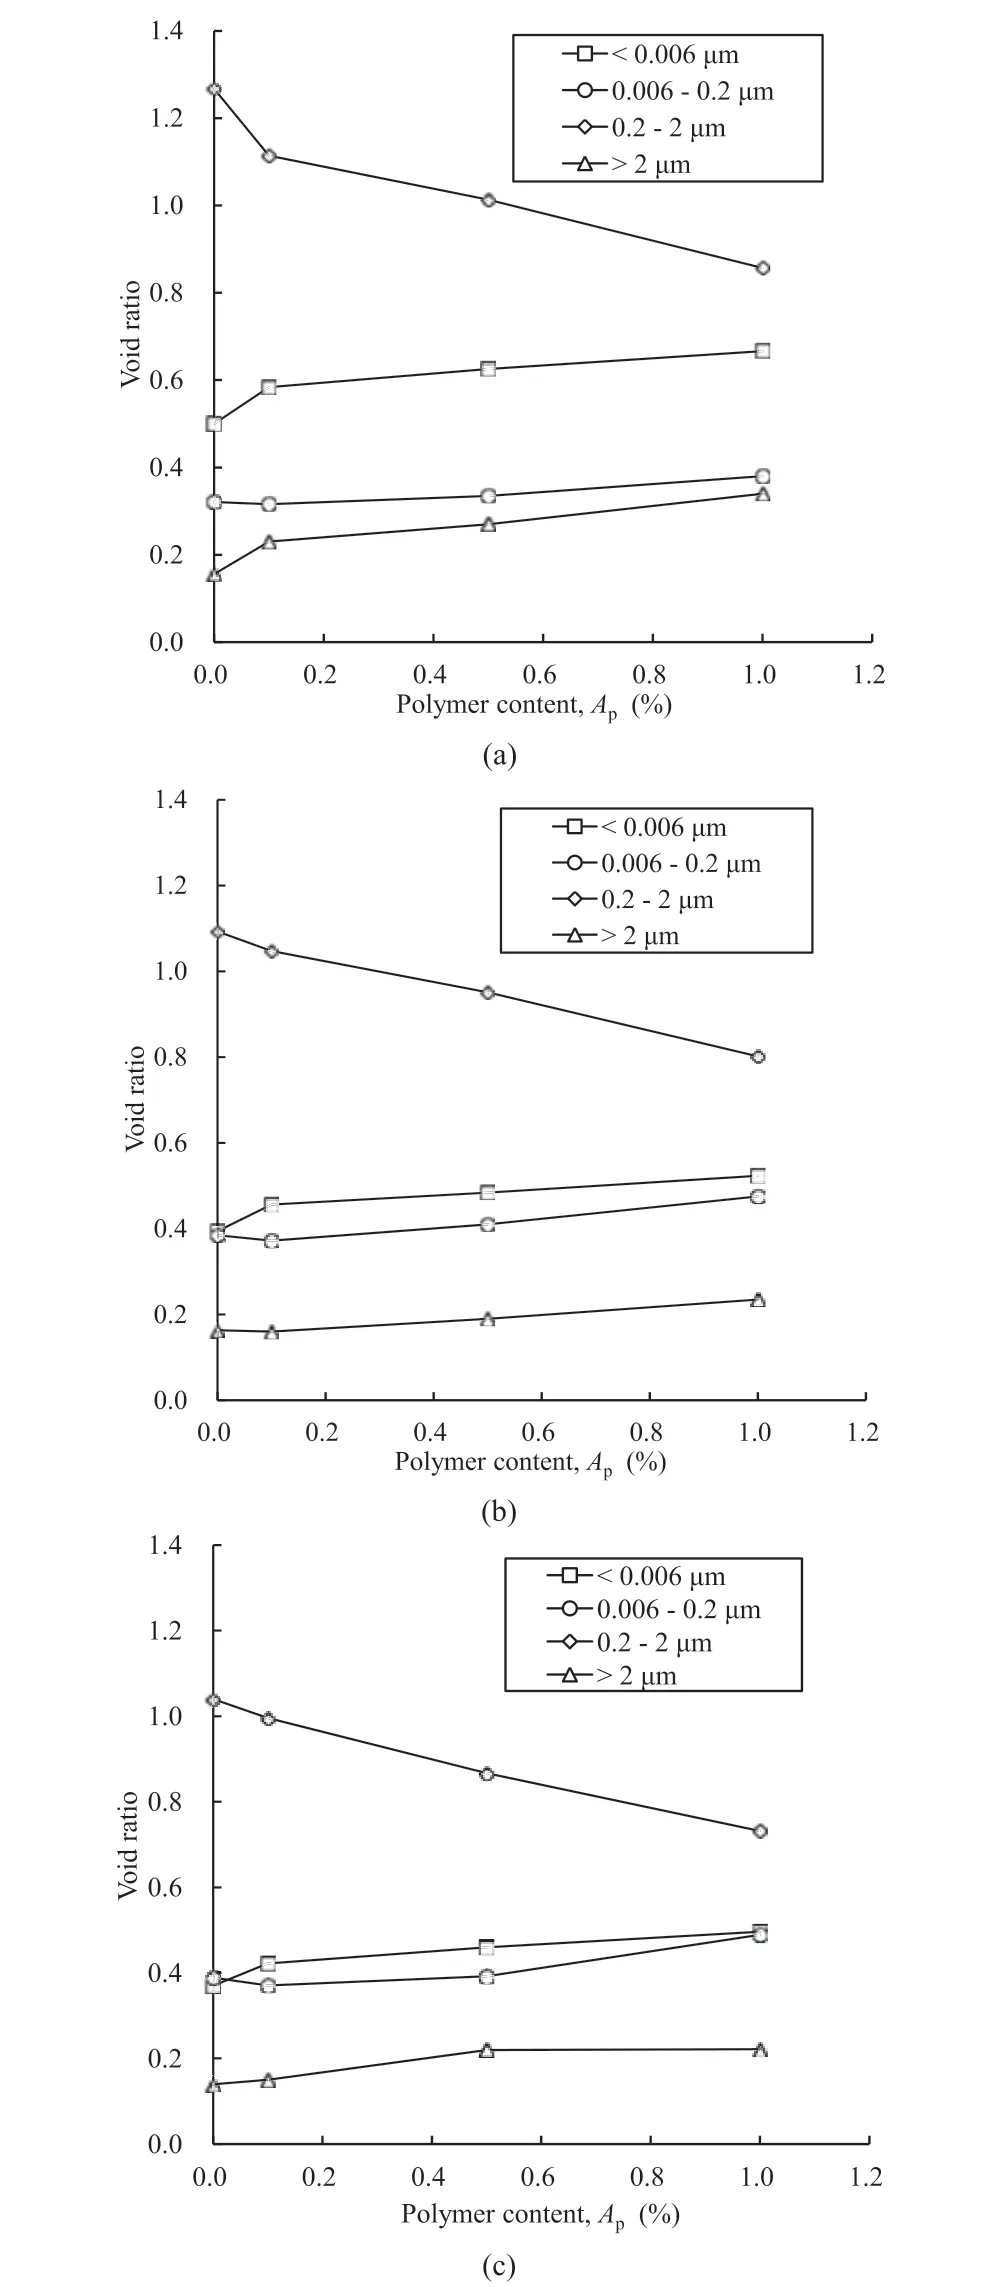
Fig. 6. Changes in pore size distributions with SAP content at different curing times:(a) 7 d, (b) 28 d, and (c) 90 d.
Detailed analysis in Fig. 10 showed that the small-pore (0.2-2 μm) void ratio significantly reduced with lime content, thus the reduction in total void ratio. This is because the increase in lime content resulted in an increase in cementitious products and a decrease in water content, thus the filling of more cementitious products into pore voids led to the decrease in void ratio of pores with size less than 0.2-2 μm.However,the micro-pores showed a clear increase tendency with lime content. This was also observed by other studies regarding stabilized soil(Horpibulsuk et al.,2010).Moreover, the change in large-pores and undetectable pores was insignificant.
3.2.4. Effect of curing time
Figs. 11-14 show the changes in pore size distribution curves with curing time at 0%, 0.1%, 0.5%, and 1% of SAP, respectively. On the whole,the cumulative curves at longer curing times lay below those at shorter curing times at different SAP contents, showing a significant decrease in final intruded void ratio with curing time,irrespective of SAP content.
For soil with 0%SAP,the density function curves approximately showed a unimodal pattern,with predominant small-pore porosity(0.2-2 μm).Hence,the change in microstructure with curing time was mainly due to the significant decrease in small-pores with a decrease of the mean pore size from 0.75 μm to 0.52 μm.
At 0.1% SAP, the density function curves consisted of a slightly bimodal pattern.A significant change was observed in small-pores from 7 d to 28 d, with a sharp decrease in mean pore size from 0.76 μm at 7 d to 0.5 μm at 28 d, as well as a reduction in the corresponding frequency.The curves at 28 d and 90 d showed that there was almost no difference up to 0.2 μm pore size,with a slight decrease in mean pore size from 28 d to 90 d. Similar trends were also observed in Figs.12 and 13 for 0.5% and 1% SAP, respectively.The decrease in void ratio with curing time was mainly characterized by the significant decrease of small-pores.
The changes in undetectable pores, micro-pores, small-pores and large-pores with curing time are presented in Fig. 15 for different SAP contents. The main change in the four pore families occurred within the first 28 d,while the variation of microstructure after 28 d was minor.From 7 d to 28 d,the significant reduction of pore volume with curing time was mainly attributable to the decrease in small-pores, along with a decrease in undetectable pores and large-pores.Meanwhile,the micro-pores increased with the increase in curing time. This was mainly due to the cementitious compounds produced in the pozzolanic process with curing time.The cementitious products tended to fill the pores larger than 0.2 μm,leading to the decrease of small-and large-pores.After 28 d,the change in small-and micro-pores tended to be at slower rates,whereas the undetectable pore and large-pore void ratios remained almost unchanged. This corresponded to lower level of pozzolanic reaction after 28 d of curing.
4. Discussion
The fabric of soil through microstructure analysis can be classified into two categories: inter- and intra-aggregate pores, which can be determined with an intrusion/extrusion cycle of cumulative pore size distribution curves. As shown in Fig. 16, the difference between the intrusion and extrusion curves corresponded to the quantity of constricted inter-aggregate pores,while the free pore of extrusion volume corresponded to the quantity of intra-aggregate pores (Delage and Lefebvre,1984). The delimitation pore entrance diameter separating the inter- and intra-aggregate pores ranged from 0.2 μm to 0.29 μm in this study.Hence,r=0.2 μm was adopted as the delimitation pore diameter between inter-aggregate(>0.2 μm) and intra-aggregate pores (<0.2 μm). The results observed in the previous sections indicated that both inter- and intra-aggregate porosities were affected by SAP content, water content, lime content, and curing time.
4.1. Fabric change due to SAP and water contents

Fig. 7. Pore size distribution at different water contents (28 d of curing).

Fig. 8. Changes in pore size distribution with water content (28 d of curing).
After 7 d of curing,the increase in intra-aggregate porosity was mainly due to the increase in both undetectable pores(<0.006 μm)and micro-pores (0.006-0.2 μm) with SAP, as shown in Fig. 17.Meanwhile, the total inter-aggregate pore proportion decreased with SAP content, characterized as a significant decrease in smallpores (0.2-2 μm) and a slight increase in large-pores (>2 μm).Typically, the cementitious compounds due to physicochemical reaction among cement,lime and clay tended to coat the surface of soil aggregates, improving the fabric of soil (Lemaire et al., 2013;Wang et al.,2015,2017).Bian et al.(2018)showed that the intensity of the hydration products (i.e. CSH, CAH/CSH, and ettringite)remained almost unchanged when SAP content changed from 0%to 1%. This suggested that the quantities of cementitious compounds were almost the same for the soil with different SAP contents at a given curing time. Hence, SAP played the following roles in fabric change:
And as they had no longer any cause for fear, they went in the old hag s house, and here they found, in every corner of the room, boxes with pearls and precious stones.53 These are even better than pebbles, said Hansel, and crammed42 his pockets full of them; and Gretel said: I too will bring something home, and she filled her apron full. But now, said Hansel, let s go and get well away from the witch s wood. When they had wandered about for some hours they came to a big lake.54 We can t get over, said Hansel; I see no bridge of any sort or kind. Yes, and there s no ferry-boat either, answered Gretel; but look, there swims a white duck;55 if I ask her she ll help us over, and she called out:
(1) The strong water absorption of SAP resulted in a significant decrease in after-curing water content of soil-cement-lime mixture (i.e. a reduction in intruded void ratio, as shown in Figs. 2-4), represented by a significant decrease in pore volume of soil-cement-lime cluster. Thus, the decrease in small-pores (0.2-2 μm) was observed with the increase of SAP content.
(2) The cementitious compounds tended to fill macro-pores,blocking the entrance of micro-pores and changing the nonconstricted pores to constricted small-pores (Russo and Modoni, 2013). Hence, the same quantity of cementitious compounds possibly bonded more soil particles with smaller clay particle space at higher SAP content, leading to the increase in undetectable pores (<0.006 μm) and micro-pores(<0.2 μm) with SAP.
(3) A slight increase in large-pores mainly resulted from the change in the size of swollen and unchanged SAP particle during freeze-dry procedure. The swollen and unchanged SAP particle tended to shrink to a size of 20-80 μm (10-40 μm in radius)during the sample preparation.As a result,the large-pores (>2 μm) originally occupied by SAP particle would be detected by MIP measurements.This phenomenon led to the slight increase in large-pores(>2 μm) with SAP.

Fig. 9. Pore size distribution at different lime contents (28 d of curing).

Fig.10. Changes in pores size distribution with lime content (28 d of curing).

Fig.11. Changes in pore size distribution with curing time (Ap = 0%). T is the curing time.
In a similar way, the change in fabric with water content was mainly due to a significant increase in inter-aggregate pores (both increase in small- and large-pores), and a decrease in intraaggregate pores (a slight increase in undetectable pores and a decrease in micro-pores) (see Fig. 7). With an increase in water content,the enlargement of clay particle space led to the increase in inter-aggregate pores, especially for 0.2-2 μm pores. Meanwhile,the larger clay particle space also resulted in less constricted smallpores formulated by the same cementitious compounds, thus less intra-aggregate pores (<0.2 μm) were observed for soil with high water content.
Comparing Figs. 6 and 8, it can be found that SAP and water contents showed almost opposite effect on the fabric change.Hence, it can be deduced that by adding SAP into soil with high water content,the after-curing water content of soil-cement-lime mixture was equivalently decreased because a certain proportion of water was absorbed and fixed by SAP,which was compatible to the reduction in void ratio due to consolidation.Hence,the soil mixture had a denser state with higher SAP content, or a looser state with higher water content, which was consistent with the SEM observations reported by Bian et al. (2018).
4.2. Fabric change due to curing time and lime content
The change in fabric with curing time was mainly due to the continuous pozzolanic reaction. After 7 d of curing, an increase in intra-aggregate pores(<0.2 μm)with curing time was observed for soil at all SAP contents, with an increase in micro-pores (0.006-0.2 μm) and a decrease in undetectable pores (<0.006 μm), as shown in Fig.17. This behavior was mainly due to the increase in cementitious compounds (i.e. CSH and others) with curing time,leading to the increase in intra-aggregate pores (<0.2 μm). Wang et al. (2017) suggested that the pore size of nano-crystalline CSH or small-sized amorphous CSH gels was smaller than 0.006 μm,corresponding to the undetectable pores by MIP measurement.Hence, it can be deduced from Fig.17 that when the curing time increased from 7 d to 90 d, the small-sized amorphous CSH gels gradually transformed to be the well-developed CSH phase with pore size of 0.006-0.2 μm(Alvarez et al.,2013;Wang et al.,2017),leading the majority of intra-aggregate pores to conversion from undetectable pores (<0.006 μm) to micro-pores(0.006-0.2 μm).
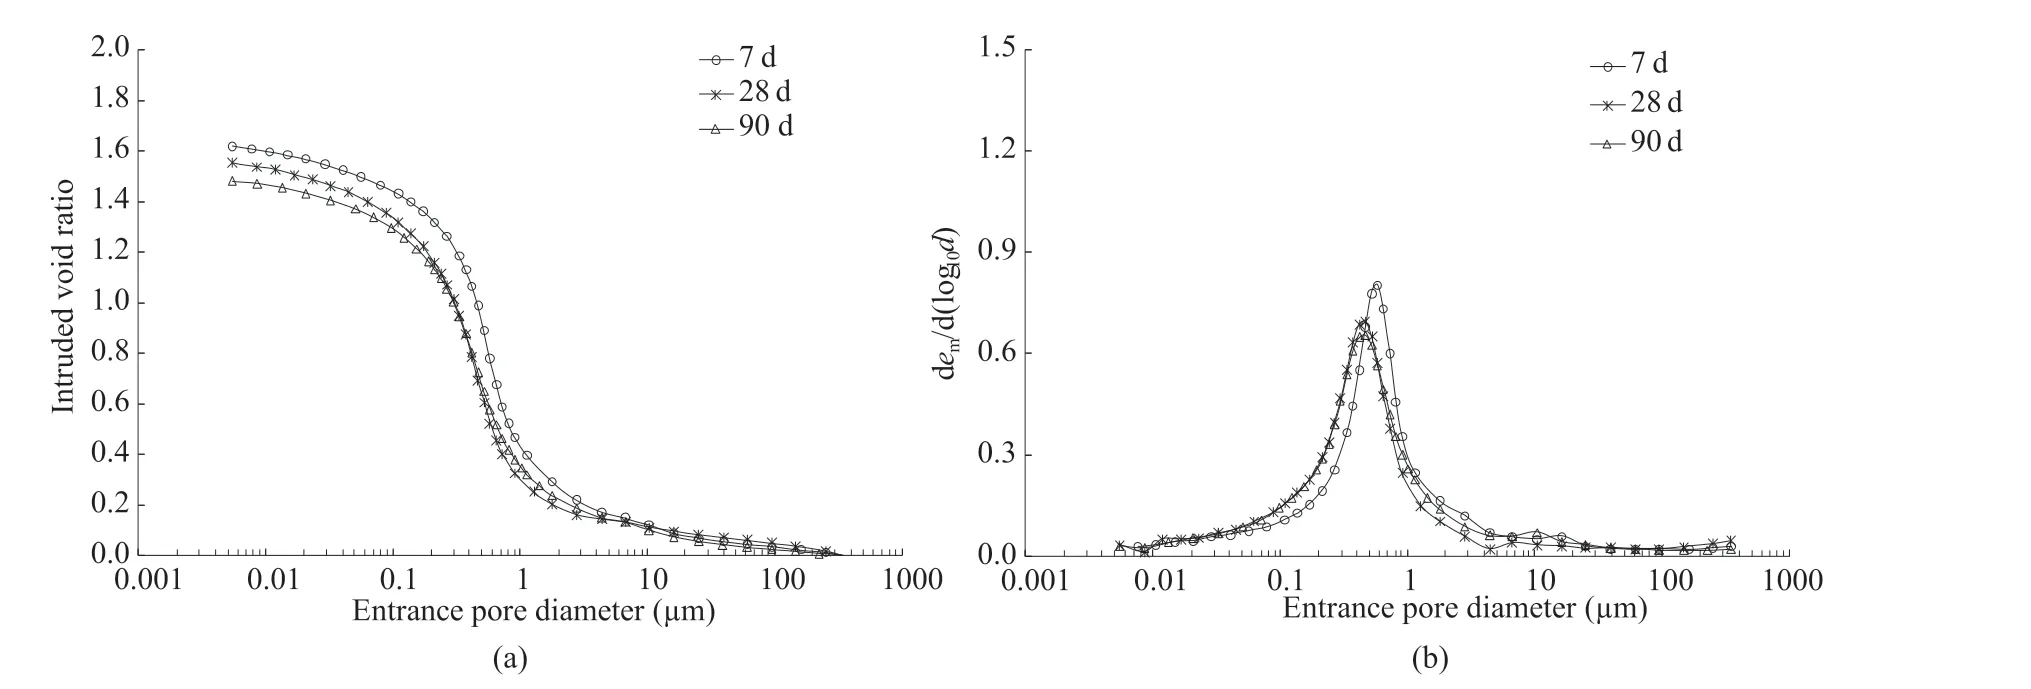
Fig.12. Changes in pore size distribution with curing time (Ap = 0.1%).

Fig.13. Changes in pore size distribution with curing time (Ap = 0.5%).

Fig.14. Changes in pore size distribution with curing time (Ap = 1%).
Meanwhile, more cementitious compounds at longer curing times tended to fill the macro-pores, resulting in the decrease in inter-aggregate pores with curing time. Interestingly, the proportion of small-pores (0.2-2 μm) was almost unchanged with SAP content. As shown in Fig. 14, the small-pore void ratio decreased with curing time.This suggested that the decrease of total void ratio was mainly due to the reduction in small-pore void ratio at the same rate. On the other hand, the proportion of large-pores(>2 μm) decreased with curing times except for the soil without SAP, indicating more large-pore filled by cementitious compounds with the presence of SAP.
For the case of increasing lime content, due to the increase in cementitious compounds,the void ratio of small-pores(0.2-2 μm)significantly reduced with lime content, thus the final intruded void ratio decreased, while the increase in micro-pores (0.006-0.2 μm)was also attributable to the increase in the amount of CSH and other cementitious compounds. Hence, the modification of fabric due to curing time and lime content was similar as shown in Figs.10 and 15.
4.3. Relationship between fabric change and strength improvement
Regarding the variation of strength for cement-lime stabilized soil with SAP,the effect of SAP and water contents on strength was mainly due to the improvement of fabric, since the amount of cementation products was the same, which can be regarded as follows:the increase in strength with SAP content was mainly due to the significant reduction in small-pores of 0.2-2 μm(i.e.a denser fabric), contrarily, the reduction of strength with water content resulted from the significant increase in small-pores of 0.2-2 μm(i.e. a looser fabric).
Moreover, the effect of cementitious products not only enhanced the cementation bonding,but also refined the soil fabric with less inter-aggregate pores. Due to the fact that the cementitious products of the investigated soil significantly increased with lime content and curing time,as detected using XRD test reported by Bian et al.(2018),the increase of strength with lime content and curing time was attributed to the effects of both cementation bonding enhancement and fabric refinement.
5. Conclusions
The effects of SAP content, water content, lime content and curing time on fabric variation were investigated for cement-lime stabilized excavated soil with SAP. The following conclusions are drawn:

Fig.15. Changes in pore size distribution with curing time: (a) Ap = 0%, (b) Ap = 0.1%, (c) Ap = 0.5%, and (d) Ap = 1%.

Fig.16. Definition of inter- and intra-aggregate porosities.
(1) SAP gradually shifts the mode of pore size to a lower value,with a reduction of final intruded void ratio, which is characterized by a significant decrease in small-pores(0.2-2 μm),and increases in micro-pores (0.006-0.2 μm) and undetectable pores (<0.006 μm). Contrarily, the increase of final intruded void ratio with initial water content is mainly due to the increase in small-pores (0.2-2 μm). Moreover, the changes in pore size distribution with curing time and lime content are mainly attributable to the decrease in pores larger than 0.2 μm and undetectable pores less than 0.006 μm, and an increase in micro-pores of 0.006-0.2 μm.
(2) The intra-aggregate pores derived from the intrusion/extrusion cycles are less than 0.2 μm for the cement-lime stabilized soil with SAP in this study. Three main changes in soil fabric due to SAP can be recognized:(i)an increase in intra-aggregate pores (<0.2 μm) due to the closer soilcement-lime cluster space at higher SAP content; (ii) a decrease in small-pores (0.2-2 μm) due to the lower pore volume of soil mixture after water absorption by SAP; and(iii) a slight increase in large-pores (>2 μm) due to the shrinkage of SAP particle during the freeze-dry process of sample preparation.
(3) With the increasing curing time and lime content,the change in fabric is mainly attributable to an increase in intraaggregate pores with an increase proportion of micro-pores(0.006-0.2 μm) due to the growth of cementitious products.Meanwhile,the filling of cementitious compounds into macro-pores leads to the decrease in inter-aggregate pores(>0.2 μm).

Fig.17. Changes in proportion of (a) intra-aggregate and (b) inter-aggregate pores.
(4) The increase in strength for the cement-lime stabilized soil with higher SAP content is mainly due to the refinement of fabric with a significant decrease in small-pores of 0.2-2 μm,as the cementitious products merely change with SAP content at a given lime content. The growth of strength with curing time is attributed to the enhancement of bonding strength and the refinement of fabric.
Declaration of competing interest
The authors declare that they have no known competing financial interests or personal relationships that could have appeared to influence the work reported in this paper.
Acknowledgments
The authors wish to acknowledge the support of the China Postdoctoral Science Foundation (Grant Nos. 2016M600396 and 2017T100355). Partial financial support from the Fundamental Research Funds for the Central Universities of China (Grant No.B200204001) and Jiangsu Natural Resources Science and Technology Fund (Grant No.KJXM2019025) are also acknowledged.
 Journal of Rock Mechanics and Geotechnical Engineering2021年5期
- Journal of Rock Mechanics and Geotechnical Engineering的其它文章
- Surface characteristics analysis of fractures induced by supercritical CO2 and water through three-dimensional scanning and scanning electron micrography
- Prediction of fracture and dilatancy in granite using acoustic emission signal cloud
- Hysteresis in the ultrasonic parameters of saturated sandstone during freezing and thawing and correlations with unfrozen water content
- Coupled Eulerian-Lagrangian simulation of a modified direct shear apparatus for the measurement of residual shear strengths
- A novel true triaxial test system for microwave-induced fracturing of hard rocks
- Hydromechanical behavior of unsaturated expansive clay under repetitive loading
