Rock damage and fracturing induced by high static stress and slightly dynamic disturbance with acoustic emission and digital image correlation techniques
Shuting Miao, Peng-Zhi Pan,*, Petr Koniek, Peiyang Yu, Kunlun Liu
a State Key Laboratory of Geomechanics and Geotechnical Engineering,Institute of Rock and Soil Mechanics,Chinese Academy of Sciences, Wuhan,430071,China
b University of Chinese Academy of Sciences, Beijing,100049, China
c Department of Geomechanics and Mining Research, Institute of Geonics of the Czech Academy of Sciences, Ostrava, 70800, Czech Republic
d Shenhua Xinjiang Energy Company Limited, Urumqi, 830027, China
Keywords:Damage evolution Fracture behaviors High static stress Dynamic disturbance Damage model
ABSTRACT A series of coupled static-dynamic loading tests is carried out in this study to understand the effect of slightly dynamic disturbance on the rocks under high static stress.The acoustic emission(AE)and digital image correlation (DIC) techniques are combined to quantitatively characterize the damage and fracturing behaviors of rocks. The effects of three influencing factors, i.e. initial static stress, disturbance amplitude, and disturbance frequency, on the damage and fracturing evolution are analyzed. The experimental results reveal the great differences in AE characteristics and fracturing behaviors of rocks under static loads and coupled static-dynamic loads. Both the Kaiser effect and Felicity effect are observed during the disturbance loading process.The crack initiation,stable and unstable propagation in the highly-stressed rocks can be triggered by cyclic disturbance loads, and more local tensile splitting cracks are found in the rocks subjected to coupled static-dynamic loads. The damage and fracturing evolution of rocks during cyclic disturbances can be divided into two stages, i.e. steady and accelerated stages, and the increase rate and proportion of each stage are greatly affected by these influencing factors. High initial static stress, low disturbance frequency, and high disturbance amplitude are considered to be adverse factors to the stability of the rocks,which would induce a high increase rate of the steady stage and a high proportion of the accelerated stage within the whole disturbance period.Based on the two-stage damage evolution trend, a linear-exponential damage model is employed to predict the instability of the rocks under coupled static-dynamic loads.
1. Introduction
The dynamic disturbances such as earthquake, blasting and drilling are frequently encountered in deep rock engineering(Huang and Wang,1999;Taheri et al.,2015,2016;Su et al.,2017a).Disturbance is a key factor that influences the stability of surrounding rocks in underground projects, particularly under high static stress conditions (Luo et al., 2019). Besides, the rock failure induced by dynamic disturbance often occurs at a seemingly random location and time,which makes it difficult to be predicted and has caused a serious threat to construction safety. Therefore,adequate knowledge on the failure mechanism of the rocks subjected to high static stress and dynamic disturbance helps forecast the occurrence of rock dynamic disaster (Xiao et al., 2009).
Under the coupled static-dynamic loading conditions, the mechanical response and failure characteristics of the rocks can be rather different from those of shallow rocks and cannot be explained merely using rock statics or dynamics mechanics theory(Li et al.,2017;Su et al.,2017a). Dynamic disturbance in deep rock and mining engineering can be roughly classified as strong and slight disturbances (Li et al., 2017). The blast-induced shock or stress waves are commonly encountered disturbances in practical engineering sites(Su et al.,2017a;Luo et al.,2019).In the vicinity of the blasting source, the rocks suffer strong disturbances from the blast-induced stress wave with considerably high amplitude and high strain rate. The strong disturbances often lead to dramatic dynamic failure of rocks, such as fragmenting, breaking, and shearing (Ainalis et al., 2016). Thus, to further understand the dynamic failure mechanism of rocks subjected to strong disturbances,numerous dynamic tests or coupled static-dynamic loading tests have been performed on flawed or intact rock mass using split Hopkinson pressure bar (SHPB) apparatus (Li et al., 2008; Zhou et al., 2019; Yan et al., 2020). These studies have revealed the failure characteristics of rocks near the blasting source, where the strong disturbance prevails. Note that the stress wave attenuation in the rocks is significant because the rocks are composed of different minerals and complex textures as well as joints,fractures,and inherent defects. The blast-induced stress waves are attenuated at an extremely fast speed during propagation in rocks, and most of the energy is dissipated within several times blasthole diameter.Afterward,the remaining blast energy propagates within the rocks in a form of seismic waves at a constant velocity (Kutter and Fairhurst, 1971; Zhang, 2016). The seismic waves have much lower amplitude and strain rate than the blast-induced stress wave does,thus it can be considered as slight disturbances(Li et al.,2017;Hu et al., 2020). It can be seen that the slight disturbances from seismic waves cover a wider range in surrounding rocks compared to that from the stress waves.Besides,in deep rock engineering,the rock masses surrounding the openings are often subjected to high stress after tunnel excavation.When the rocks are in a critical stress state, even a slight disturbance may trigger its instability (Li et al.,2017). Therefore, it is essential to study the damage evolution and failure mechanism of the rocks under coupled high static stress and slight disturbance.
Up to now, even though a series of coupled static-dynamic loading tests has been performed on the rocks under uniaxial,biaxial, and conventional triaxial compression conditions, most studies focused on the effect of disturbances on the mechanical parameters and failure modes of the rocks (Zuo et al., 2005; Tang et al., 2014; Taheri et al., 2015, 2020; Yang et al., 2020). Besides, a new testing method, called one-free face true-triaxial rockburst test, has been developed recently to study the rockburst ejection process and explain the rockburst mechanism (He et al., 2010; Du et al., 2016; Su et al., 2017b). Based on the novel method, truetriaxial tests under the coupled static-dynamic loads were conducted on the rectangular prismatic rock specimens to mimic the remotely triggered rockburst (Su et al., 2017a, b; Hu et al., 2018;Jiang et al.,2020).In their studies,the motion traces of the ejected fragments were recorded using two high-speed cameras, and the total kinetic energy of the ejected fragments was estimated to classify the rockburst intensity.Note that previous studies focused more on the variation in the failure characteristics and mechanical properties of the rocks induced by the external disturbances,while quantitative studies on the damage evolution and fracturing process of rocks under coupled static and dynamic loads are scarce.It is believed that the degradation of the rocks is related to the damage accumulation and progressive development of microcracks,including initiation,propagation and coalescence(Chen et al.,2011;Ghamgosar and Erarslan,2015;Yan et al.,2018).Besides,the hazard prediction of the rocks has an important practical significance in the engineering site. However, a proper damage model has not been built to describe the rock damage evolution and identify the failure precursor of rocks under coupled high static stress and slight disturbance.
As an innovative particle tracking technique, the digital image correlation(DIC)technique can provide full-field displacements or strains of a target surface by correlating the digital images acquired before and after deformation (Pan et al., 2009). Due to its advantages in deformation measurements and many other merits such as non-contact,simple setup,and low cost,the DIC technique has been successfully applied to detecting the strain localization and fractures in the rock or rock-like specimens(Zhang et al.,2015;Munoz et al., 2016; Munoz and Taheri, 2017a, b, 2019; Miao et al.,2018, 2020; Lin et al., 2020, 2021). Since the DIC technique can only detect the mesoscale or macroscale fractures on the target surface, the damage inside the specimen in the microscale hence cannot be captured (Zhang et al., 2015; Pan et al., 2020). As a remedy, another effective tool, i.e. the acoustic emission (AE)technique, is employed together with the DIC technique to help detect the development of the cracks inside the specimens from the microscale to macroscale (Zhang et al., 2015; Miao et al., 2018; Lu et al., 2019; Xing et al., 2019). AE is defined as high-frequency elastic waves emitted from the crystal dislocations and the microcrack generation within a stressed material (Ishida et al., 2017). It has the capability of real-time,dynamic,continuous monitoring of the internal damages (Otsuka and Date, 2000; Zhang et al., 2015;Ishida et al., 2017). Therefore, the combination of the AE and DIC techniques can provide both damage detection and deformation observation,offering a good solution for a comprehensive study of the failure process and fracture mechanism of the rocks. For example, Zhang et al. (2015) studied the damage and fracturing process of the notched sandstone beams under a three-point bending test with DIC and AE techniques. Their results demonstrated that the combined use of the two techniques is capable of detecting more details of the degradation mechanism of the rocks.Experimental observations performed by Lin et al. (2019a) also indicated that the characteristics of the fracturing process zone(FPZ) can be fully revealed when the above two techniques are adopted together.
In deep rock engineering, the high-stressed rocks are prone to instability when subjected to external dynamic disturbances.Although previous studies have revealed the effect of the dynamic disturbances on the mechanical properties and failure characteristics of rocks,some key problems are still needed to be answered.For example, what is the mechanism of dynamic disturbance affecting rock damage and fracturing? How to quantitatively characterize the crack initiation and propagation during the static and dynamic loading? What are the key influencing factors affecting the damage and fracturing evolution of rocks? What model is appropriate to describe the damage and fracturing process of the rocks under coupled static-dynamic loads? With these questions, a comprehensive experimental study on damage evolution and fracturing behaviors of the rocks under coupled high static stress and slight disturbance is performed. During the tests,the AE and two-dimensional DIC(2D-DIC) techniques are adopted jointly to trace the damage and fractures in granite specimens under coupled static-dynamic loads.Besides,previous studies have revealed that the initial static stress, disturbance amplitude, and disturbance frequency have a significant influence on the residual life and failure intensity of the rocks (Du et al., 2016; Su et al.,2017b; Hu et al., 2020). Therefore, these influencing factors are also considered in this study, and their effects on the damage and fracturing evolution in rocks are analyzed. Finally, based on the experimental data,a modified damage model is utilized to predict the rock failure under coupled static-dynamic loads.
2. Experimental method
2.1. Rock specimens
The medium-and fine-grained granite having grain size ranges from 0.18 mm to 2.5 mm was used in this study, which was collected from a quarry in the Beishan area in Gansu Province,China.The granite mainly consists of quartz(35%),K-feldspar(30%),plagioclase(20%),biotite(5%),and muscovite(10%).It has a density of 3260-3345 kg/m3,uniaxial compressive strength(UCS)of 204-206 MPa,Poisson’s ratio of 0.22-0.24,and Young’s modulus of 56-59 GPa. The measured P-wave velocity of Beishan granite is 4986 ± 57 m/s. Rectangular prism specimens having the dimensions of 50 mm (width) × 50 mm (thickness) × 100 mm(height) were cut from an intact granite block in the same orientation to eliminate the effect of anisotropy. All six surfaces of the specimens were polished to ensure the surface roughness deviation within ±0.05 mm and the deviation of perpendicularity between adjacent surfaces within±0.25°.The integrity and homogeneity of the specimens were checked before tests. Black and white spray paints were applied on the target surface to form a random speckle pattern for better DIC analysis. The upper and lower ends of the rock specimens were lubricated to minimize friction.
2.2. Experimental equipment
A servo-controlled mechanics testing system(MTS 815-04)was used for performing coupled static-dynamic loading tests. The testing machine has a maximum loading capacity of 2000 kN.During the test,the axial stress was measured with a load cell and the axial displacement was measured with an equipped linear variable differential transformer (LVDT). Axial load and axial displacement of the tested granite specimens were acquired continuously by a data acquisition system with a sampling interval of 0.2 s.Both the AE and 2D-DIC techniques were employed to trace the damage and fracturing of the rocks. During AE monitoring, six resonant sensors (Nano 30, PAC) were directly attached to the surfaces of the specimens with grease to ensure good acoustic coupling. Besides, the AE sensors were secured by using adhesive tapes to ensure their contact with the rocks. The AE signals were recorded with a 16-channel monitoring board(PCI-2,PAC).During the signal acquirement,the sampling rate was 1 MHz,and both the trigger threshold and pre-amplified gain were set to 40 dB. The optical setup is essentially the same as the one used by Miao et al.(2020).A charged coupled device(CCD)camera with a resolution of 3376 × 2704 pixels was utilized to record the deformed digital images at a speed of 9 frames per second.Two white light sources were employed to provide diffuse, homogenous, and unchanged illumination of the target surface.The acquired digital images were then imported to image correlation software to measure the fullfield displacements and strains.
2.3. Loading path
Three uniaxial compression tests were performed to acquire the strength and deformation properties of the granite specimens.The stress-strain curves of granite specimens subjected to monotonic axial loads are shown in Fig.1.It can be seen that the three stressstrain curves are fairly consistent, which reveals the homogeneity of the granite. The average UCS of the three tested granite specimens is 205 MPa,which will be used as the reference strength for the coupled static-dynamic testing schemes.
The loading path of the coupled static-dynamic test consists of the initial static loading stage and the subsequent cyclic disturbance stage, as shown in Fig. 2. The surrounding rocks around the excavated deep tunnel are in a high stress condition,thus the initial static loading is designed for imitating the high-stress condition of the surrounding rocks. The static loading is carried out in load control mode with an axial load rate of 0.5 MPa/s until the preset static stress is achieved. Then, the cyclic sinusoidal waves are axially applied to rock specimens to imitate the dynamic disturbance from seismic waves. The cyclic sinusoid waveforms can be described with an upper limit stress σmax, lower limit stress σmin,and frequency f = 1/T. The amplitude A of the cyclic disturbance equals (σmax- σmin)/2. The dynamic disturbance loading is repeated until the specimen fails.
2.4. Testing scheme
The parameters of cyclic disturbance may affect the damage evolution and fracturing behaviors of the rocks. Thus, the amplitude A and frequency f of the cyclic sinusoidal waves are set to different magnitudes in this study. The stress amplitude is set to 10 MPa, 20 MPa and 30 MPa, corresponding to 4.87%, 9.75% and 14.63% of the UCS, respectively. The frequency f of the cyclic waveform is set to 0.2 Hz, 0.5 Hz and 1 Hz. The initial damage of granite induced by static loads is closely associated with the damage evolution and fracture development in the subsequent dynamic disturbance stage (Hu et al., 2020). Therefore, the initial static stress σiis varied and set to 160 MPa,170 MPa and 180 MPa,corresponding to 78.04%, 82.92% and 87.80% of the UCS, respectively.The testing scheme for the static-dynamic tests of the granite specimens is presented in Table 1. Generally, three or more specimens are tested for each loading condition to ensure at least two close results.
3. Dynamic disturbance affecting rock damage and fracturing
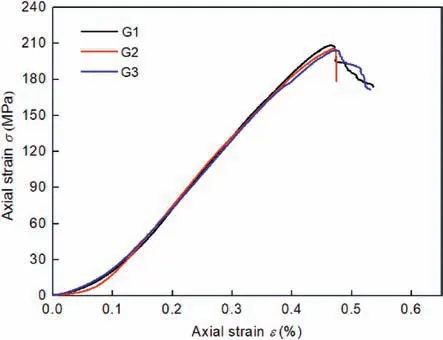
Fig.1. Stress-strain curves for granite specimens subjected to static load.
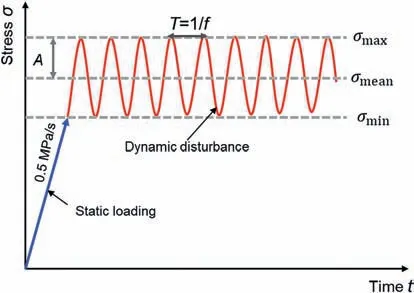
Fig. 2. Sketch of the coupled static-dynamic loading path.
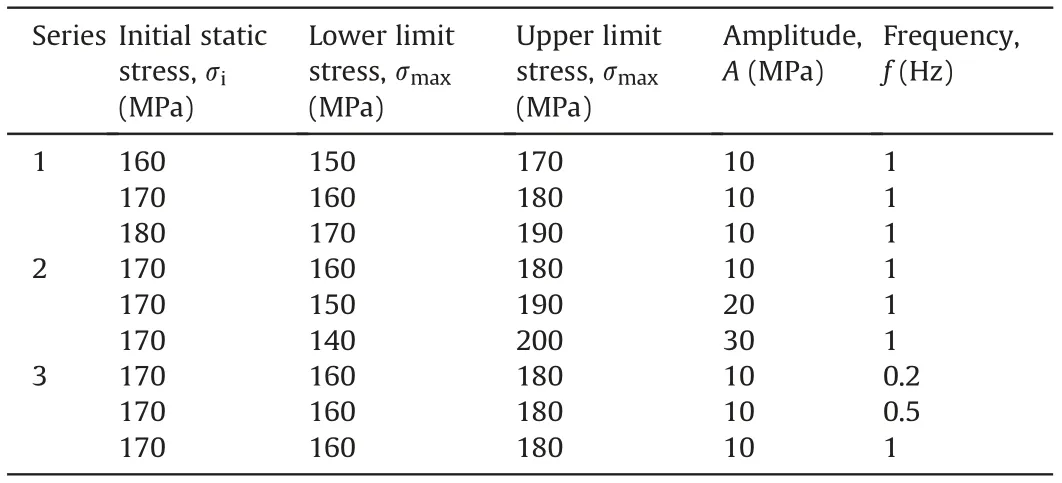
Table 1 Static-dynamic testing scheme for granite specimens.
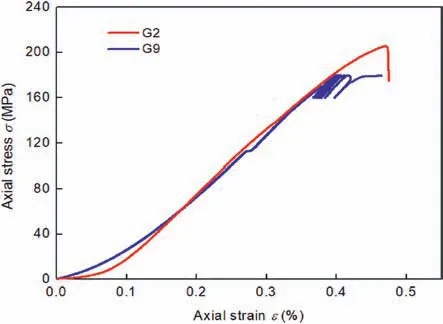
Fig. 3. Comparison of stress-strain curves for granite specimens subjected to static loads (G2) and coupled static-dynamic loads (G9).
Fig.3 compares the stress-strain curves obtained by a static test and a static-dynamic test. It can be seen that the two stress-strain curves are consistent before the dynamic disturbance is applied.However, the granite specimen subjected to coupled staticdynamic loads fails at a lower stress than that under static loads,which shows the significant effect of the dynamic disturbance on the mechanical properties of the rocks. Besides, the differences in the damage and fracturing evolution of the rocks under the static loads and coupled static-dynamic loads are clarified in this section.
3.1. Analysis of AE characteristics
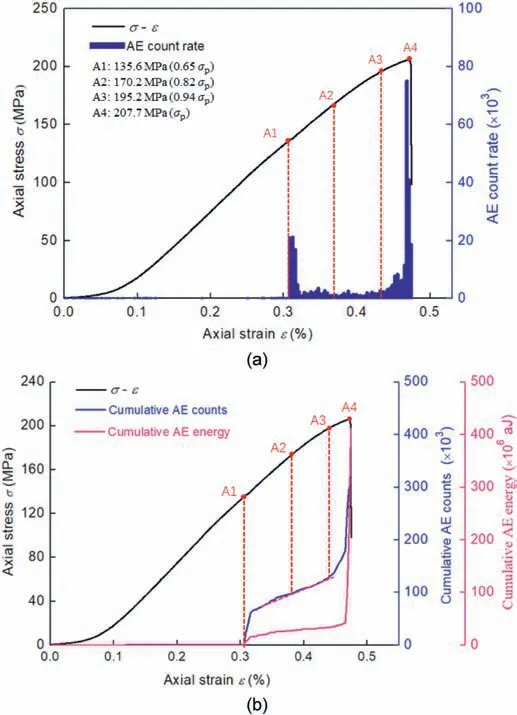
Fig.4. AE response of specimen G2 under static loads:(a)Stress-strain curve versus AE count rate, and (b) Stress-strain curve versus AE cumulative counts and energy. σp represents the peak stress of specimen G2.
Fig.4a shows the stress-strain curve together with the AE count rate for granite specimen G2 under static loads. The stress-strain curve exhibits an initial concave stage upon the axial stress is applied, which results from the closure of the inner defects and voids within the rocks.Then,the axial stress increases linearly with the axial strain before the peak stress,showing a significant elastic response. The sudden stress drop at the peak reveals the brittle failure characteristic of the granite. Moreover, the identification of the critical stress threshold is essential for understanding the degradation of the rocks under external stresses. Commonly used methods for identifying the critical stress threshold include volumetric strain (VS) methods, lateral strain (LS) methods, and AE methods (Eberhardt et al., 1998; Gao et al., 2018; Ghasemi et al.,2019; Taheri et al., 2020). Therefore, the AE evolution is used to identify the critical stress threshold of the rocks in this study. In Fig.4a,few AE hits are detected before point A1(i.e.65%of the peak stress),which means that limited damage has taken place in granite at this stage.Afterward,a large number of AE hits appear suddenly at point A1,and then continuous AE signals are detected.According to previous literature, the crack initiation marks the onset of the“continuous detection”of AE events.Thus,the stress corresponding to point A1 can be identified as crack initiation stress.After that,the axial stress increases gradually, while the AE count rate is nearly constant in Fig. 4a and a linear increase in the accumulative AE counts is noticed in Fig.4b,which reveals the stable crack growth in the granite specimen.Point A2 is located in the stable growth stage,aiming to observe the crack behavior.Afterward,a change in the AE evolution trends occurs at point A3, which marks the variation in the increase rate of the AE count rate and accumulative AE counts(Fig.4).It has been believed that the increasing burst of AE events comes from the beginning of the crack interaction and coalescence.Thus,it is reasonable to identify the stress at point A3 as the crack damage stress threshold. When the axial stress approaches the peak, the AE count rate increases dramatically, and the maximum value is achieved near the peak. Point A4 is located at the peak stress,aiming to observe the fracture patterns before the rupture of the rocks occurs. In Fig. 4b, both the cumulative AE counts and energy first show a sudden rise at point A1, then presents a slow increase,and finally follows a sharp rise at point A3.The sharp rise of the cumulative AE counts and AE energy near the peak stress reveals the unstable crack propagation and coalescence within the rocks.
Fig.5 shows the AE response of the rock specimen G9 subjected to coupled static-dynamic loads with σi= 170 MPa,A = 10 MPa,and f = 0.2 Hz. It can be seen that the evolution of the AE count rate in specimen G9 at the static loading stage is similar to that in specimen G2 (Figs. 4 and 5). However, a great difference in the AE behaviors occurs at the instance just before failure.In Fig.4,a single peak of the AE count rate is noticed when the axial stress approaches its peak, indicating the sudden rupture of the rocks without warning. However, in Fig. 5, even though the upper limit stress of the cyclic loads is lower than the strength of the rocks,several peaks of the AE count rate are noticed during the cyclic disturbance stage, indicating that the damage and fracturing continuously develop in the rocks. The AE response during the dynamic disturbance is also enlarged and presented in Fig.5.Note that the peak of the AE count rate at each cycle decreases with the increasing number of cycles in the first 5 cycles,which means that the granite specimen exhibits good memory characteristics under similar loading cycles, known as the Kaiser effect. Then, the AE count rate begins to increase with the increasing number of cycles from the 6th cycle.Moreover,from the 8th cycle,two or more peaks of the AE count rate are observed in each cycle and the AE signals are detected at a stress lower than the upper limit stress,known as the Felicity effect. To quantitatively characterize the AE response during the cyclic disturbance,the cumulative AE counts and energy in specimen G9 in each cycle are calculated, as shown in Fig. 6. It can be seen that the cumulative AE counts and energy in each cycle first decrease and then increase with the increasing number of cycles. By fitting those scatter data and setting horizontal lines, it can be found that the minimum AE counts occur in the 5th cycle,while the minimum AE energy occurs in the 4th cycle.
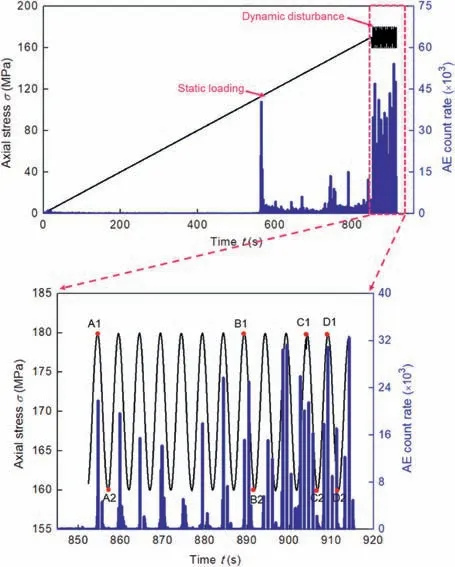
Fig. 5. AE responses of specimen G9 subjected to static-dynamic loads with σi =170 MPa, A = 10 MPa, and f = 0.2 Hz.
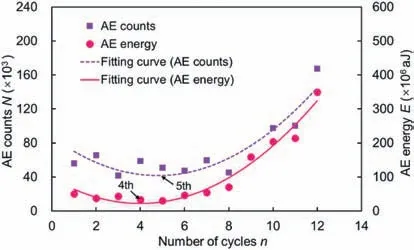
Fig. 6. AE counts and AE energy in each cycle during dynamic disturbance for specimen G9.
Similar AE evolution is also noticed in other granite specimens subjected to coupled static-dynamic loads. For example, Fig. 7 shows the AE response of the granite specimen G14 during the cyclic disturbance stage, during which three stages can be identified.It can be seen that some AE events are detected in the first few cycles (i.e. stage I), resulting in the generation of some cracks. The AE events are scarce at stage II, meaning that limited cracks have devolved in the rocks at this stage. Compared to the AE counts in each cycle at stage I, the AE counts in each cycle are significantly reduced at stage II, which shows that the granite has a memory effect on irreversible damage.That is to say,the Kaiser effect is in a leading role during stage II. Afterward, intense AE activities are observed in the last few cycles (i.e. stage III), indicating that the rapid crack propagation is taking place in rocks under the same loading cycle.It can be seen that several peaks of AE counts gather at stage III and most of them take place under the stress lower than the upper limit stress.Thus,the Felicity effect can be considered to be in a dominant role at the last stage. The appearance of the Felicity effect has been viewed as a precursory index of rock failure during the cyclic loading process (Duan et al., 2020).
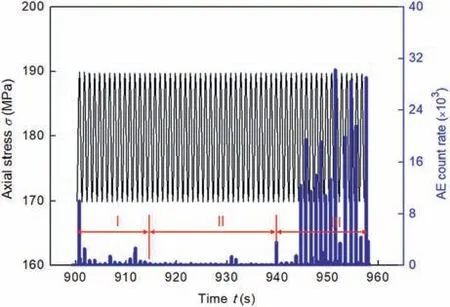
Fig. 7. AE responses during dynamic disturbance for specimen G14 with σi =180 MPa, A = 10 MPa, and f = 1 Hz.
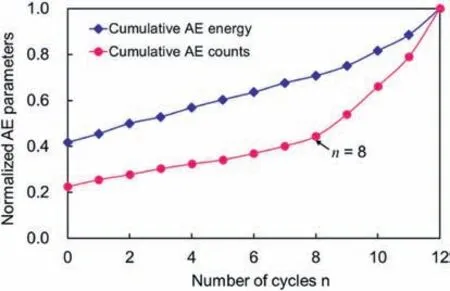
Fig. 8. Normalized cumulative AE counts and energy during dynamic disturbance for specimen G9.
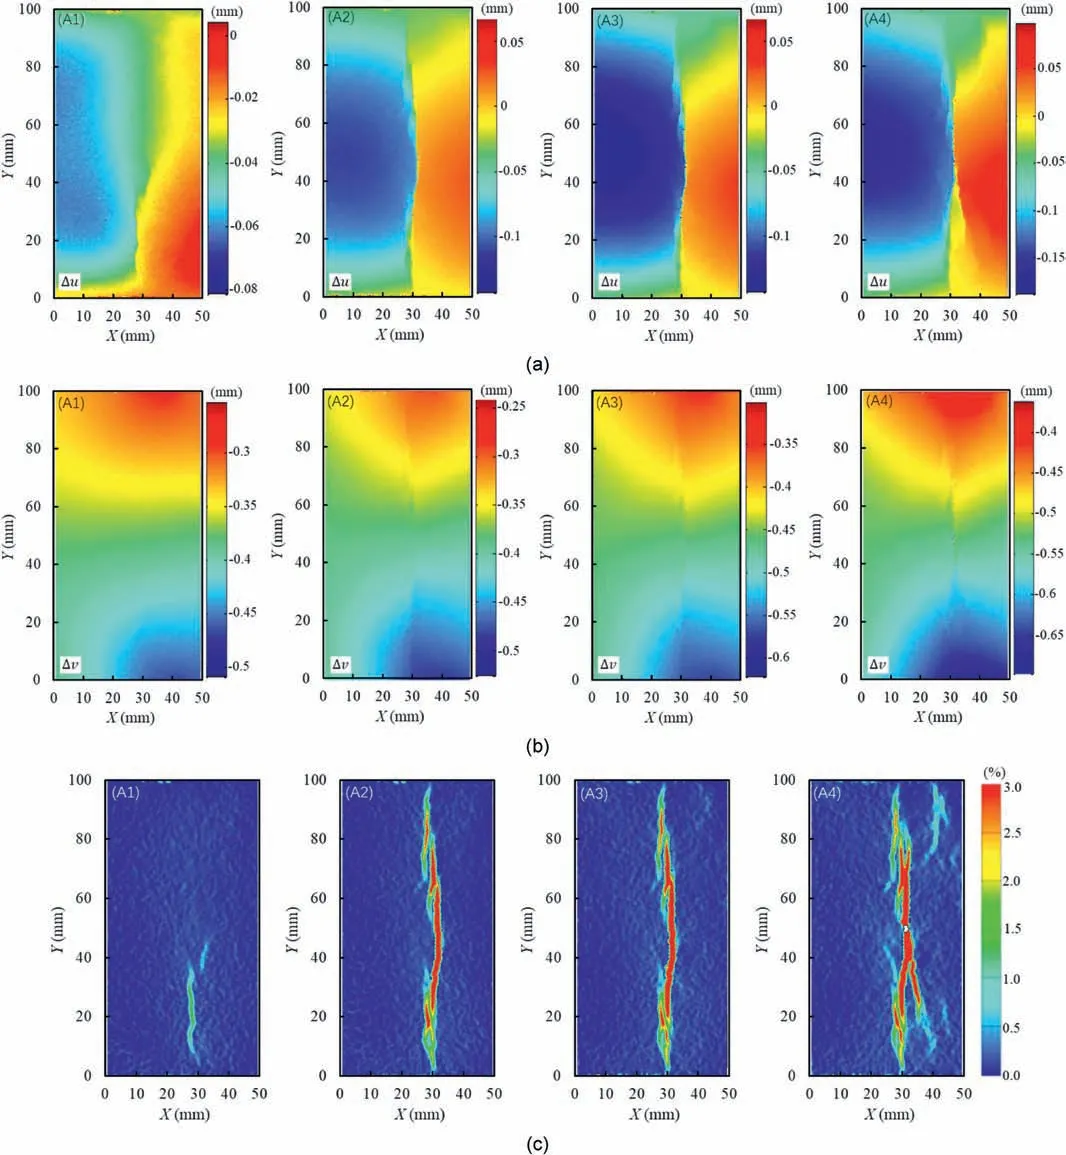
Fig.9. Full-field deformation of specimen G2 at typical moments under static loads:(a)Horizontal displacement fields,(b)Vertical displacement fields,and(c)Maximum principal strain fields. Δu and Δv represent the cumulative displacement increments in horizontal and vertical directions, respectively.
The normalized cumulative AE counts and energy,ranging from 0 to 1,are used to characterize the damage evolution of specimens G9.As shown in Fig.8,the y-intercept reveals that the static loading causes about 40%of the AE events in the specimen,accompanied by about 22.5% AE energy release. Conversely, about 60% AE counts and 77.5% AE energy are detected during the cyclic disturbance. It indicates that the dynamic disturbance plays a great role in the damage accumulation in the rocks. The cumulative AE counts increase with the increasing number of cycles,indicating the gradual accumulation of damage in granite specimens. The normalized cumulative AE energy has a similar increasing trend, and an inflection point of the growth rate is observed in the 8th cycle. The inflection point witnesses the transition from stable to unstable crack propagation within the rocks, which is often viewed as a precursor of the instability of the rocks (Xiao et al., 2010; Duan et al., 2020).
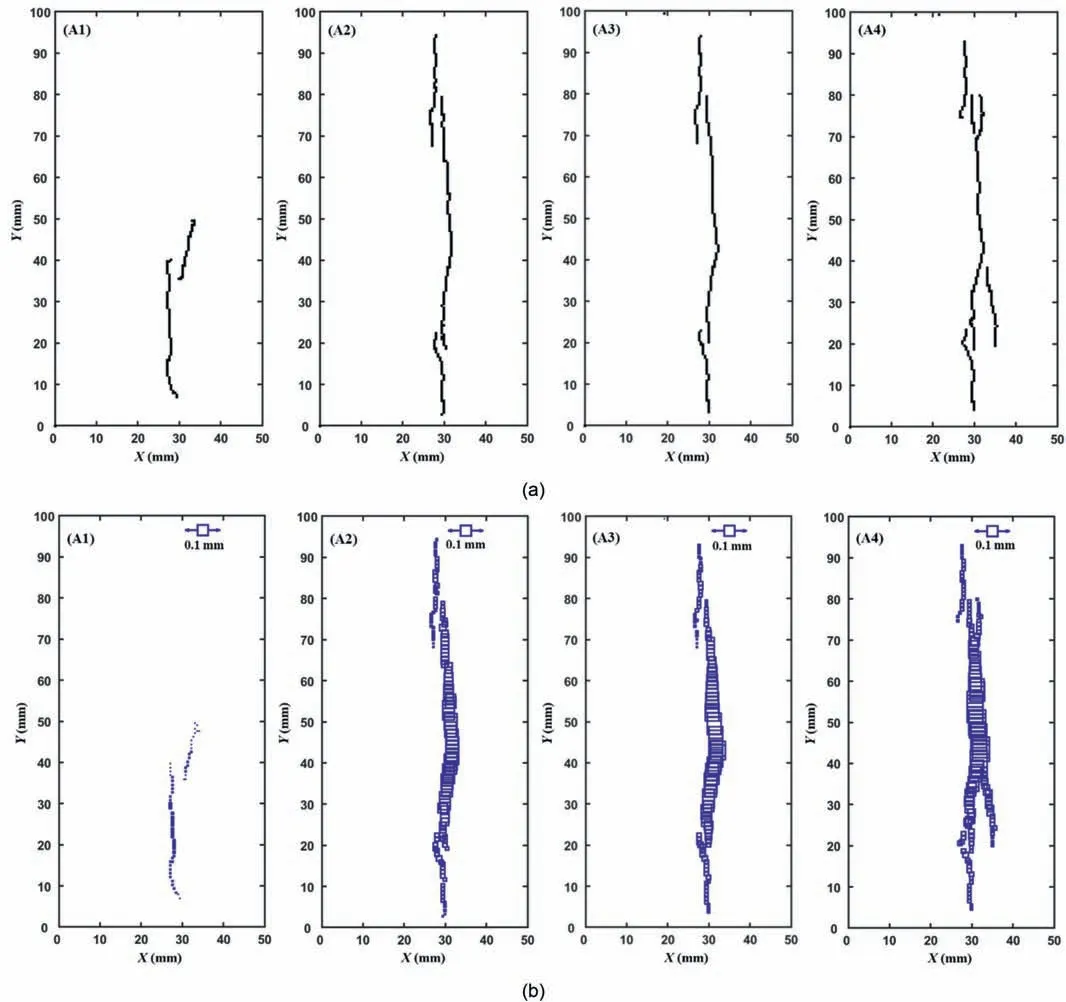
Fig.10. Crack trajectories and crack opening displacement at typical moments for specimen G2: (a) Identified crack trajectories, and (b) Measured crack opening displacement.
3.2. Analysis of fracturing behaviors
When carrying out the DIC analysis, the first image at the beginning of the test was set as the reference image. The camera position and focus were fixed during the tests,and the pixel size is approximately 40 μm × 40 μm. The subset size was set to 10 ×10 pixels and the step length was set to 7 pixels to increase the spatial resolution of the measurement. Based on the DIC technique, the full-field displacements or strains for specimens subjected to static loads and coupled static-dynamic loads can be acquired.Besides,a novel DIC-based method proposed by Miao et al.(2021) is utilized for identifying the fracture paths and measuring the displacement jump across the fractures. The DIC-based method can be divided into three steps:(1)Displacement measurement with the standard DIC technique; (2) Displacement reconstruction around the discontinuities with the subset splitting technique; and (3) Crack detection and displacement jump measurement with the postprocessing method. For more details of the post-processing method, please refer to Miao et al. (2021). The involved parameters in the DIC-based method are the same as those in Miao et al.(2021). With the novel DIC-based method, the displacement jumps across discontinuities can be determined for quantitatively characterizing the fractures in the rocks.
Fig. 9 shows the full-field displacements and strains of granite specimen G2 under static loads at typical moments labeled on the stress-strain curves in Fig.5.Note that the localized strain bands in strain fields provide a clear view of the fracturing evolution in rocks(Fig. 9c). It can be seen that the strain laicization appears on the specimen surface at the stress corresponding to the crack initiation threshold(i.e.point A1,65%of the peak).At point A2,several highstrain bands subparallel to the axial direction appear on the specimen surface.No significant difference is observed between points A2 and A3.When the axial stress approaches the peak,i.e.at point A4, some secondary cracks initiate and propagate,and finally coalesce with the primary crack, resulting in the final rupture of the granite specimen and abundant AE events.
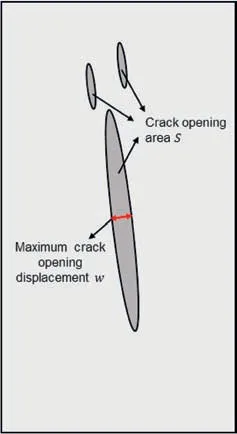
Fig.11. Schematic diagram of the maximum crack opening displacement w and crack opening area S.
With the measured displacement fields shown in Fig.9a and b,the fracture paths and the normal displacement jumps (i.e. crack opening displacement)are acquired and presented in Fig.10.It can be seen that the identified fracture paths in Fig.10a are consistent with that from the strain contours in Fig. 9c. Fig. 10b shows the crack opening displacement across the fractures.It can be seen that the details of the fractures can be characterized by depicting the crack opening displacement over their paths. To quantitatively characterize the crack development of the granite specimens during the loading process, two parameters, i.e. the maximum crack opening displacement (MCOD) and the crack opening area (COA),are defined and illustrated in Fig.11.Fig.12 shows the evolution of the two fracture parameters of specimen G2 under static loads. It can be seen that the two fracture parameters increase with the increasing axial strain at the pre-peak stage. At point A1, the two parameters guarantee a rapid rise due to the crack initiation and fast propagation in granite. During the stable crack propagation stage,i.e.the period between points A1 and A3,both the MCOD and COA increase at a relatively slow rate. When the axial stress approaches the peak, the two fracture parameters increase at an accelerating rate to eventual failure.
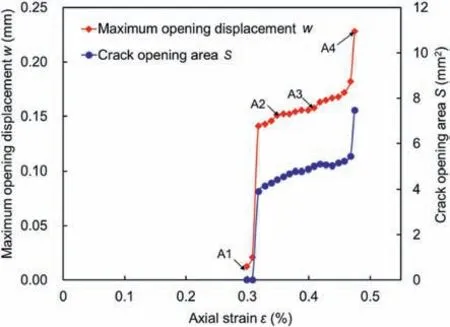
Fig.12. Fracture analysis for specimen G2.
To study the effect of the dynamic disturbance on cracking behaviors,the maximum principal strain contours of specimen G9 at typical moments marked in Fig.5 are shown in Fig.13.As shown in Fig. 5,points A1,B1,C1 and D1 correspond to the wave crest of the 1st, 8th,11th and 12th cycles, while points A2, B2, C2 and D2 correspond to the wave trough of the 1st, 8th,11th and 12th cycles, respectively. As shown in Fig. 13a, as the number of cycles increases, the fractures emanate, then gradually extend, and finally coalesce with each other.Similar evolution law can be seen from the strain contours at the wave troughs (Fig.13b). Note that almost no difference is observed between the contours at points A1 and A2, and the contours at points B1 and B2 are nearly the same.This indicates that the small-amplitude unloading from the upper limit stress to the lower limit stress has a limited influence on the cracking behaviors in the first few cycles.As the number of cycles further increases, the small-amplitude unloading from the wave crest to wave trough promotes the extension of the fractures.Note that a small difference between the strain contours at points C1 and C2 begins to appear. Comparison between the contours at points D1 and D2 further verifies the conclusion above mentioned.Moreover,compared to the fracture features at failure of specimen G2 (Fig. 9), more local tensile splitting cracks are formed in specimen G9 during cyclic disturbance (Fig. 13). The cyclic disturbance contributes to the generation of more fractures,which enhances strain energy dissipation within the rocks. The occurrence of more tensile fracturing has been considered as the main indication of the fatigue effect on failure modes of crystalline and granular rocks (Ghamgosar and Erarslan, 2015; Geranmayeh et al., 2020). Besides, it can be seen that the fracture branching is more notable in the granite specimen when the cyclic disturbances are applied (Fig. 13). The two fracture mechanisms, i.e.more splitting fractures and fracture branching,result in excessive small particles and arbitrary fracturing in failed specimens under coupled static-dynamic loads.
Fig.14 shows the crack opening displacement across the fractures in specimen G9 during the dynamic disturbance. The MCOD and COA are extracted to quantitatively describe the crack development in the rocks,as shown in Fig.15.Note that the evolution of the MCOD and COA with the number of cycles has a similar trend.When the number of cycles n ≤10, the MCOD and COA increase lineally with the increasing number of cycles, and no significant difference in the MCOD and COA between the wave crest and trough in the same cycle is observed. A change in the slope is detected at n = 10, and then a greater growth rate is observed,which marks the accelerated crack propagation in rocks. Besides,the difference in the MCOD and COA between the wave crest and trough in a cycle appears when the number of cycles n>10. It indicates that the small-amplitude unloading from the wave crest to wave trough results in the further development of the fractures.Note that the inflection point from the stable to unstable crack propagation occurs at n = 10 by observing the evolution trend of MCOD and COA,while the transition occurs at n = 8 by observing the evolution trend of the cumulative AE energy.The reason for the difference will be analyzed and explained in Section 4.
4. The factors affecting rock damage and fracturing evolution
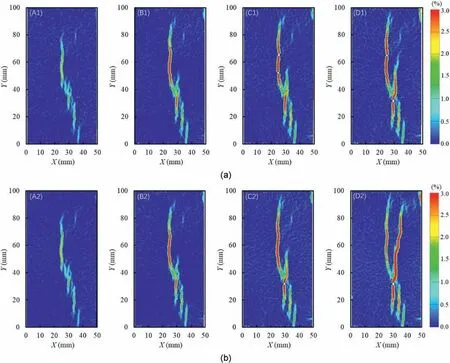
Fig.13. Maximum principal strain contours at typical moments during dynamic disturbance for specimen G9:(a)Typical moments at wave crest,and(b)Typical moments at wave trough.
According to Section 3, it can be seen that the measured parameters from the AE and DIC techniques can effectively characterize the damage evolution and crack development during the cyclic disturbance stage.Thus,these parameters are further used to study the effect of three influencing factors,i.e.initial static stress,disturbance amplitude,and disturbance frequency,on the damage and fracturing evolution in granite. Hereafter, the cumulative AE counts and energy are used to characterize the damage evolution in granite, and two fracture parameters from the DIC technique, i.e.MCOD and COA, are adopted to describe the crack development.Due to the varied static-dynamic loading conditions,the maximum number of cycles that the rocks can withstand may not in the same order. To facilitate comparison and reveal more details of the damage and fracturing evolution, the logarithmic cycle will be taken as abscissa in this section, rather than the absolute cycle.According to Xiao et al. (2011), the precursor to an upcoming disaster can be detected more easily and early when taking the logarithmic cycle as abscissa.
4.1. Effect of initial static stress
Fig.16 shows the stress-strain curves of granite specimens subjected to different initial static stresses.Different initial static stresses introduce different initial damage into rocks before the cyclic disturbance is applied, resulting in different mechanical responses and damage evolution during the cyclic disturbance.In Fig.16,large gaps between cycles are observed from the stress-strain curve of the granite specimen subjected to initial static stress of 170 MPa.It has been demonstrated that the gaps between cycles are associated with the brittle cracking in rocks(Li et al.,2020).
Fig. 17 shows the variation in the initial static stress with the maximum number of cycles that the rocks can withstand.Because inevitable differences in inner structures among rock specimens produce dispersion within the same dataset, two close values are used for analysis in this study. Under the same disturbance frequency and amplitude,the average numbers of cycles that the rocks can withstand are 1623,166 and 42 when the initial static stress is set to 160 MPa,170 MPa and 180 MPa,respectively.Thus,it can be stated that the static loading history plays a key role in the dynamic response of the rocks. When the rocks experience higher static stress, the rocks fail after fewer cycles. Similar findings are also reported by other scholars. According to Su et al. (2017a) and Geranmayeh et al.(2018),the rocks often have a shorter fatigue life when the initial static stress increases.
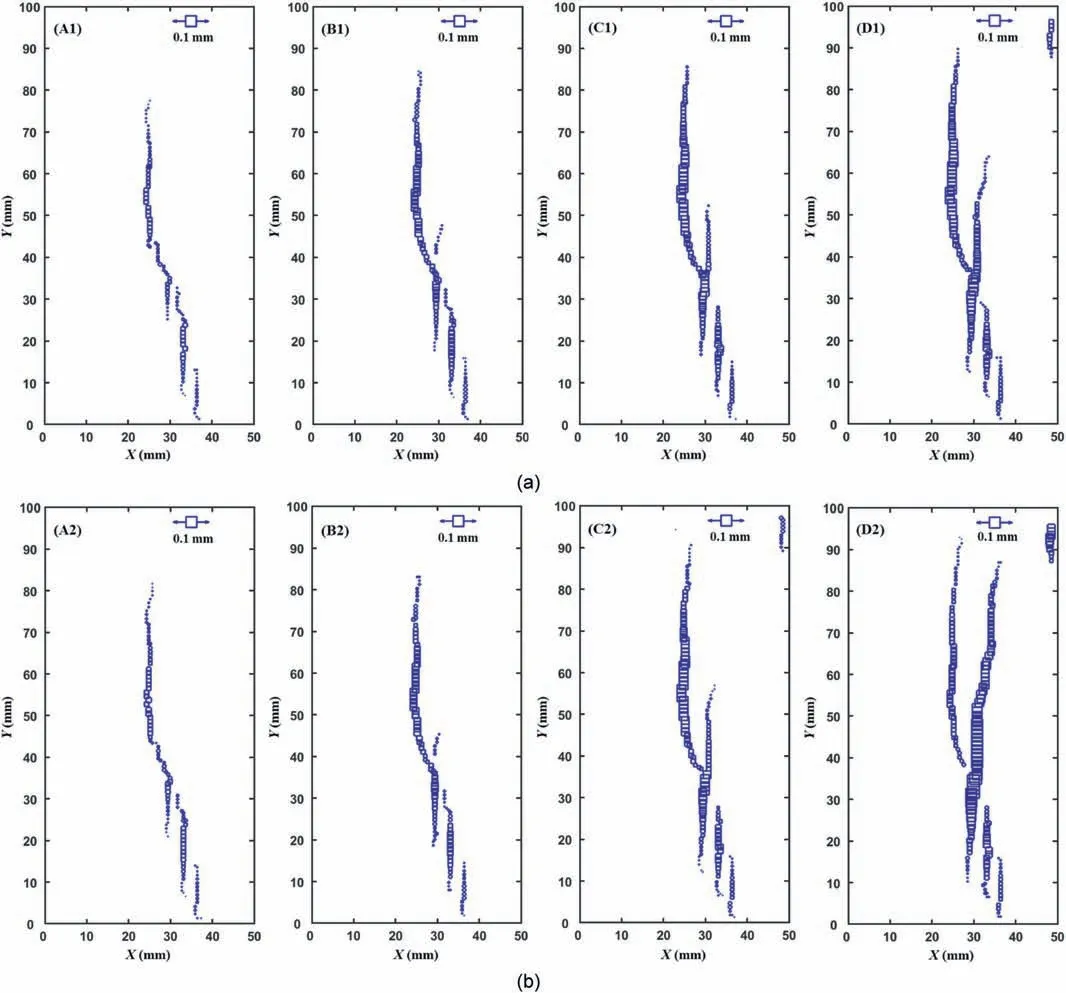
Fig.14. Crack opening displacement at typical moments during dynamic disturbance for specimen G9:(a)Typical moments at wave crest,and(b)Typical moments at wave trough.
Fig.18 shows the normalized cumulative AE counts and energy of the granite specimens subjected to different initial static stresses as a function of the logarithmic cycle.As shown in Fig.18a and b,all the AE evolution curves exhibit a two-stage developing trend. At the first stage, the cumulative AE counts and energy increase linearly with the increasing number of cycles and this stage takes a great proportion of the whole disturbance stage. Note that the greater the initial static stress is,the greater the growth rate of the first stage is. At the second stage, the considerable increase in cumulative AE counts and energy reveals the accelerated crack propagation in the rock specimen. The determination of the inflection point is essential for the damage evolution analysis. To reduce the error caused by manual picking of the inflection point,the piecewise fitting is adopted and the inflection point is regarded as the intersection of two straight fitting lines (Fig.19). In Fig.18a,the identified inflection points are located at the 1300th,100th and 42nd cycles for the granite specimens subjected to initial static stresses of 160 MPa, 170 MPa and 180 MPa, respectively. Similar results can be obtained from the evolution curve of the normalized cumulative AE energy, as shown in Fig.18b.
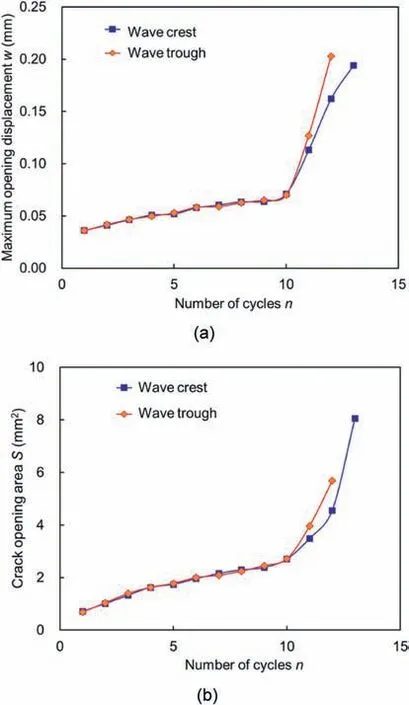
Fig.15. Fracture analysis for specimen G9:(a)Maximum crack opening displacement,and (b) Crack opening area.
The fracturing behavior for the granite specimens subjected to different initial static stresses during the cyclic disturbance is shown in Fig.20.Note that the evolution of the MCOD and COA can still be roughly divided into two stages. A modest increase of the two fracture parameters at the first stage reveals the stable crack growth in rocks,and then a considerable increase at the accelerated stage indicates unstable crack growth in rocks.Note that the granite specimen subjected to the initial static stress of 180 MPa has greater MCOD and COA in the first cycle than the other two specimens subjected to lower initial static stress.The fractures in the first cycle can be approximately viewed as the initial state before the cyclic disturbance is applied.Moreover,the granite specimen subjected to the initial static stress of 180 MPa has a greater growth rate at the first stage;severer deterioration resulting from greater initial static loads makes the rocks more sensitive to the dynamic disturbance.With the piecewise fitting method, the inflection points are identified from the evolution curves of the fracture parameters and marked in Fig.20.It can be seen that the inflection points identified from the fracture parameters are close to that from AE parameters for the specimens subjected to initial static stress of 180 MPa.However, for the specimens subjected to initial static stresses of 160 MPa and 170 MPa, the beginning of the accelerated stage identified from the evolution curves of the two fracture parameters lags than that from AE parameters. It means that the upcoming disaster is detected more easily and early from the AE evolution,which is beneficial for disaster early-warning in engineering sites.
4.2. Effect of disturbance amplitude
The stress-strain curves of granite specimens under cyclic disturbance with different disturbance amplitudes are shown in Fig. 21. The relationship between the disturbance amplitude and the maximum number of cycles that the granite specimens suffered is shown in Fig. 22. Under the same initial static stress and disturbance frequency,the average numbers of cycles that the rock can withstand are 153,82 and 5 when the disturbance amplitudes are set to 10 MPa, 20 MPa and 30 MPa, respectively. A higher amplitude will lead to the instability of the rocks with fewer cycles,which has been verified by previous scholars (Xiao et al., 2009;Geranmayeh et al., 2018).
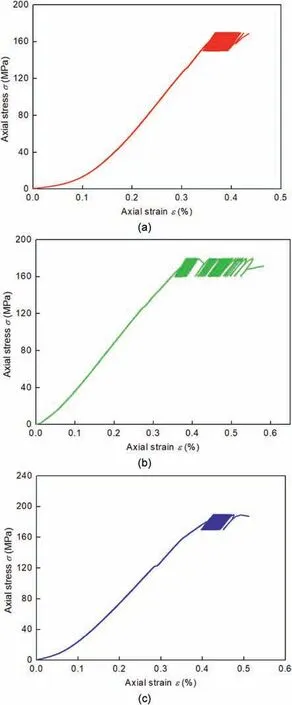
Fig.16. Stress-strain curves of granite specimens under cyclic disturbance with A =10 MPa, f = 1 Hz, and different initial static stresses: (a) σi = 160 MPa, (b) σi =170 MPa, and (c) σi = 180 MPa.
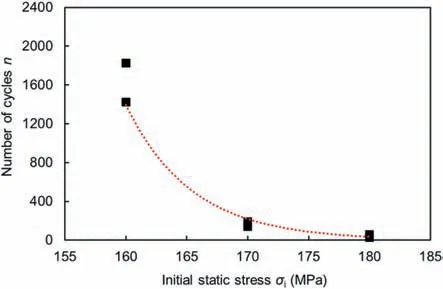
Fig.17. Variation in the maximum number of cycles with increasing initial static stress.
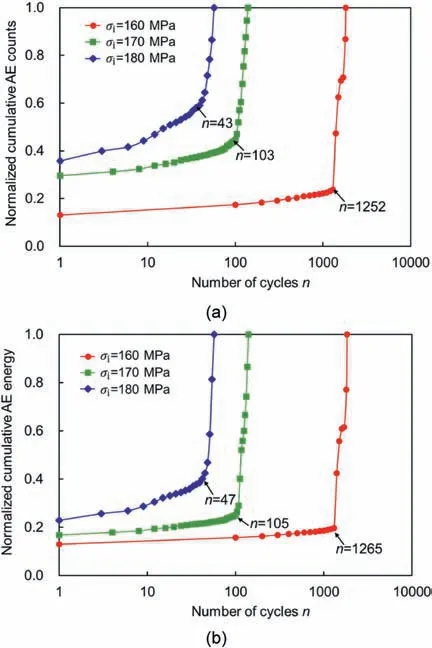
Fig.18. AE responses of the granite specimens under cyclic disturbance with different initial static stresses: (a) Normalized cumulative AE counts, and (b) Normalized cumulative AE energy.
Fig.23 shows the evolution of AE parameters in rock specimens under different disturbance amplitudes. When the disturbance amplitudes are 10 MPa and 20 MPa,a typical two-stage developing trend can be observed, and the transition from the steady stage to the accelerated stage occurs in the 103rd and 70th cycles, respectively.The proportions of the stable stage account for 74%and 72%of the entire cyclic disturbance stage for the granite specimens under the disturbance amplitudes of 10 MPa and 20 MPa,respectively. However, for the granite specimen under the disturbance amplitude of 30 MPa, the cumulative AE counts and cumulative AE energy increase rapidly with the increasing number of cycles.Besides,its inflection point can hardly be identified from the evolution curve, indicating that the upcoming disaster cannot be detected easily and early. As shown in Fig. 23, the increase rate of the stable stage for specimens under the disturbance amplitude of 30 MPa is much larger than that for specimens under the disturbance amplitudes of 10 MPa and 20 MPa. The greater disturbance amplitude aggravates the rock damage, and the damage accumulates at a high growth rate once the dynamic disturbance is applied.Thus,the rocks would fail after a few cycles when the disturbance amplitude retains a high value.
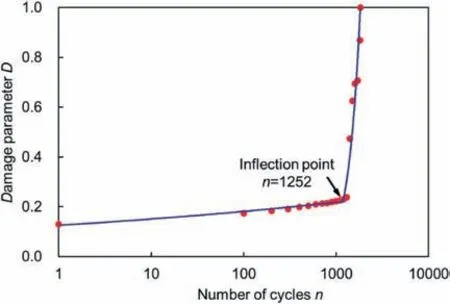
Fig.19. Determination of the inflection point by piecewise linear fitting.
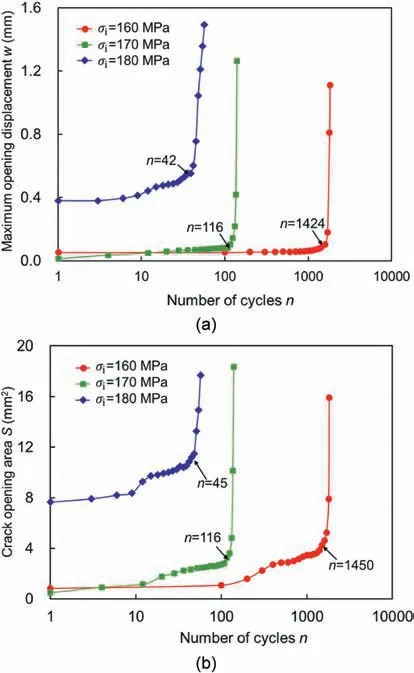
Fig. 20. Fracturing behaviors of granite specimens under cyclic disturbance with different initial static stresses: (a) Maximum crack opening displacement, and (b)Crack opening area.
Fig. 24 shows the fracturing behaviors of granite specimens under cyclic disturbance with different disturbance amplitudes.Similar to the AE evolution,the fracturing evolution also exhibits a two-stage evolution trend during the cyclic disturbance loading process. It can be seen that the MCOD and COA increase at a low growth rate at the first stage, indicating that the cracks develop stably in rocks.With the increase in the number of cycles,the crack density accumulates and the number of cracks further increases in the rocks.After several cycles,the unstable crack propagation takes place in the rocks,leading to accelerated increases in the MCOD and COA.Besides,the transition from the stable stage to the accelerate stage occurs at the 5th, 92nd and 124th cycles when the disturbance amplitudes are 10 MPa, 20 MPa and 30 MPa, respectively. Again, the identified transition points from the AE and DIC techniques exhibit a significant distinction. The inflection points identified from the fracturing evolution are far lagging than those from the AE evolution. The possible reasons for the difference are given below.The DIC technique provides the displacement fields of the target surface, thus only the fractures exposed on the target surface can be traced and the crack initiation and propagation in the interior part of the rocks cannot be detected by DIC.Besides,the accuracy of the measured displacement from the DIC technique is in the order of 1 μm,i.e.in the mesoscale.As for the DIC technique,it can monitor the stress-induced defects within the rock specimens from microscale to macroscale by detecting high-frequency elastic waves. The microcracks inside the rocks can only be detected by the AE technique. Even so, the two fracture parameters provide a direct description of the cracking evolution.
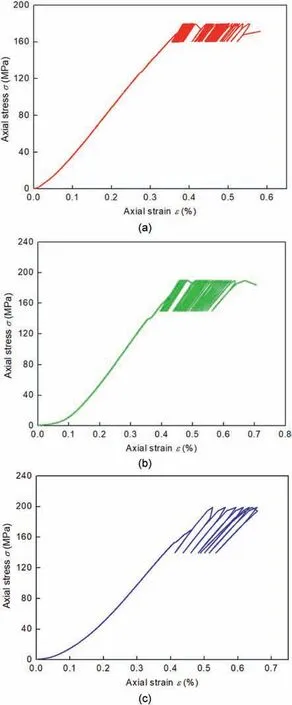
Fig. 21. Stress-strain curves of rock specimens under cyclic disturbance with σi =170 MPa, f = 1 Hz, and different disturbance amplitudes: (a) A = 10 MPa, (b) A =20 MPa, and (c) A = 30 MPa.
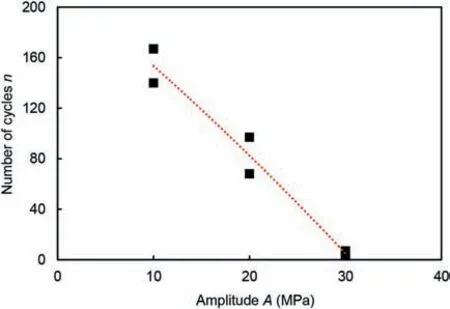
Fig. 22. Variation in the maximum number of cycles with the increasing disturbance amplitude.
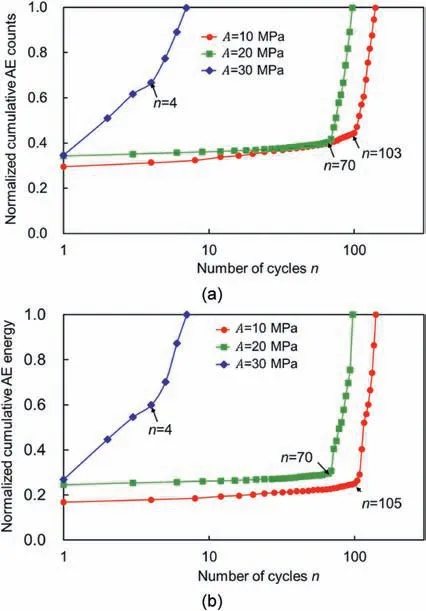
Fig. 23. AE responses of rock specimens under cyclic disturbance with different disturbance amplitudes: (a) Normalized cumulative AE counts, and (b) Normalized cumulative AE energy.
4.3. Effect of disturbance frequency
Fig. 25 presents the stress-strain curves of granite specimens under cyclic disturbance with different disturbance frequencies.The relation between the disturbance frequency and the maximum number of cyclic disturbance that the granite specimens can suffer is shown in Fig. 26. It can be seen that fewer cycles are needed to cause the instability of the rocks when a low disturbance frequency is set. A similar finding has also been reported by other scholars.According to Geranmayeh et al.(2020)and Zheng et al.(2020),the rocks tend to suffer greater cycles and have a longer fatigue life when the loading frequency increases.
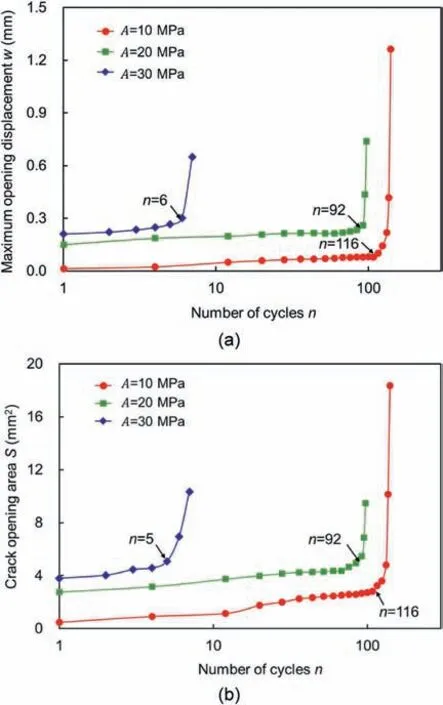
Fig.24. Fracturing behaviors of rock specimens under cyclic disturbance with different amplitudes: (a) Maximum crack opening displacement, and (b) Crack opening area.
Fig. 27 shows the AE evolution of the rock specimens under different disturbance frequencies.It can be seen that the evolution of the cumulative AE counts and energy for all specimens exhibits a two-stage developing trend. The identified inflection point is located at the 8th,32nd and 103rd cycles for the granite specimen under the disturbance frequencies of 0.2 Hz, 0.5 Hz and 1 Hz,respectively. The specimen under the disturbance frequency of 0.2 Hz has a greater increase rate at the first stage than the specimens under the disturbance frequencies of 0.5 Hz and 1 Hz. It indicates that the rock deterioration is more significant when the lower-frequency cyclic disturbance is applied. The reason for that is because the stress fields in rocks suffering high-frequency cyclic disturbance are unable to fully adjust in each cycle,resulting in that the initiated cracks are not fully develop. On the contrary, the cracks can fully develop in a cycle in granite specimens under the cyclic disturbance of low frequency,resulting in more fragments at rock failure (Zheng et al., 2020).
A similar two-stage developing trend is also observed from the fracturing evolution, as shown in Fig. 28. When a greater disturbance frequency is set, the steady stage takes a greater proportion of the whole disturbance stage and the rocks can endure more cycles. The low-frequency disturbance facilitates the nucleation and development of the cracks in each cycle, resulting in rock instability with fewer cycles.
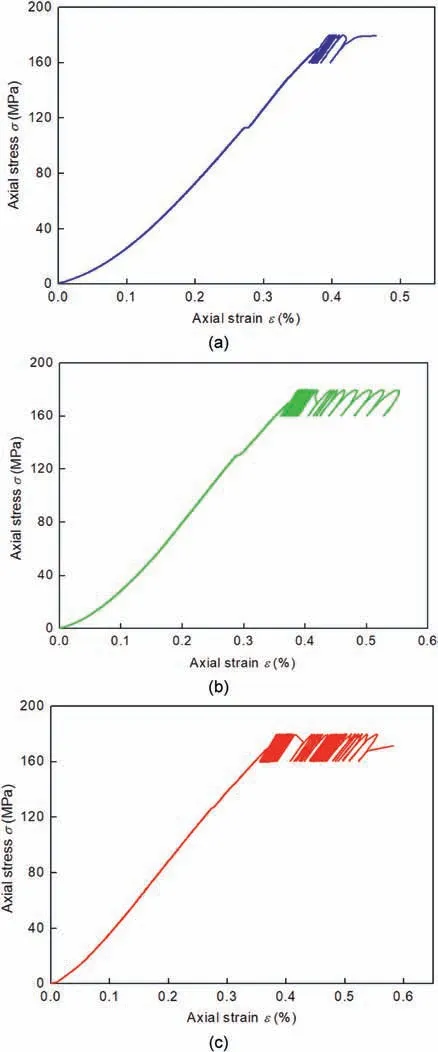
Fig. 25. Typical stress-strain curves of rock specimens under cyclic disturbance with A = 10 MPa,σi = 170 MPa,and different frequencies:(a)f = 0.2 Hz,(b)f = 0.5 Hz,and (c) f = 1 Hz.
5. A cumulative damage model for the rocks under staticdynamic loads
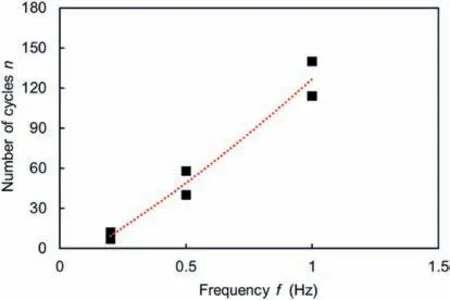
Fig. 26. Variation in the maximum number of cycles with the increasing disturbance frequency.
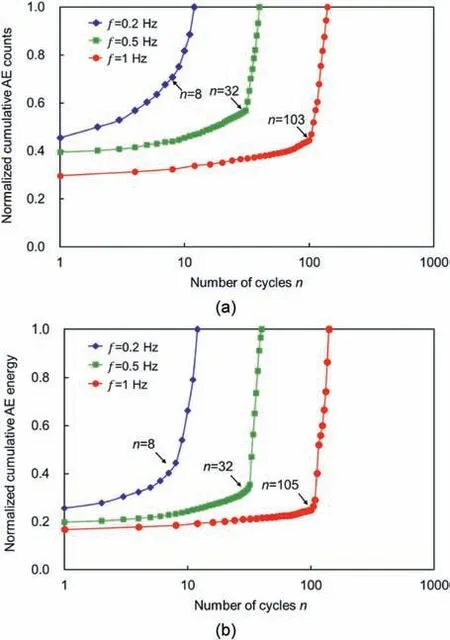
Fig. 27. AE responses of rock specimens under cyclic disturbance with different disturbance frequencies: (a) Normalized cumulative AE counts, and (b) Normalized cumulative AE energy.
An applicable damage model is necessary for the damage prediction and stability assessment of the rocks under static-dynamic loads. Among the four parameters above mentioned, the cumulative AE counts and energy can fully characterize the development of the microcracks and are often used as damage variable to describe the damage evolution in rocks(Xiao et al.,2010;Duan et al.,2020).The AE count is directly related to the number of microcracks,and the AE energy is considered to be a portion of total energy dissipated from the stress-induced defects (Ishida et al., 2017; Lin et al., 2019b). As shown in Figs.18, 23 and 27, the normalized cumulative AE counts and energy exhibit a two-stage developing trend, which can characterize the degradation law of the rocks subjected to static-dynamic loads. Besides, the cumulative AE counts and energy can take the initial damage introduced by static loads into consideration,and their normalized value at rock failure is equal to 1. Therefore, it is reasonable to use the normalized cumulative AE counts or energy as the damage variable to build the damage model and characterize the damage evolution in the rocks under static-dynamic loads.
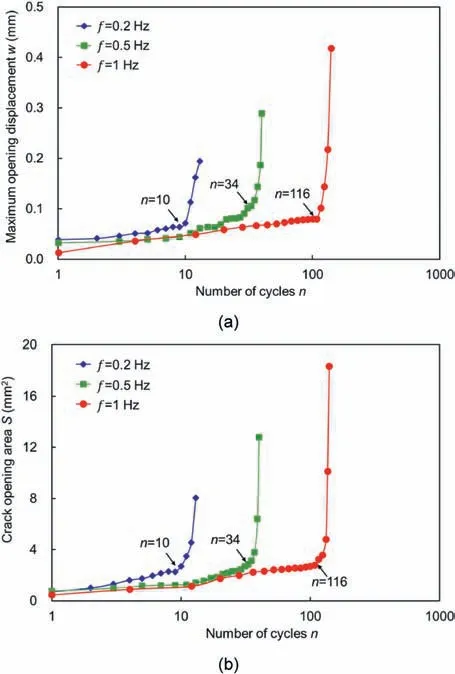
Fig.28. Fracturing behaviors of rock specimens under cyclic disturbance with different frequencies: (a) Maximum crack opening displacement, and (b) Crack opening area.
Based on the characteristics of the damage evolution curve, a linear-exponential damage model modified from Xiao et al. (2011)is given below:

where D represents the damage in the rocks after n cycles;D0is the initial damage from the static stress at the first cycle of cyclic disturbance;and a, m and k are the parameters for controlling the shape of the damage evolution curves.
Three parameters were utilized in Xiao et al. (2011) to control the shape of the damage evolution curves.However,the fitting does not always converge because their model is over-parameterized and mutual dependency exists between parameters. The modified model in this study has simplified the function, thus both the convergency and the excellent fitting result can be achieved.Parametric analysis performed by Xiao et al.(2011)has studied the respective effects of the parameters in the model.It has been found that parameters a and m determine the damage growth rate and duration of the first stage, respectively. A higher a value corresponds to a higher damage increase rate at the first stage,leading to the rock failure after fewer cycles. Contrarily, more cycles can be endured and the residual life with the rocks is longer when a greater m is measured. The parameter k mainly affects the convergence rate and the proportion of the accelerated stage.Note that when a smaller k is set,the rocks fail after a few cycles with a high convergence rate, exhibiting obvious brittle failure characteristics.
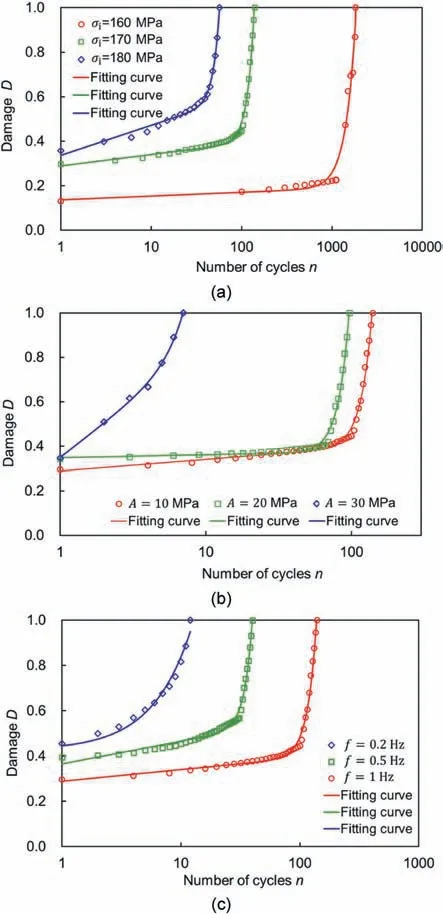
Fig. 29. The damage evolution and fitting curves for rock specimens subjected to different static-dynamic loading conditions:(a)Varied initial static stresses,(b)Varied disturbance amplitudes, and (c) Varied disturbance frequencies.
When taking the normalized cumulative AE counts as damage variable, the fitting curves for rock specimens under different static-dynamic loading conditions are shown in Fig.29.The fitting parameters are also given in Table 2. It can be seen that the fitting curves are highly relevant to the AE data, and the coefficient of determination R2is higher than 0.975. The effects of initial static stress, disturbance amplitude and disturbance frequency on the damage evolution can be quantitatively characterized using the parameters in the damage model. As shown in Table 2, the rocks subjected to high static stress have a greater D0. Besides, the damage from initial static stress also affects the damage evolution,thus the parameters a, m and k vary with different initial static stresses.The rock specimens subjected to higher initial static stress generally have a smaller α, and greater m and k, compared to specimens subjected to lower initial static stress. It means that a low increase rate and a high proportion of the first stage are witnessed during the cyclic disturbance for the rocks subjected to a low initial static stress. Besides, parameters a, m and k are also affected by the disturbance amplitude and frequency.It can be seen that greater a and k and smaller m are measured from the damage evolution of the rock specimens subjected to the cyclic disturbance with higher amplitude and lower frequency. It indicates that the high amplitude and low frequency are adverse factors to the stability of the rocks,which causes a high damage increase rate and a high proportion of the accelerated stage. In a word, cyclic disturbance with high amplitude and low frequency facilitate the initiation, opening and extension of cracks in the rocks. Besides, an interesting fitting result occurs in the rock specimen subjected to static-dynamic loads with σi= 180 MPa, A = 10 MPa, and f = 1 Hz(Table 2).It can be seen that the fitting parameter a for the specimen is equal to zero, which means that the rock damage is growing exponentially during the cyclic disturbance.As mentioned above, the proposed damage model is well suited to describe the damage evolution of the rocks under different static-dynamic loading conditions.
6. Conclusions
In deep rock and mining engineering, the rocks are often subjected to a coupled effect of high static stress and dynamic disturbance, resulting in different damage and fracturing characteristics of rocks from that of the shallow rocks. However, up to now, the failure mechanism of the rocks suffering from the coupled staticdynamic loads remains unclear. Besides, the difference in the damage evolution and fracturing behaviors of rocks under different static-dynamic loading conditions has not been studied systematically. Based on this, a series of uniaxial coupled static-dynamic tests was carried out to investigate the failure mechanisms of the high-stressed rocks triggered by slight disturbance. During the tests, the combination of the AE and DIC techniques was used to trace the damage evolution and fracturing behaviors of the rocks.Besides,the effects of the three influencing factors,i.e.initial static stress, disturbance amplitude and disturbance frequency, on the development of the damage and fractures were analyzed.The main conclusions are summarized as follows:

Table 2 Summary of fitting parameters.
(1) Comparison between the static tests and the coupled staticdynamic tests reveals that the dynamic disturbance has a great effect on the AE characteristics and fracturing behaviors of the rocks. For the rocks under static loads, not so many AE events are detected before the peak, and the sudden brittle failure at the peak is accompanied by a rapid rise of the AE counts and energy. For the rocks under the coupled static-dynamic loads, even though the upper limit stress of the cyclic disturbance is lower than the rock strength, several peaks of the AE count rate appear during the cyclic disturbance, indicating the continuous development of the damage and fractures. Moreover, compared to the fracture characteristics of granite specimens subjected to static loads,more local tensile splitting cracks are formed during the cyclic disturbance, resulting in more rock fragments at failure.
(2) Both the damage and fracturing evolution exhibit a twostage developing trend. At the first stage, the cumulative AE parameters and fracture parameters increase linearly with the increasing number of cycles and this stage takes a great proportion of the whole disturbance process. At the second stage, these parameters increase at an extremely high rate, indicating that accelerated failure is taking place in the rock specimen. The inflection point, where the transition takes place from a steady stage to an accelerated stage, can be easily identified from the evolution curves,which can be used for determining the critical instability in the rocks.
(3) The three factors, i.e. initial static stress, disturbance amplitude and disturbance frequency, have a great influence on the damage and fracturing evolution of the rocks.High initial static stress,low disturbance frequency and high disturbance amplitude are adverse factors to the stability of the rocks,which would induce a high damage increase rate of the steady stage and a high proportion of the accelerated stage.In a word, high initial static stress introduces greater initial damage in the rocks before the dynamic disturbance is applied,and cyclic disturbance with high amplitude and low frequency facilitates the initiation,opening and extension of cracks in the rocks.
(4) The cumulative AE counts and energy are appropriate to act as damage variables for their distinct physical meaning,capable of describing the degradation behavior, and consideration of the damage from initial static stress.Based on the characteristics of the damage evolution curve, a linearexponential damage model is utilized to predict rock instability. The fitting results match well with the experimental data, which indicates that the proposed damage model can well characterize the damage evolution of the rocks under different static-dynamic loading conditions.
Declaration of competing interest
The authors declare that they have no known competing financial interests or personal relationships that could have appeared to influence the work reported in this paper.
Acknowledgments
This work was supported by the State Key Research Development Program of China (Grant No. 2017YFC0804203), National Natural Science Foundation of China(Grant No.51621006),and the Open Fund of the State Key Laboratory of Geomechanics and Geotechnical Engineering, Institute of Rock and Soil Mechanics,Chinese Academy of Sciences(Grant No.Z018001).The first author would like to thank the Chinese Scholarship Council for financial support.
 Journal of Rock Mechanics and Geotechnical Engineering2021年5期
- Journal of Rock Mechanics and Geotechnical Engineering的其它文章
- Surface characteristics analysis of fractures induced by supercritical CO2 and water through three-dimensional scanning and scanning electron micrography
- Prediction of fracture and dilatancy in granite using acoustic emission signal cloud
- Hysteresis in the ultrasonic parameters of saturated sandstone during freezing and thawing and correlations with unfrozen water content
- Coupled Eulerian-Lagrangian simulation of a modified direct shear apparatus for the measurement of residual shear strengths
- A novel true triaxial test system for microwave-induced fracturing of hard rocks
- Hydromechanical behavior of unsaturated expansive clay under repetitive loading
