Geomechanical properties will constrain CO2 injection into the lower Ordovician Rose Run sandstone deep saline reservoir, Appalachian Basin,Kentucky, USA
John Richard Bowersox, Stephen F. Greb, Junfeng Zhu, David C. Harris
Kentucky Geological Survey, University of Kentucky, Lexington, KY, 40506-0107, USA
Keywords:Appalachian Basin Rose Run sandstone Geomechanics Carbon sequestration Step-rate testing
ABSTRACT The Kentucky Geological Survey (KGS) 1 Hanson Aggregates stratigraphic research well, Carter County,Kentucky, USA, was drilled to a total depth of 1474 m as a field-scale test of potential CO2 storage reservoir properties in the Central Appalachian Basin. Geomechanical properties of the Rose Run sandstone (upper Ordovician Knox group) were tested for its suitability as a storage reservoir. A 9.8-m thick section of the Rose Run was penetrated at 1000 m drilled depth and a whole-diameter core and rotary sidewall cores were taken. Average porosity and permeability measured in core plugs were 9.1%and 44.6 mD,respectively.Maximum vertical stress gradient calculated in the wellbore was 26 MPa/km.Wellbore fractures in dolomites underlying and overlying the Rose Run follow the contemporary N53°E Appalachian Basin stress field. The Rose Run elastic geomechanical properties were calibrated to values measured in core plugs to evaluate its fracturing risk as a CO2 storage reservoir. Mean Young’s modulus and Poisson’s ratio values of the Rose Run were 45 GPa and 0.23,respectively,whereas Young’s modulus and Poisson’s ratio values were 77.1 GPa and 0.28,respectively,in the overlying Beekmantown dolomite,suggesting the Rose Run may fracture if overpressured during CO2 injection but be confined by the Beekmantown. Triaxial compressive strength measured in core plugs found the Rose Run and Beekmantown fractured at mean axial stresses of 156.5 MPa and 282.2 MPa, respectively, confirming the Beekmantown as suitable for confining CO2 injected into the Rose Run.A step-rate test was conducted in a mechanically-isolated 18.6-m interval bracketing the Rose Run.Static Rose Run reservoir pressure was 9.3 MPa,and fracture gradient under injection was 13.6 MPa/km,suggesting step-rate testing before CO2 injection, and subsequent pressure monitoring to ensure confinement. As the region around the KGS 1 Hanson Aggregates well is underpressured and adjacent to faulted Precambrian basement, further research is needed to evaluate its induced seismicity risk during CO2 injection.
1. Introduction
In the Appalachian Basin of eastern Kentucky and adjacent Ohio and West Virginia(Fig.1),the Knox group(upper Cambrian-lower Ordovician) is divided into the upper Cambrian Copper Ridge dolomite,Rose Run sandstone and lower Ordovician Beekmantown dolomite (Fig. 2). The Rose Run, the subject of this study, has historically been developed in the Appalachian Basin for oil and gas production(Donaldson et al.,1992;Rike,1992;Riley and Baranoski,1992; Riley, 1992, 1994; Riley et al., 2002), disposal of produced water from oil and gas fields, and industrial waste disposal(McNealy, 1991; Wickstrom, 1993). In the late 1990s (e.g. Gupta et al., 1999), investigations into carbon sequestration as a means of mitigating CO2emissions from coal-fired power plants in the Appalachian Basin identified the Rose Run as a candidate for the subsurface storage of supercritical CO2in a deep saline aquifer(Wickstrom et al., 2008).
1.1. The Kentucky Geological Survey 1 Hanson Aggregates stratigraphic research well
The Kentucky Geological Survey(KGS)drilled the KGS 1 Hanson Aggregates stratigraphic research well in 2013 to conduct a fieldscale assessment of the subsurface CO2storage capacity in deep saline reservoirs in the Knox and underlying strata in the Central Appalachian Basin in eastern Kentucky(Bowersox et al.,2013,2018,2019a;Greb et al.,2017).All depths in the KGS 1 Hanson Aggregates well were measured from the drilling rig Kelly Bushing(KB)which was 2 m above the ground level elevation of 225.5 m. The well drilled in northern Carter County, Kentucky, USA. (Fig. 1), at a location where all potential reservoirs, confining strata and Precambrian basement rocks could be penetrated at a total well depth(TD) less than 1524 m below the surface (Bowersox et al., 2013,2018, 2019a). The KGS 1 Hanson Aggregates well was drilled as a vertical wellbore. It cored Precambrian Grenville gneiss basement at 1439 m true vertical depth (-1213.5 m subsea elevation) and drilled to reach a TD of 1474 m. Several tests were successfully conducted in the wellbore, including tests of reservoir and in situ rock properties and geomechanical properties of the middle Cambrian Basal and Maryville sands, Copper Ridge and Rose Run(Fig. 2; Greb et al., 2017; Bowersox et al., 2018, 2019a).
This study presents results of tests in the Rose Run and contributes to the assessment of subsurface CO2storage capacity in the Rose Run in the Central Appalachian Basin in eastern Kentucky and along the Ohio River industrial corridor (Gupta et al., 2005; Lucier et al., 2006; Gupta, 2008a,b). This information is vital should mitigation of CO2emissions in Kentucky and adjacent states be required for coal-fired power plants and other industrial facilities dependent on fossil fuels. All data are obtained from the KGS 1 Hanson Aggregates well (Kentucky Geological Survey, 2021).
1.2. Previous work
Oil and gas production from the Rose Run subcrop area,where the Rose Run is unconformably truncated,follows a northeast trend from south-central Ohio into west-central Pennsylvania (Riley,1994). Average depth of the Rose Run wells in Baltic oil field in the center of this trend is 1850-1950 m,average porosity is 8%,and permeability is 0.01-198 mD (Riley,1994; Riley et al., 2002; Greb et al., 2009). A survey of potential CO2sequestration reservoirs in the Midwest Regional Carbon Sequestration Partnership (MRCSP)region(Wickstrom et al.,2005)identified the Rose Run as a suitable CO2sequestration reservoir in contiguous geographic areas of Ohio,West Virginia, and Pennsylvania. This research contributed to the drilling of two wells in the Appalachian Basin that, in part, tested CO2sequestration in the Rose Run. Battelle Memorial Institute tested CO2storage capacity in Knox and sub-Knox deep-saline reservoirs in a well drilled at the Ohio River CO2Storage Project site at the American Electric Power(AEP)Mountaineer Power Plant on the Ohio River at New Haven, West Virginia (Gupta et al., 2005;Lucier et al., 2006; Gupta, 2008a, b; Lucier and Zoback, 2008),118 km northeast of the KGS 1 Hanson Aggregates well (Fig.1). In the Battelle 1 AEP well, average porosity measured in core plugs from the Rose Run was 6.3% and average permeability was 13.25 mD. Re-interpretation of porosity calculated from the formation density log in this study found a net total of 4.4 m in three thin Rose Run sands in the interval of 2366-2388 m with porosity greater than the industry-standard 7% porosity cutoff for evaluating CO2storage in a deep-saline reservoir (see the discussion in Medina et al., 2011).
AEP and Battelle conducted an injection test at the Mountaineer Power Plant as part of the Product Validation Facility(PVF)project in the Battelle 2 AEP well which was drilled and tested CO2injection into the Rose Run over a period of 18 months, from October 2009 to May 2011 (Bhattacharya, 2011). Pre-injection minifrac testing found a low fracture gradient in the Rose Run of 6.71 MPa above the pre-injection static reservoir pressure (Gupta, 2008a;McNeil et al., 2014). As a consequence, CO2injection pressure was cautiously limited to the pre-injection static reservoir pressure of 25.24 MPa. A total of 10,219 tonnes of CO2were injected into the Rose Run at a depth of 2362-2392 m (McNeil et al., 2014; Mishra et al., 2014), at an estimated average rate of 48.2 t/d (17.6 kt/yr).By the conclusion of the injection test,the reservoir pressure in the Rose Run had increased by only 0.02 MPa(McNeil et al., 2014).
A deep stratigraphic borehole was drilled by the Ohio Department of Natural Resources, Division of Geological Survey (OGS) in 2007 at a site near Port Washington, Tuscarawas County, Ohio,250 km northeast of the KGS 1 Hanson Aggregates well(Fig.1).Its purpose was to determine the suitability for CO2sequestration in deep saline reservoirs near a proposed FutureGen power plant location(Wickstrom et al.,2011).The OGS 1 CO2well was drilled to a TD of 2650 m KB, penetrating the entire sedimentary section above Precambrian metamorphic basement rocks (Wickstrom et al., 2011). This well found 7.3 m of net sandstone in the Rose Run in a 40.8 m interval at depths of 2248-2288 m (Wickstrom et al., 2011). Average porosity in the Rose Run measured in selected core plugs was 7.8%and average permeability was 6.4 mD.Re-interpretation of the porosity log (Fig. 30 in Wickstrom et al.,2011) from the OGS 1 CO2well during this study found a total of 5.5 m of net sandstone in the Rose Run>7%porosity(Medina et al.,2011) in four thin sand layers in the interval, 1.8 m less than reported by Wickstrom et al. (2011).
2. Methodology
The robust dataset collected from the KGS 1 Hanson Aggregates well used to evaluate the Rose Run and other reservoir strata was discussed in detail by Bowersox et al.(2018,2019a,b).The Rose Run was a primary zone of interest in the KGS 1 Hanson Aggregates for testing reservoir properties and estimating its CO2storage capacity.This study reviewed the reservoir and geomechanical properties of the Rose Run interpreted from geophysical electric and nuclear log(s); geophysical formation image log analyses of conventional whole-diameter cores(Fig.2)and rotary sidewall cores;and in situ reservoir properties determined from step-rate testing.An 8.9 cmdiameter core was cut and recovered from the Rose Run in the KGS 1 Hanson Aggregates well from 1005.8 to 1010 m,and continued to a depth of 1024 m in the underlying Copper Ridge (Fig. 2). Above 1006 m drill depth,sampling the Rose Run was supplemented with 12 rotary sidewall cores. Analyses performed on core plugs and sidewall cores included routine porosity and permeability for nine core plugs and one sidewall core, thin section petrography, and Xray diffraction (XRD) mineralogy and CO2-brine relative permeability of one core plug each. Mercury injection capillary pressure(MICP) test data of one core plug from 1009.3 m was provided by the Indiana Geological Survey, University of Indiana, Bloomington,Indiana.Geomechanical properties measured in one core plug from 1009.8 m was provided by Battelle Memorial Institute, Columbus,Ohio,USA.
All software packages used during this study are commercial releases. Figures, including annotations and colored fills (e.g.Figs. 1-3), were constructed using CorelDraw X7, Version 17.6.0.1021.All figures including logs(e.g.Fig.2),contour maps(e.g.Fig. 3), and cross sections (e.g. Fig. 4) were initially constructed using PETRA, Version 3.8.3, with corrections, annotations and labels, and graphic fills added in CorelDraw X7. Formation porosity calculated from the density log, geomechanical properties, and wellbore pressure profiles were calculated using Quattro Pro X9,Version 19.0.0.325. Graphs presented in this study were constructed using Delta Graph 7, Version 7.5.0, with annotations and fills added using CorelDraw X7.
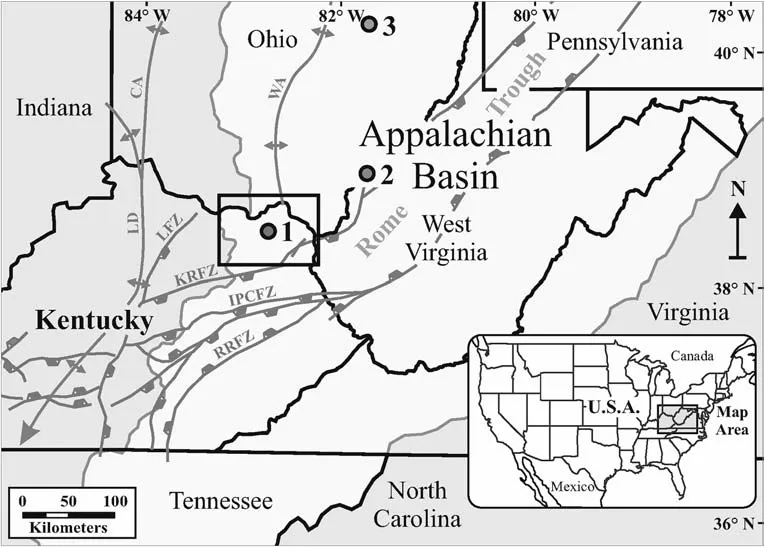
Fig.1. Location of the KGS 1 Hanson Aggregates well,northern Carter County,Kentucky(1);Battelle 1 AEP well,Mason County,West Virginia(2);and Ohio Geological Survey 1 CO2 well, Tuscarawas County, Ohio (3). The study area around the KGS 1 Hanson Aggregates well is shown by the box surrounding the well site. The location for the KGS 1 Hanson Aggregates was chosen northwest of the Kentucky River Fault Zone(KRFZ)and Rome Trough where the entire Ordovician to Precambrian basement section could be penetrated at a drill depth less than 1524 m. The abbreviations in the figure are as follows: Lexington fault zone (LFZ), Irvine-Paint creek fault zone (IPCFZ), Rockcastle river fault zone (RRFZ),Cincinnati arch (CA), Lexington dome (LD), and Waverly arch (WA). Modified with permission from Bowersox et al. (2018).
3. Geology
The KGS 1 Hanson Aggregates well was drilled near the western margin of the central Appalachian Basin, 35 km northwest of the Kentucky river fault zone (KRFZ) and Rome Trough, a Vendian, or Ediacaran (Eocambrian of Hinze and Chandler, 2020, rift basin underlying the Appalachian Basin, extending from eastern Kentucky to central Pennsylvania (Fig. 1) (Hickman et al., 2015). The well location lies on the east flank of the Waverly Arch (Fig. 1)(Woodward,1961; Ettensohn,1980), a low-relief forebulge associated with the Taconic orogeny and extending from Lake Erie in north-central Ohio to Tennessee (Root and Onasch, 1999). In the mapped study area (Fig.1), the Copper Ridge, immediately underlying the Rose Run(Fig. 2), is near-horizontal, dipping from ~0.8°southeast at the KGS 1 Hanson Aggregates well and steepens to about ~1.8°southeast approaching the KRFZ (Fig. 3).
Freeman (1953) named the Cambrian-Ordovician Rose Run sandstone for a well drilled in the Silurian Rose Run(now Brassfield limestone) iron ore (hematite) area in Bath County, Kentucky, on the western edge of the study area.It extends throughout much of the northern and central Appalachian Basin, occurring near the Cambrian-Ordovician boundary.Eastward it is correlative with the upper sandy member of the Gatesburg formation (e.g. Laughrey and Harper, 2012). Northward it pinches out beneath the lower Ordovician unconformity along the Waverly Arch in southern and eastern Ohio (e.g. Riley et al., 2002). Westward it was historically considered equivalent to the Gunter sandstone of the Illinois Basin,but more recent correlations (Harris et al., 2014) suggest the Rose Run may be equivalent to the slightly younger New Richmond sandstone.In eastern Kentucky,and much of the Appalachians,the Cambrian Ordovician boundary had traditionally been placed(sometimes with question marks to show uncertainty) at the base of the Rose Run (Cable and Beardsley, 1984; Patchen et al., 1984;Greb et al.,2012),although more recently it was moved to the top of the sandstone(Figs.2 and 4)(Greb,2017)similar to the placement of the boundary in Ohio (e.g. Janssens, 1973; Babcock and Baranoski, 2013) and West Virginia (e.g. Ryder et al., 2005), and in Ryder’s regional cross sections of Cambrian and Ordovician strata(Ryder et al.,1992,1997,2008,2009).The Rose Run,however,does not contain any biostratigraphically significant fossils, thus the actual Cambrian-Ordovician boundary may vary from above the sandstone in the Beekmantown,closer to the top of the Gatesburg formation of Pennsylvania (Brezinsky et al., 2012; Morgan, 2012;Ryder et al.,2012),to somewhere below the Rose Run in the upper part of the Copper Ridge and its equivalents (Freeman, 1953;Repetski,1985; Read and Repetski, 2012).
In the whole and sidewall cores from the KGS 1 Hanson Aggregates well,the Rose Run is a buff to gray-green,fine-to mediumgrained, quartzose to subarkosic, moderate-to well-sorted sandstone (Fig. 5) with subrounded to rounded grains, and dolomitic cement. Primary illite, feldspars, and detrital carbonate occur in varying amounts. Secondary minerals include authigenic feldspar,dolomite, and quartz overgrowths (McGuire and Howell, 1963;Heald and Baker, 1977; Riley et al., 2002). In much of eastern Kentucky,the Rose Run is interbedded with dolomite,and appears to grade westward and southward into Knox dolomites. The top and base of the unit can be difficult to determine in subsurface logs,and tops are generally based on the presence of density porosity(Figs. 2, 4 and 5). The Rose Run has significant porosity and permeability in central Ohio along the Waverly Arch(Fig.1),where it is truncated beneath the lower Ordovician unconformity (Riley 1992; Riley et al.,1993, 2002), and may consist of as many as four distinct sandstones separated by dolomites (Riley et al., 2002;Gupta, 2008a; Wickstrom et al., 2010). Intergranular, intraconstituent (from dissolution of feldspar grains), and oversize pores are the primary porosity types(Riley et al.,2002).Dolomite is the primary cement, but silica and feldspar overgrowths also are present(Heald and Baker,1977;Riley et al.,2002;Wickstrom et al.,2010).
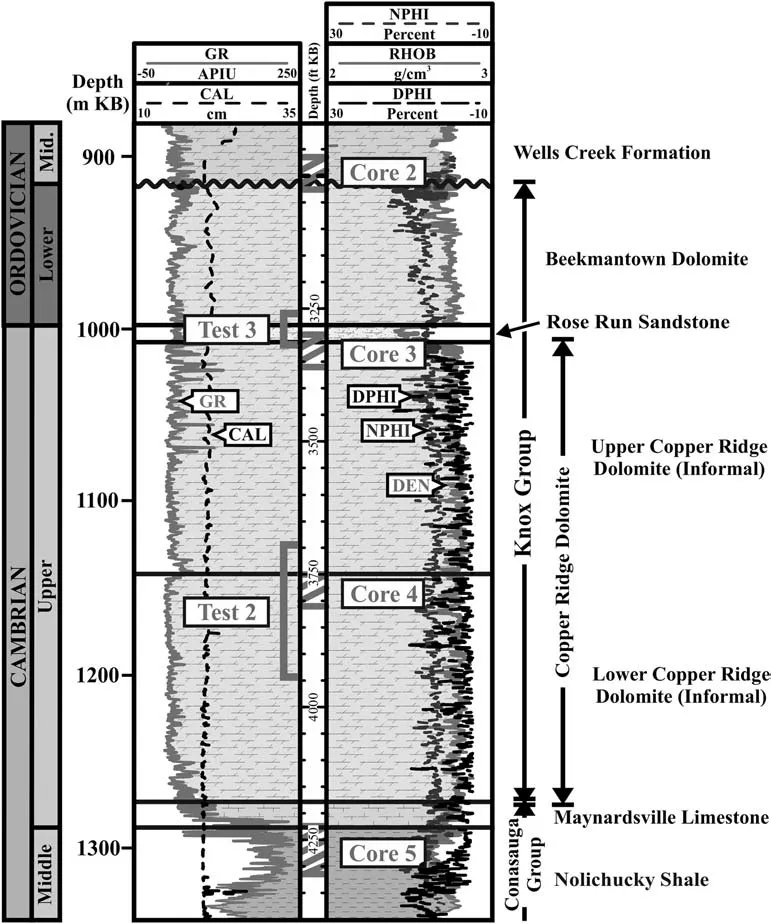
Fig.2. Correlated geophysical nuclear logs and generalized stratigraphy from the lower Ordovician wells creek formation,overlying the Knox group,to uppermost middle Cambrian Nolichucky shale in the KGS 1 Hanson Aggregates well.Log curves shown in the left log track are the gamma-ray(solid line,GR)and wellbore caliper(short dashed line,CAL).In the right track,the formation density(solid line,DEN),neutron porosity(short dashed line,NPHI),and density porosity(long dashed line,DPHI)are shown.Cored intervals are shown by diagonal lines in the depth track and test intervals are posted to the left of the depth track. Modified with permission from Bowersox et al. (2019a).
In the study area south of the Ohio River and west of the KRFZ(Fig.3),the Rose Run thins from about 14 m on the north along the Ohio River in Greenup County, Kentucky, to less than 9 m in the southern part of the study area in southern Carter County(Fig.4).A 9.8 m-thick section of the Rose Run was penetrated in the KGS 1 Hanson Aggregates well at a drilled depth of 1000 m KB and was cored at depths from 1005.8 m to its base at 1010 m (Fig. 2). The cored section was comprised of thin-bedded dolomitic quartz arenite with thin clay beds near its base (Fig. 5). XRD analysis and reviewing a thin section of a core plug from the KGS 1 Hanson Aggregates well at a depth of 1008.1 m showed the Rose Run to be composed of 71.1%quartz,20.9%pore-filling dolomite cement,2.1%illite/smectite clays and mica, 5.4% authigenic potassium feldspar,and other trace minerals.
4. Reservoir porosity
Total reservoir porosity in the Rose Run(φ or φT,in percent)was calculated from the formation density log(65 measurements)using the well-known methodology of Alger and Raymer (1963) and Schlumberger (1972), then averaged for the entire section in the KGS 1 Hanson Aggregates well. Porosity and dolomite volume of the Rose Run in the KGS 1 Hanson Aggregates well (1.8%-22.9%dolomite, average 11.2%) was determined from a crossplot of bulk density and photoelectric factor measured by the density log(Schlumberger,1991) normalized to the XRD analysis. The interval below 1006 m in the Rose Run was more dolomitic, having an average dolomite content of 15.3%, whereas the interval above 1006 m had an average dolomite content of 6.8%.Average Rose Run matrix density calculated in the KGS 1 Hanson Aggregates was 2.67 g/cm3(ranging from 2.65 g/cm3to 2.69 g/cm3). Brine density of water recovered during testing in the Rose Run (89,773 mg/L total dissolved solids)was determined to be 1.06 g/cm3from a chart crossplot (see Charts 1-6 in Atlas Wireline Services,1985) and by regression of a crossplot of total dissolved solids and water density from Rose Run in wells in Kentucky (KGS unpublished data) and Ohio (Breen et al.,1985).
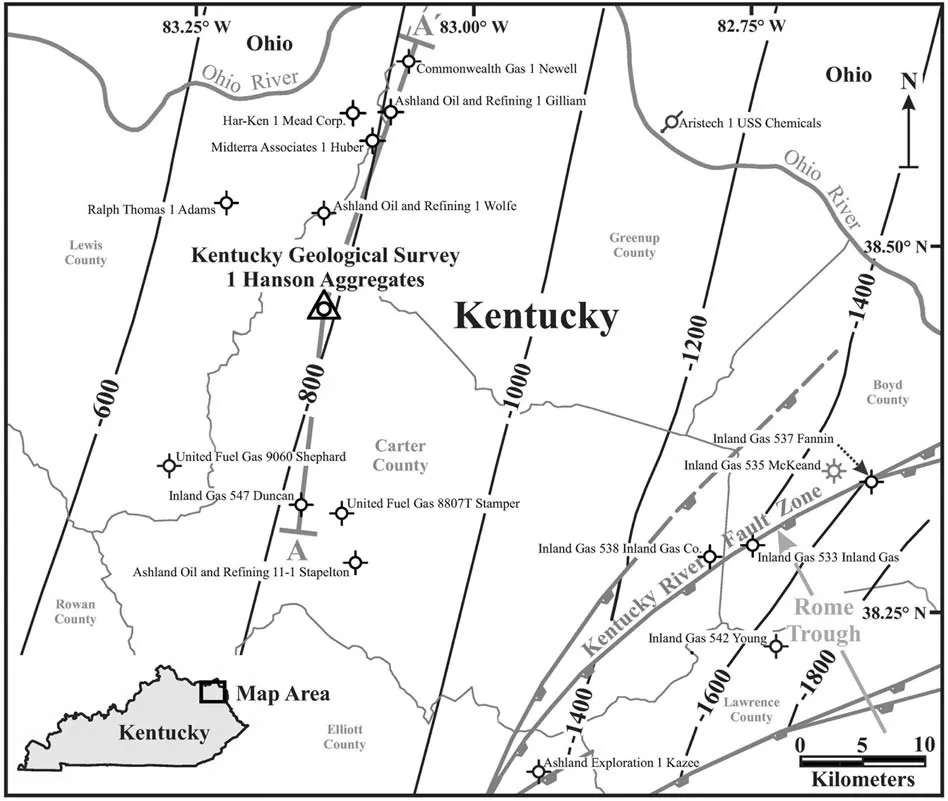
Fig.3. Subsurface structural contours on top of the Copper Ridge dolomite,base of the Rose Run sandstone,show gentle dip to the east in the region northwest of the KRFZ,then steepening into the Rome Trough. Line of the Knox group stratigraphic cross section A-A′ is shown in Fig. 4.
Porosity and permeability were measured in selected core plugs from the Rose Run in six wells in Kentucky,Ohio,and West Virginia.Rose Run porosity in the six wells ranged from 0.45% to 23.8%(Fig. 6) and permeability ranged from 0.001 mD to 3144 mD.Porosity and permeability are generally highest in the KGS 1 Hanson Aggregates well where average porosity is 14.9% and average permeability is 791 mD. After excluding data from dolomitic and fractured core plugs, median porosity measured in the Rose Run core plugs from the KGS 1 Hanson Aggregates well was 13.4% and median permeability was 57.6 mD. The general trend in the Rose Run is for porosity and permeability to decrease with increasing burial depth (Battelle Memorial Institute, 2015). The pattern of porosity and permeability values in Fig. 6 are consistent with porosity reduction by compaction and diagenesis by authigenic minerals deposition in the pore space and quartz overgrowths on grains as reservoir depth increases (Heald and Baker, 1977). Rose Run porosity was calculated from the formation density log (Alger and Raymer,1963;Schlumberger,1991)for the entire stratigraphic section (Figs.2 and 5).Matrix density in the Rose Run section was most affected by the dolomite content,where the dolomite volume calculated in the Rose Run is less than 1% in the interval of 1003-1004 m and averages 10.1% through the entire section. Porosity calculated in the Rose Run in the mapped study area (Fig. 3) averages 11.2%.
5. Geomechanical properties
The potential for fracturing and faulting of reservoir rock and confining strata is a risk in any CO2storage project.This risk can be mitigated by assessing geomechanical rock properties prior to injection (Nygaard, 2010). The KGS 1 Hanson Aggregates well’s testing programs included laboratory measurements of core plugs’geomechanical properties as well as a step-rate test to measure in situ reservoir and rock properties of the Rose Run. These were designed to assess the suitability of the Rose Run as a CO2storage reservoir, including the potential for fracturing during CO2injection,and confinement by the overlying Beekmantown during longterm post-injection CO2storage. Both static rock strength and elastic geomechanical properties, particularly Poisson’s ratio and Young’s modulus, may be measured in the laboratory, however,Chang et al. (2006), Nygaard (2010) and Butel et al. (2014)cautioned that all studies should also conduct laboratory triaxial compression tests to calibrate and confirm the accuracy of geomechanical properties for advanced reservoir modeling of a CO2storage site(Eyinla and Oladunjoye, 2014).
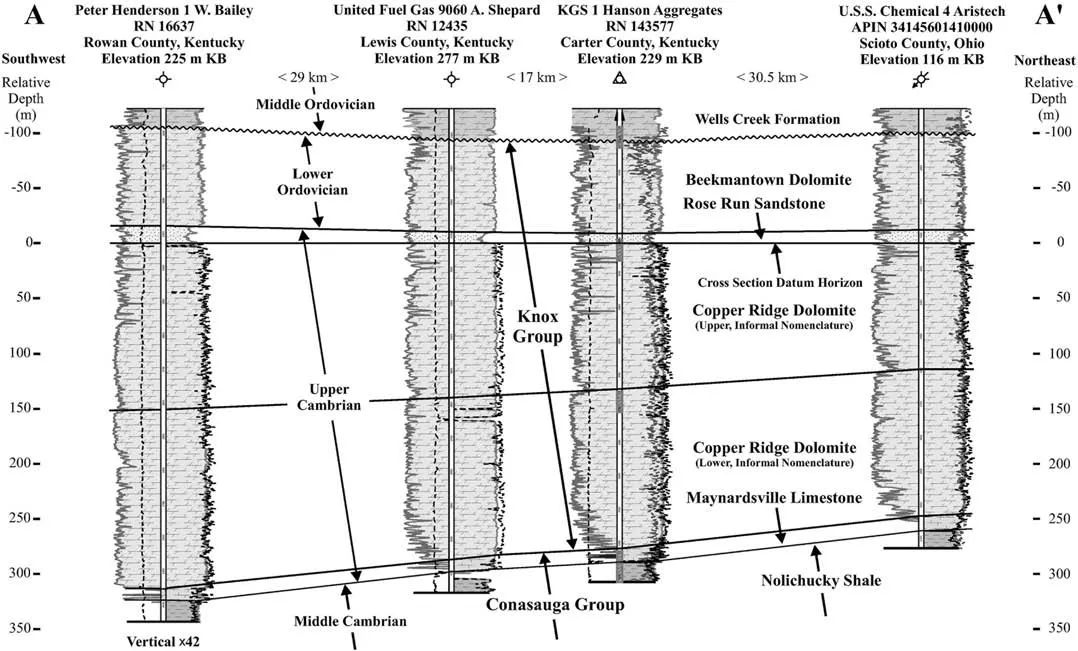
Fig.4. Stratigraphic cross section of the Knox group in northeast Kentucky oriented from southwest to northeast at the top of the upper Copper Ridge dolomite(base of the Rose Run sandstone)datum horizon.Geophysical nuclear log curves and cored intervals in the KGS 1 Hanson Aggregates well depth track are as identified in Fig.2.Although the lower Copper Ridge consistently thickens to the southwest, the Rose Run and Beekmantown thin from the northeast to the KGS 1 Hanson Aggregates well then thicken again to the southwest.
This study, much like those of previous geomechanical evaluations of the Rose Run in the Appalachian Basin (Lucier et al., 2006;Lucier and Zoback, 2008; Goodzari et al., 2010; Raziperchikolaee et al., 2015), that evaluated elastic geomechanical properties of the Rose Run, underlying Copper Ridge and overlying Beekmantown strata, including Poisson’s ratio, Young’s modulus, and the magnitude of the three principal stress axes(vertical stress,Sv);maximum compressive horizontal stress, SHmax; and minimum horizontal stress, Shmin), discussed below, may then be calculated from the formation bulk density,Poisson’s ratio,and Young’s modulus.
5.1. Vertical lithostatic stress
As the low structural dip (<1°) in the study region, vertical stress (Sv), lithostatic pressure as used in this study (Fig. 7), was assumed to be vertical and that Svcould be accurately calculated from the weight of the rock overlying Precambrian basement(Bowersox et al.,2019b).Sv(Fig.7)in the KGS 1 Hanson Aggregates well was calculated by integrating the density log (Lucier et al.,2006)from the surface to the well’s total logged depth of 1467.6 m:

where ρavgis the average formation density throughout the depth interval(Δz),measured by the density log;and g is the gravitational acceleration (~9.81 m/s2). A linear regression fit to the lithostatic pressure curve (coefficient of determination R2= 0.99) yielded a lithostatic gradient of 26 MPa/km (Bowersox et al., 2019b; Fig. 7).This is a slightly lower gradient than that determined by Lucier et al. (2006) of 26.2 MPa/km in the Battelle 1 AEP well. Lucier et al. (2006), however, lacked density log data for a 641 m interval from 550 m to 1191 m drilled depth in the well and relied on a linear interpolation of the missing data to calculate Sv, possibly affecting their calculated Svvalue.
5.2. Natural fractures and principal stresses
Natural fractures can enhance reservoir porosity and permeability by increasing porosity and connecting isolated matrix porosity (Warren and Root,1963; Stearns and Friedman,1972).
Natural and drilling-induced fractures encountered in the KGS 1 Hanson Aggregates well(Fig.8)were interpreted by Schlumberger from the formation imaging logs.In the interval of 975.4-1036.3 m,from 25 m above the top of the Rose Run to 26.5 m below the base of the Rose Run, both drilling-induced (six fractures) and mineralized fractures(three fractures)were sparse.However,No drillinginduced tensile fractures were observed in the Rose Run. No open fractures were interpreted from the imaging logs in this interval,nor could they be definitively observed in the cored interval.Drilling-induced fractures follow the contemporary NE-SW stress field (SHmax) (Lucier et al., 2006; Engelder, 2008; Engelder et al.,2009) trending N53°E (Bowersox et al., 2019b), thus Shmin,orthogonal to SHmax,trends N37°W(Fig.8).Mineralized fractures,a conjugate set along the northwest principal stress axis of the Mississippian Alleghenian continental convergence front(Engelder and Geiser, 1980; Engelder, 1987; Craddock and van der Plujim,1989; van der Plujim and Craddock,1996; Engelder, 2004, 2008),trend N44°E (Fig. 8).
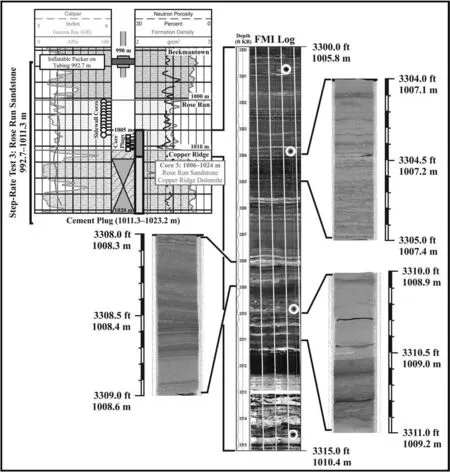
Fig.5. Montage of correlated logs showing abbreviated sections of the Beekmantown,Rose Run,and Copper Ridge(upper left),formation imaging log(FMI log)of the cored interval(center,noted by a bar on the log),and photos sections of whole cores.Log curves are as identified in Fig.2.Rotary sidewall core depths are posted on the log as filled white circles with connecting lines.Analyzed core plugs are posted as filled white squares on the right side of the log depth track.White circles on the FMI log outline holes left by rotary sidewall coring prior to the imaging log run. Inspection of the slabbed cores shows the Rose Run to be a dolomitic quartz arenite with laminae of organic material.
Lucier et al. (2006) used a range of Shminfor the Rose Run derived from minifrac testing at an average depth of 2365 m in the Battelle 1 AEP well of 34-36 MPa, and a range for SHmaxof 42-63 MPa, yielding a horizontal stress ratio, SHmax/Shmin(e.g. Guerra,2019) of ~1.2-1.8. Shminin the KGS 1 Hanson Aggregates well calculated from ν (0.23), Sv(26 MPa), and pore pressure Pp(9.2 MPa), using the methodology of Eaton (1969), was 14.2 MPa.Instantaneous shut-in pressure(ISIP)in the wellbore,the pressure reached after injection stops and fractures close at the conclusion of the step-rate test (discussed below), can also be indicative of the magnitude of Shminwhen fresh water, a definitive low-viscosity fluid, was injected at the low pumping rates (Lucier et al., 2006)comparable to those used in KGS 1 Hanson Aggregates well.ISIP in the KGS 1 Hanson Aggregates was 12.8 MPa, and thus a range of Shminof 12.8-14.2 MPa was developed from the two analytical methods. Assuming SHmax/Shminin the range of 1.1-1.3 (Guerra,2019) for the shallower, lower pressure region around the KGS 1 Hanson Aggregates well,expected SHmaxwas 15.6-18.5 MPa where Shminwas calculated from the methodology of Eaton (1969) and 14.1-16.6 MPa where Shminwas from ISIP,yielding a probable range for SHmaxof 14.1-18.5 MPa. Therefore, the Rose Run in the region around the KGS 1 Hanson Aggregates well,and likewise around the Battelle 1 AEP well, is in a normal-faulting to strike-slip stress regime, where Svis the greatest principal stress, such that Sv≫SHmax≥Shmin(Lucier et al., 2006).
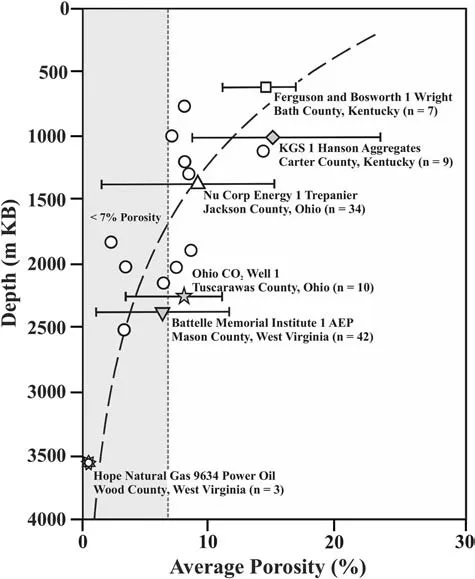
Fig. 6. Comparison of porosity core-plug samples from the Rose Run from wells in Kentucky, Ohio, and West Virginia. Porosity reduction in the Rose Run is from compaction and diagenesis with increasing depth. Symbols on bars show the average porosity of all core plugs from the associated well and the range of porosity measurements in core plugs. The dashed vertical line is the 7% porosity cutoff for calculating CO2 storage volume in deep saline reservoirs (Medina et al., 2011). Where the compaction curve falls below the 7% porosity cutoff, at about 1700 m below the surface, the likelihood of finding sufficiently thick saline reservoirs in the Rose Run dramatically decreases. Average porosity data for the open circles are from Mason(1996), Sminchak (2019) and Solis (2019), Data sources: Ferguson and Bosworth 1 Wright well, KGS Oil and Gas Database, Record Number 2210 (Kentucky Geological Survey, 2021); KGS 1 Hanson Aggregates well, KGS Oil and Gas Database (Kentucky Geological Survey, 2021), Record Number 143577; Nucorp Energy 1 Trepanier well(McNealy, 1991); Ohio 1 CO2 well (Wickstrom et al., 2011); Battelle 1 AEP well(Sminchak, 2019); and Hope Natural Gas 9634 Power Oil well (Woodward,1959).
5.3. Elastic geomechanical moduli calculated from geophysical logs
Acoustic velocities and sample bulk density were measured in two core plugs from the Rose Run and two rotary sidewall cores from the overlying Beekmantown to calibrate geomechanical dynamic elastic rock properties calculated from density and acoustic logs (Schlumberger, 1991, Fig. 9). Methodologies for calculating Poisson’s ratio and Young’s modulus from acoustic log compression and shear wave velocities and formation bulk density (Fig. 9), as well as fracture orientations(Fig.8),reservoir pressure profiles and vertical lithostatic stress (Fig. 7), were adapted from Zoback et al.(2003), Lucier et al. (2006), Zoback (2007), Lucier and Zoback(2008), and Guerra (2019). Poisson’s ratio and Young’s modulus were calculated from acoustic log compressional and shear velocities (Vpand Vs, respectively) and formation density log data(Schlumberger, 1991). Poisson’s ratio (ν) is calculated from the relationship between Vpand Vs:

As observed by Lucier et al.(2006),there is a significant contrast of lower Vpversus Vsand ρbin the Rose Run compared to the underlying Copper Ridge and overlying Beekmantown dolomites(Fig. 9), and thus lower values of ν and E suggesting greater brittleness. However, brittleness is not a perfect indicator of fractureprone intervals, and thus requires verification by measuring axial stress in core plugs (Chopra and Sharma, 2017, Fig.10).
Average ν and E in the Rose Run,calculated from the acoustic log compression and shear wave velocities and formation bulk density logs from the KGS 1 Hanson Aggregates well, are 0.23 and 45 GPa,respectively (Bowersox et al., 2019b), compared to 0.28 and 77.1 GPa in the overlying Beekmantown (Bowersox et al., 2019b)and 0.28 and 75 GPa in the underlying Copper Ridge (this study),respectively.
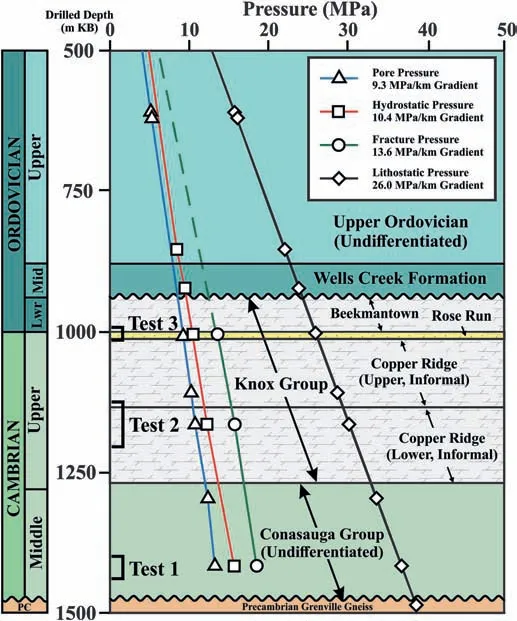
Fig. 7. Subsurface pressure profiles in the KGS 1 Hanson Aggregates well and surrounding area with step-rate test intervals shown. Static reservoir pore pressure (triangles) and fracture pressure (circles) were measured during step-rate tests in the 1 Hanson Aggregates well and from shallower wells in the region. Hydrostatic pressure(squares) was calculated from the density of formation brines sampled in the KGS 1 Hanson Aggregates well and other wells in the surrounding region.Lithostatic pressure(diamonds) was calculated by integration of the density log data (Lucier et al., 2006)from the KGS 1 Hanson Aggregates well from the surface to the well TD.Static reservoir pore pressure measured in the Rose Run in the KGS 1 Hanson Aggregates is 9.3 MPa at 1000 m well depth, 1.2 MPa underpressured compared to its expected hydrostatic pressure of 10.5 MPa at that depth. Had the Rose Run been normally pressured, the expected depth to reach 9.3 MPa in the KGS 1 Hanson Aggregates well would have been 885 m,115 m shallower than its reservoir depth of 1000 m.
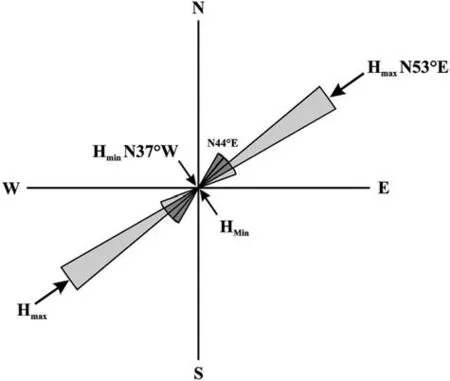
Fig.8. Plot of orientations and stress axes of six drilling-induced fractures(filled bars)and three mineralized(healed) natural fractures (open bars)interpreted from the FMI and ultrasonic borehole imaging (UBI) logs in the interval of 975-1036 m, bracketing the Rose Run in the KGS 1 Hanson Aggregates well. No open natural fractures were interpreted in the interval.Length of the bars is proportional to the number of fractures in each category. The sparse drilling-induced fractures in this interval (gray bars) are parallel to the modern northeast tectonic stress axis (Engelder, 2008; Engelder et al.,2009), whereas mineralized fractures (open bars) are parallel to the principal stress axis of the Mississippian Alleghenian continental convergence front in Appalachian Basin (Engelder and Geiser, 1980; Engelder, 1987, 2004, 2008; Zoback and Zoback,1989; van der Plujim and Craddock,1996).
5.4. Static and elastic geomechanical properties measured in core plugs
Geomechanical properties of core plugs and rotary sidewall cores from the Rose Run and Beekmantown were analyzed to calibrate log-calculated rock dynamic elastic properties calculated from acoustic compression and shear wave velocities and formation bulk density(Fig.10).Chang et al.(2006),Nygaard(2010)and Butel et al.(2014)all cautioned that laboratory triaxial compression tests should be conducted to calibrate and confirm the accuracy of geomechanical properties calculated from acoustic logs at a specific CO2storage site for advanced reservoir modeling (Eyinla and Oladunjoye, 2014). Triaxial static compression and acoustic velocity analyses were performed on two core plugs from the Beekmantown,the overlying confining interval for the Rose Run(Figs.2,4 and 5), and two from the Rose Run. Tests on the Rose Run core plugs, from 1.6 m apart in the wellbore, were performed by two different laboratories at different confining stresses.The upper core plug, from 1008.1 m drilled depth, was tested at 5 MPa confining pressure and yielded a compressive strength of 147.7 MPa. The lower core plug from 1009.7 m drilled depth was tested at confining pressure of 9.3 MPa and yielded a compressive strength of 166.2 MPa,whereas the core plug from 1009.7 m was from 0.3 m above the top of the Copper Ridge, at 1010 m. Part of its higher compressive strength may be from dolomite cement immediately above the contact with the Copper Ridge (Fig. 9). Another consideration is that the greater confining pressure would have supported a greater Compression in the core plug before failure. Therefore,pre-injection step-rate or minifrac testing and cautious monitoring of injection pressure are suggested in a Rose Run CO2storage interval.Compression tests of the two Beekmantown core plugs were performed by the same laboratory at 5 MPa confining pressure.The stratigraphically shallower core plug from 996.1 m drilled depth yielded a compressive strength of 304.4 MPa, and the lower core plug from 114.1 m drilled depth yielded a compressive strength of 295.9 MPa(Fig.10).The substantially greater compressive strength of the Beekmantown core plugs compared to those from the Rose Run suggests that it will be an effective confining interval(caprock)for any injection into the Rose Run.
In general, calculated elastic parameters appear to be a good match to values measured in core plugs (Fig. 9). Lower values of ν and E in the Rose Run, less than those in the Beekmantown and Copper Ridge(Fig. 9), are indicative of mechanically weaker strata that will fail at much lower injection pressure (Bowersox et al.,2019b). Thus, the Beekmantown and Copper Ridge are strong enough to confine injected CO2to the Rose Run without fracturing.Results of geomechanical tests and analyses of the Rose Run and Beekmantown in the KGS 1 Hanson Aggregates well proved comparable to those from the Battelle 1 AEP well(e.g.Lucier et al.,2006;Lucier and Zoback, 2008).
6. Step-rate testing the Rose Run
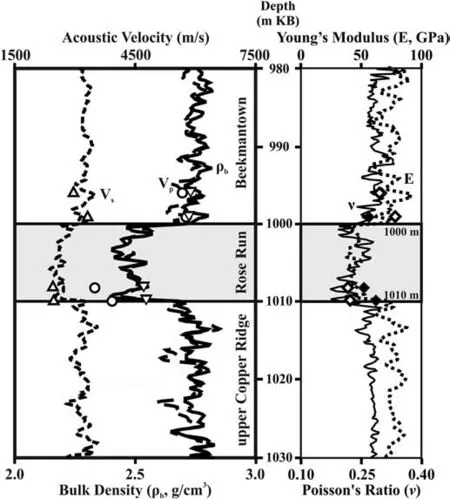
Fig.9. Elastic geomechanical properties in the KGS 1 Hanson Aggregates measured in core plugs and calculated from log data (Schlumberger, 1991). Geophysical log data curves are shown left of the depth track where acoustic shear wave velocity (Vs) log curve is shown by a short dashed line with values measured in core plugs (open triangles). The acoustic compressional wave velocity (Vp) log curve is shown by a longdashed line with values measured in core plugs (inverted open triangles). The formation density (ρb) log curve is shown by the solid line with values measured in core plugs (open circles). Acoustic and density values measured by the logs are generally a good match to values measured in core plugs. To the right of the depth track, elastic geomechanical properties calculated from acoustic and density log data of Young’s modulus(E)is shown by the dotted line and Poisson’s ratio(ν)shown by the solid line.Values calculated from logs are a good match to Young’s modulus (open diamonds)and Poisson’s ratio (filled diamonds) measured in core plugs.
The KGS 1 Hanson Aggregates testing program was designed to assess the suitability of the Rose Run for CO2storage and reservoir confinement by the overlying Beekmantown.Step-rate testing was performed in lieu of CO2injection to determine the maximum pressure that fluid could be injected into the Rose Run before fracturing. The United States Environmental Protection Agency Region 5 (1994) considered this critical data because, if the reservoir formation in an injection well is fractured,the associated confining caprock interval may be compromised. Testing supercritical CO2injection in the KGS 1 Hanson Aggregates well was precluded by the limited project budget. As an alternative, in situ reservoir rock strength was evaluated by step-rate testing to determine the fracture gradient in the well(Fig.11),a critical issue for determining safe injection pressures and integrity of the storage reservoir as in situ rock strengths and stresses vary widely in the subsurface,thus a uniform fracture gradient cannot be applied to all injection wells. The protocol used for the step-rate testing in the KGS 1 Hanson Aggregates well was adapted from the United States Environmental Protection Agency Region 8 (1999) protocol.
The step-rate test interval was isolated by a cement plug in the uppermost Copper Ridge from 1011.3 m to 1023.2 m to prevent fluid loss to the open wellbore below the Rose Run test interval,and at the top by an inflatable packer deployed on tubing set at 992.7 m to seal the open wellbore above the test interval (Fig. 5). The test interval was swabbed through the tubing to collect a formation water sample prior to testing and 53 barrels of water(BW)measuring 89,773 mg/L total dissolved solids were recovered from the Rose Run. Pressure logging instruments,consisting of a surface readout gauge(SRO)and a memory readout gauge(MRO)were lowered into the wellbore and positioned with the SRO set at 1002.7 m and MRO set at 1003.4 m.After the static bottomhole pressure measurement was obtained,the step-rate test commenced using fresh drinking water purchased from the Grayson, Kentucky, municipal water system. Stable pumping rates were maintained for 7-min steps continuing until a drop in the pressure-buildup rate indicated that the test interval had fractured. Pumping continued for additional steps to the final injection rate of 8 barrels per minute(Fig.11).
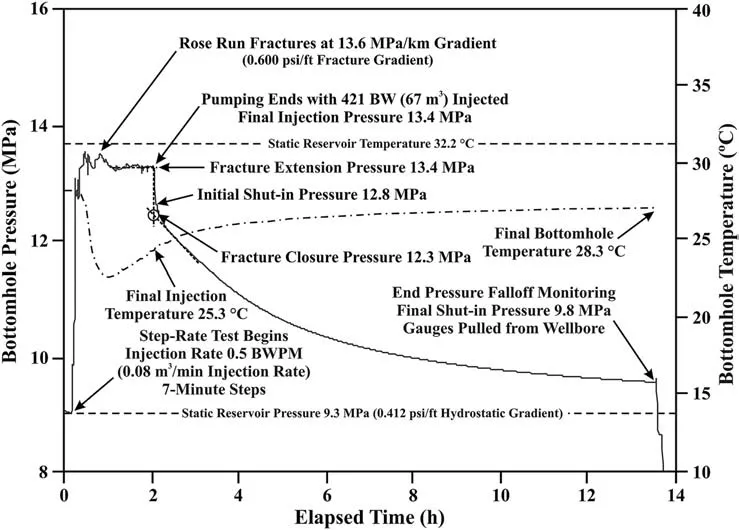
Fig.11. Annotated plot of pressure from the KGS 1 Hanson Aggregates well step-rate test of the Rose Run in the interval 992.7-1011.3 m.Testing procedure was modified from that of United States Environmental Protection Agency Region 8(1999).Injection rate proceeded in 0.5 barrels of water(0.08 m3)per minute(BWPM)steps every 7 min.The test interval fractured at an injection pressure of 13.6 MPa,a fracture gradient of 13.5 MPa/km at reservoir depth,after 59 BW (9.4 m3) had been injected.Secondary fracture growth occurred after pressure had built to 13.5 MPa after pumping 138 BW(21.9 m3).Pressure subsequently stabilized at about 13.4 MPa for the remainder of the test.The test concluded and the wellbore shut in as mechanical problems with the injection pump after 421 BW (66.9 m3) had been injected. Pressure falloff was monitored for 11.4 h, at which time pressures gauges were removed from the well and the wellbore permanently abandoned with cement plugs. Modified from Bowersox et al. (2018).
Initial reservoir conditions in the Rose Run were 33.2°C static reservoir temperature, 9.3 MPa static reservoir pore pressure, and 9.3 MPa/km hydrostatic gradient in the test interval (Fig. 11),1.2 MPa less than the expected hydrostatic gradient of 10.5 MPa/km for a reservoir at 1000 m drilled depth with ~90,000 mg/L salinity pore water (e.g. Beaumont and Fiedler, 2000; Levandowski et al.,2018). Underpressured reservoirs, however, are common in Kentucky as rapid pre-upper Cretaceous uplift and subsequent erosion to the present day(Takacs et al.,2010).The Rose Run fractured at a pressure of 13.6 MPa, yielding a fracture gradient of 13.6 MPa/km and fracture extension pressure of 13.4 MPa (Fig. 11). Shminestimated from initial shut-in pressure in the KGS 1 Hanson Aggregates well was 12.8 MPa (Fig.11). Overall, the step-rate testing pressure profile for the KGS 1 Hanson Aggregates well resembles that of the Battelle 1 AEP well,although the magnitudes of the pressures in the Battelle 1 AEP well were more than twice those in the KGS 1 Hanson Aggregates well(Lucier et al.,2006; Fig.7).Injected water decreased the bottomhole temperature from the static reservoir temperature at the start of injection to a low magnitude of 24.1°C,increasing final injection temperature to 25.3°C because of friction during pumping, then reaching 28.3°C at the end of the shut-in period (Fig.11).
7. Discussion
As a known saline reservoir in parts of Ohio and Kentucky, the Rose Run has been a regional target for potential carbon sequestration (Zerai et al., 2006; Greb and Solis, 2009; Greb et al., 2009,2012; Venteris et al., 2009). Wickstrom et al. (2010) estimated volumetric CO2storage potential of 11 Gt in deep saline reservoirs in eastern Kentucky, of which the Rose Run, assuming 10 m of net sand with 8% average porosity, was estimated to have potential capacity of 5.4 Gt(Table 18 in Wickstrom et al.,2010).Throughout the area evaluated for CO2sequestration by MRCSP (Wickstrom et al., 2010), fracture porosity was the least common type of porosity observed in the Rose Run cores, consistent with observations of this study. Although its fracture gradient is relatively low(Figs. 7 and 11), after fracturing there was not an appreciable increase in injection pressure suggesting that the Rose Run may require hydraulic fracturing to improve injectivity and reservoir storage capacity if permitted by the U.S. Environmental Protection Agency.The overlying Beekmantown has sufficient geomechanical strength (Figs. 9 and 10), nearly double that of the Rose Run(Fig.10),to ensure confinement of stored CO2should the Rose Run fracture under injection. With careful monitoring of injection pressure(Gupta,2008a), the Rose Run could safely contribute to a stacked storage reservoir (Hovorka, 2013; Raziperchikolaee et al.,2019).
Induced seismicity(Llenos and Michael,2013)has proven to be a risk in oilfield waste water disposal projects in Arkansas(Ausbrooks et al., 2012; Horton, 2012; Llenos and Michael, 2013),Texas(Frohlich et al.,2014),Oklahoma(Llenos and Michael,2013),and Kansas(Buchanan,2015).However,induced seismicity has not been an issue in eastern Kentucky,despite the number of saltwater disposal and hazardous waste disposal wells that have been drilled into the Knox,and including the Rose Run in the disposal interval,in eastern Kentucky and adjacent Ohio in the disposal interval(Wickstrom,1993; Sparks et al., 2013; Battelle Memorial Institute,2015). Northeast Kentucky is not particularly seismically active(Fig.1 in Carpenter et al., 2014), and no seismic events have been detected in eastern Kentucky by KGS instruments that could be attributed to either hydraulic fracturing or wastewater injection(Kentucky Geological Survey, 2014).
Because the region around the KGS 1 Hanson Aggregates well is naturally underpressured (Takacs et al., 2010; Bowersox et al.,2019a),1.2 MPa underpressured in the Rose Run reservoir at 1 km drilled depth in the KGS 1 Hanson Aggregates well, it is attractive for the construction of efficient oilfield wastewater disposal wells(see the discussion in McNealy, 1991; Wickstrom, 1993; Sparks et al., 2013; Levandowski et al., 2018). Levandowski et al. (2018)commented that underpressured basins are not insulated from induced seismicity as the basement faults are at equilibrium with the underpressure and thus candidates for slipping. Although the underlying Precambrian basement in the adjacent Rome Trough(Fig.1) is heavily faulted (see also Fig. 2 in Carpenter et al., 2019,2020),only three minor earthquakes occurred in the crust beneath the Rome Trough during a three-year microseismic-monitoring period from June 2015 to May 2019 (Carpenter et al., 2020). There appears to be little risk of induced seismicity in the region surrounding the KGS 1 Hanson Aggregates well,and there are no plans for CO2injection in the foreseeable future, but the answer to how induced seismicity might affect CO2injection and storage in the Rose Run and other potential reservoirs in the Central Appalachian will still require additional research.
8. Conclusions
There are no plans at this time for the development of CO2storage in northeast Kentucky (Bowersox et al., 2019a), although tests of the Rose Run Sandstone in the KGS 1 Hanson Aggregates well demonstrated that it is suitable for long-term CO2storage with reservoir confinement by the underlying Copper Ridge and overlying Beekmantown dolomite.Reservoir properties,geomechanical properties, and injectivity tests were all favorable for use of the Rose Run for CO2storage.It would be constrained, however, by (i)geomechanical properties of relatively low rock strength, evidenced by low elastic geomechanical properties compared to underlying and overlying confining strata(Fig.9);(ii)low compressive strength relative to the confining strata (Fig. 10); and (iii) low fracture gradient during injection (Fig. 11). The 9.3 MPa/km hydrostatic gradient in the Rose Run,1.2 MPa underpressured(Fig.7),typical of Kentucky reservoirs, would otherwise be favorable for CO2storage,however, it also may be a candidate for induced seismicity during CO2injection. Therefore, step-rate testing before injection of CO2, cautious monitoring of injection pressure as was performed in the Battelle 1 AEP well, and further research into possibility for induced seismicity during CO2injection into the Rose Run, are suggested before any future CO2storage reservoir is developed in the Rose Run in northeast Kentucky.
Declaration of competing interest
The authors declare that they have no known competing financial interests or personal relationships that could have appeared to influence the work reported in this paper.
Acknowledgments
This research was funded by the Commonwealth of Kentucky,USA through the Energy Independence and Incentives Act of 2007,and was partially supported by the Open Research Fund of State Key Laboratory of Geomechanics and Geotechnical Engineering, Institute of Rock and Soil Mechanics, Chinese Academy of Sciences,Wuhan, China (Grant No. Z018004). Access to the drill site was granted by Hanson Aggregates, Grayson, Kentucky, USA without which this project would not have been possible. All well data,including logs, core photographs and analyses, petrographic photomicrographs and descriptions, and step-rate test pressure data,are available online through KGS’s Oil and Gas Records Database.
 Journal of Rock Mechanics and Geotechnical Engineering2021年5期
- Journal of Rock Mechanics and Geotechnical Engineering的其它文章
- Surface characteristics analysis of fractures induced by supercritical CO2 and water through three-dimensional scanning and scanning electron micrography
- Prediction of fracture and dilatancy in granite using acoustic emission signal cloud
- Hysteresis in the ultrasonic parameters of saturated sandstone during freezing and thawing and correlations with unfrozen water content
- Coupled Eulerian-Lagrangian simulation of a modified direct shear apparatus for the measurement of residual shear strengths
- A novel true triaxial test system for microwave-induced fracturing of hard rocks
- Hydromechanical behavior of unsaturated expansive clay under repetitive loading
