Reliability sensitivity of wind power system considering correlation of forecast errors based on multivariate NSTPNT method
Wangchao Dong and Shenghu Li
Abstract The impact of wind power forecast errors (WPFEs) on power system reliability can be quantified by a sensitivity model, which helps to determine the importance of different wind farms.However, the unknown distribution and correlation of WPFEs make it difficult to calculate the reliability sensitivity.The existing univariate non-standard third-order polynomial normal transformation (NSTPNT) expresses the reliability sensitivity of WPFEs by a normal random variable with explicit distribution, and is not suitable for multiple wind farms with correlated forecast errors.In this paper, the univariate NSTPNT method is extended to the multivariate by deriving the analytical expression of the correlation coefficients before and after the transformation, to establish the transformation between the WPFEs and a normal random vector (RV)with the specific correlation.A reliability sensitivity model to the WPFEs expressed to the normal RV is then proposed.The numerical results validate the accuracy of the proposed multivariate NSTP NT and the sensitivity model.The maximum relative error for using the sensitivity to approximate the change of reliability with distribution parameters of the WPFEs is less than 2.42%.The necessity of considering the correlation of WPFEs is analyzed.The maximum relative error of the sensitivity reaches 83% when the correlation is ignored.
Keywords: Multivariate NSTPNT, Wind farms, WPFEs, Correlation, Reliability, Sensitivity
1 Introduction
Wind power forecast errors (WPFEs) introduce power imbalance into power systems [3, 15, 27, 40].This then requires additional reserve to maintain the reliability level and thus increases the operating cost [1].A case study based on a real wind power installation in Spain illustrates that the forecast errors cost around 10% of the total income of the energy generation [12].The imbalance caused by WPFEs is illustrated in Fig.1, where the data is taken from the aggregate wind power in Belgium.
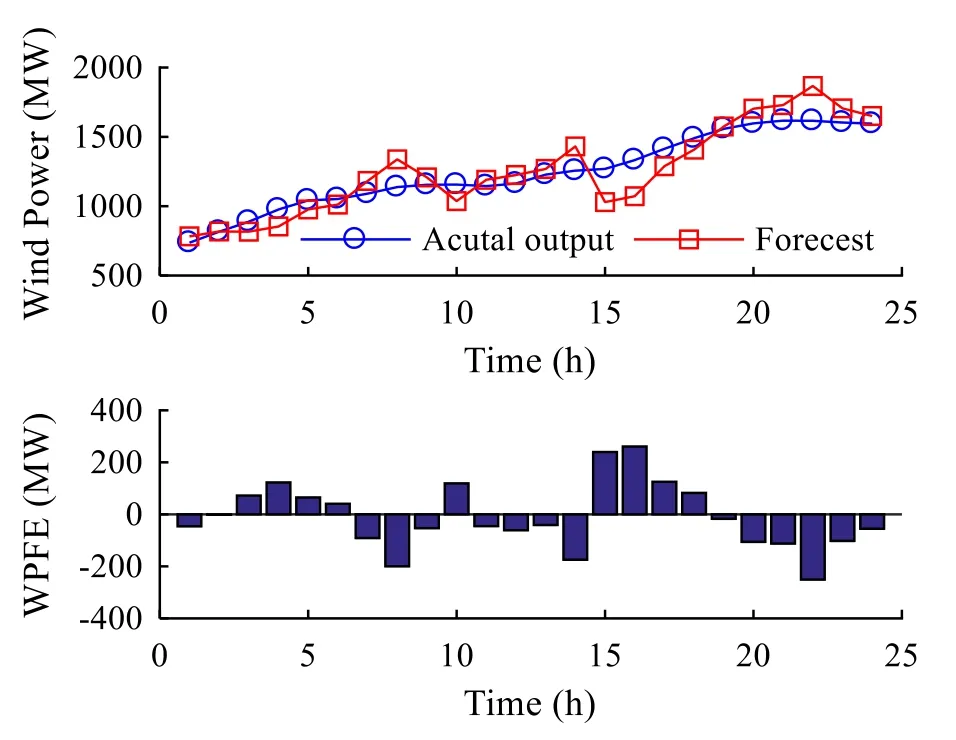
Fig.1 Power imbalance caused by WPFEs
The uncertainty of the forecast has drawn a great deal of global attention while its accuracy is also far from satisfactory [5, 19, 23, 37, 41].According to a statistical report on domestic WPFEs in China, the root mean square errors are around 10%–20% for day-ahead forecasting [26].As it is difficult to improve the accuracy of the forecast, quantifying the impact of WPFEs on the reliability can provide a compromise solution for power dispatch.
Reliability sensitivity of a power system reflects the impact of the parameters of the components on power system reliability.This helps to identify system“bottlenecks” and to compare the importance of different components quantitatively [21].In [2], the sensitivities are applied to rank connected synchronous generators according to their importance to the system in terms of angular and voltage stability.The sensitivities of the real and reactive power losses with respect to the size and the operating point of the distribution generations have been studied in [17], while a hybrid multiobjective sensitivity analysis algorithm is proposed to optimize the capacity of PV and storage systems in [18].A formulation for distribution class local margin prices is presented based on power flow sensitivity in [32], and a sensitivity matrix-based approach is proposed to improve the minimum damping ratio in [45].
However, the existing methods cannot be applied to the sensitivity analysis of a wind power system considering WPFEs.Assuming that WPFEs follow certain distributions, e.g., the normal distribution [31], the Cauchy distribution [14], the hyperbolic distribution [16], or the mix distribution model [35], the sensitivity of the reliability of the wind power system to WPFEs can be expressed by the partial derivative of the probability density function (PDF), while the distribution of WPFEs is unknown.Nonparametric methods, including the Gaussian mixture model (GMM) [38] and the kernel density estimation [4], may be applied to model the PDF of WPFEs.The relationship between the original distribution parameters of WPFEs and the distribution model by these methods is implicit, which makes it difficult to calculate the sensitivity.
When multiple wind farms are integrated into a power system, the dependency between different wind farms has a significant impact on the reliability [42].WPFEs at different locations cannot be assumed to be independent if they are geographically close owing to the inertia of meteorological forecasting systems [30, 44].According to the case studies based on western Denmark [34] and Ireland [39], the correlation of the WPFEs is strongly dependent on the distance between the wind farms.In general, with decreasing distance between two wind power production sites, the correlation of WPFEs increases [24].It should be noted that the correlation of WPFEs between multiple wind farms will increase the uncertainty of the system exposed to them, while the correlation of the wind power forecast does not expose the system to greater levels of uncertainty [10].Therefore, it is necessary to take the correlation of WPFEs into account.
Multivariate methods may be used to model the joint distribution of WPFEs, e.g., the multivariate kernel density estimation is adopted to model the joint distribution of wind speed, wind direction, and the air density [46].Reference [33] presents a probabilistic approach for statistical modeling of the loads in distribution networks where the multivariate GMM is applied to capture the correlation between different buses.A probabilistic power flow method is proposed based on the multivariate third-order polynomial normal transformation(TPNT) method and quasi Monte Carlo simulation [13],while the joint probabilistic distribution of wind power is modeled by the Copula function in [22] where the influence of wind power correlation on voltage stability is analyzed.The multivariate joint distributions of WPFEs are established in terms of the spatial and temporal correlation in [36, 47].Although these multivariate methods determine the joint distribution considering the correlation, the relationship between the original distribution parameters of WPFEs and the distribution modeled is still implicit, which cannot be applied to calculate the sensitivity directly.
So far,there has been little research proposed to calculate the sensitivities of the reliability with respect to WPFEs considering an unknown distribution and the correlation.The univariate non-standard third-order polynomial normal transformation (NSTPNT) method proposed by the authors establishes the transformation between the non-normal and non-standard normal random variables [20].The expressions of the polynomial coefficients are derived based on the linear moments and the probability weighted moments analytically [8].With the univariate NSTPNT method, the sensitivity with respect to WPFEs is expressed as being of the nonstandard normal random variables.This solves the problem of the reliability sensitivity of the power system with a single wind farm integrated, while the correlation among different wind farms is ignored.
During the estimation of reliability and sensitivity, the samples of WPFEs of smaller size than the historical data may be applied to save time.The normal samples are drawn and transformed to the WPFEs samples by multivariate NSTPNT, while the transformation may cause correlation error because of the limited sample size.A correlation control technique is thus introduced to correct this error, while the WPFEs samples and normal samples are applied to calculate the reliability and sensitivity, respectively.Thus a one-to-one correspondence between the two samples is necessary to ensure the accuracy of the reliability sensitivity, while a traditional method such as the Cholesky decomposition [25] controls the correlation of one sample at a time.A flexible method is thus required to preserve this correspondence,such as use of a genetic algorithm (GA) [43].
The contributions and originality of this paper are summarized as follows.
(1) The univariate NSTPNT method is extended to the multivariate one by deriving the analytical expression of the correlation coefficients before and after the transformation.
(2) A correlation control technique based on GA is modified to control the correlation of the normal and WPFEs samples simultaneously.
(3) The reliability sensitivity considering the correlation of WPFEs among different wind farms is estimated.
The rest of the paper is organized as follows.The multivariate NSTPNT method is derived in Section 2.The reliability sensitivity is estimated in Section 3.The numerical results are presented and discussed in Section 4.The conclusion is presented in Section 5.
2 Methods: multivariate NSTPNT
The non-normal random vector (RV) Y is transformed to the polynomial non-standard normal RV Z with the same expectation μ and standard deviation σ.The transformation is divided into two parts as shown in Fig.2,with the transformation of the component noted as fiand the transformation of the correlation coefficient noted as gij, as:
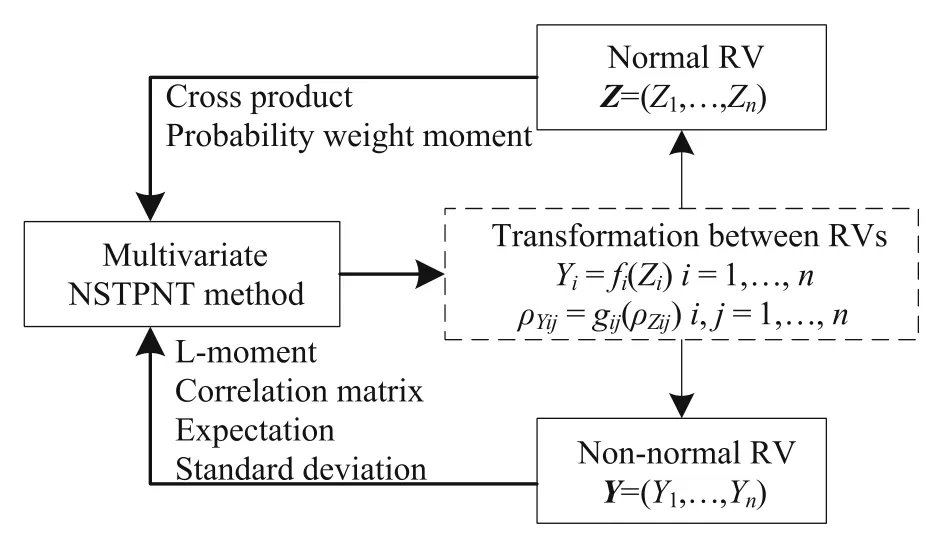
Fig.2 Transformation using MVNSTPNT method
where 1 ≤i, j ≤n, Yiand Ziare the components of Y and Z, respectively.ρYijis the correlation coefficient between Yiand Yj, while ρZijis the correlation coefficient between Ziand Zj.n is the dimension of the RV.
The transformation of a component is derived based on the L-moment and probability weight moment, and the polynomial coefficients are obtained as shown in[20].Focusing on the transformation of the correlation coefficient, which is derived based on the cross product,the transformations of components are given as:

where μi, μj, σi, and σjare the expectations and the standard deviations of Yiand Yj.a0i-a3iand a0j-a3jare the polynomial coefficients of fiand fj, respectively.
The cross product of Yiand Yjis calculated as:

Expanding(3) leads to:
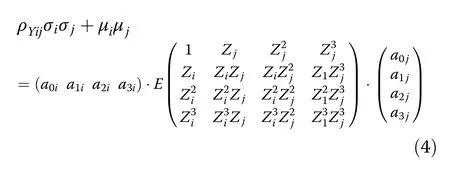
From (4), the relationship between the correlation coefficient of the non-normal RV and the cross products of the non-standard normal RV is established.In practice, ρYijis estimated with the sample data.The cross product E (Zp iZq j) is expressed as:
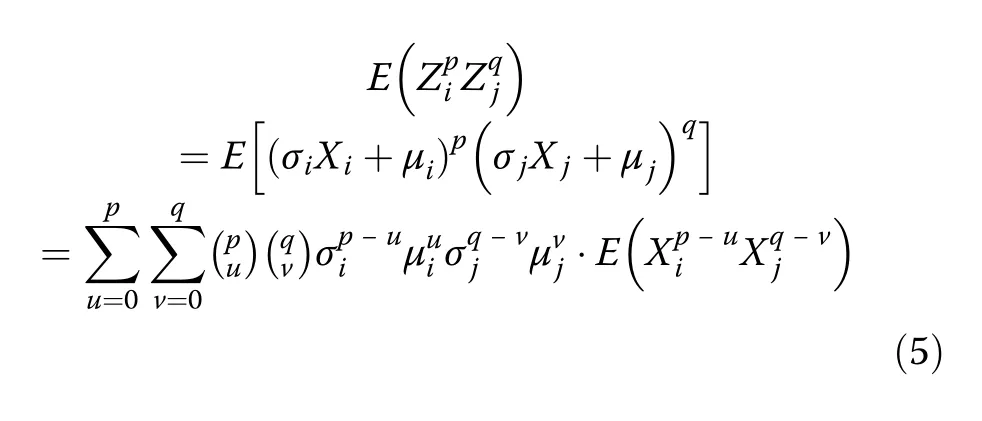
where p, q=0, 1, 2, 3.Xiand Xjare the normalized components of Ziand Zj, respectively.ρXijis equal to ρZij,while (u p) and (v q) are the combinatorial numbers.The formulas of the cross product of bivariate standard normal random variables are shown as [29]:
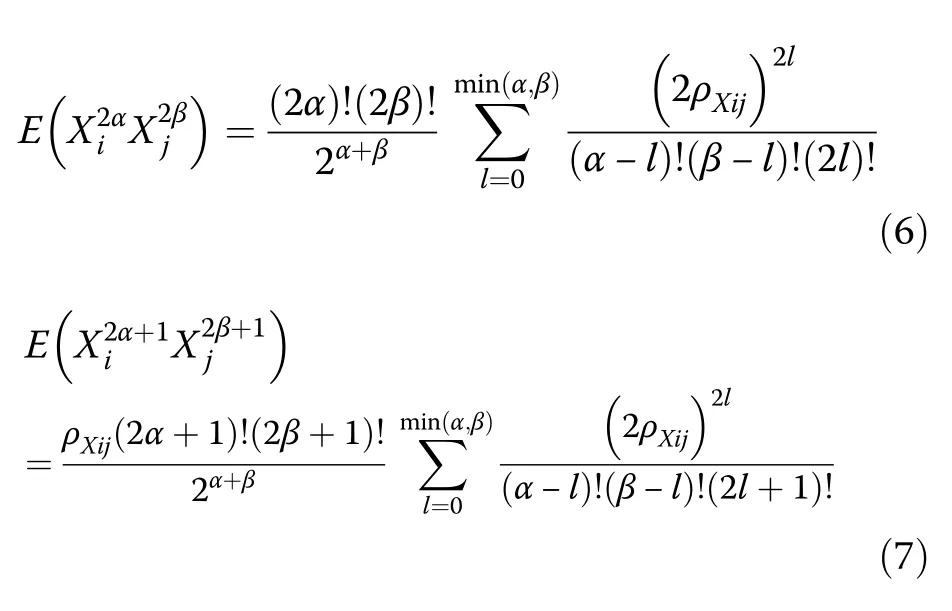
Substituting (6) and (7) into (5) yields:
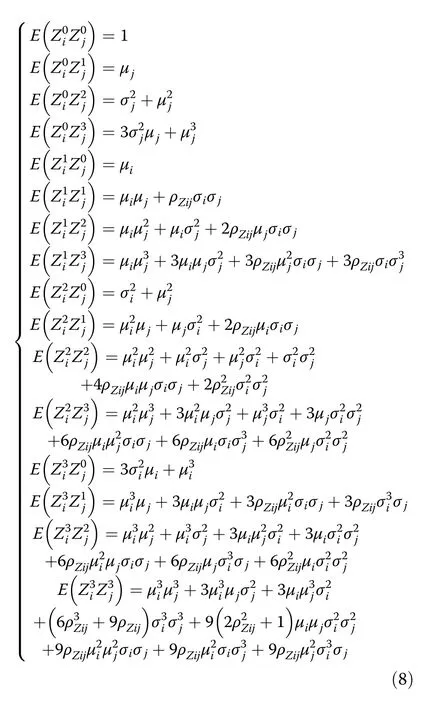
By substituting (8) into (4), the transformation of the correlation coefficient is derived, while solving (4) obtains the correlation coefficient of the normal RV.The valid solution should satisfy the following restrictions:

The joint probability density function (PDF) of Y is expressed as:

where ϕ is the joint PDF of the normal RV.ρZis the correlation matrix of Z, and its elements are obtained by solving (4) for each element in the correlation matrix of Y.
The differences between the univariate NSTPNT and the multivariate NSTPNT methods lie in:
(1) The univariate NSTPNT method establishes the transformation between the random variables, while the multivariate NSTPNT method establishes the transformation between the RVs.The correlation information between the components of the RV is captured by the multivariate NSTPNT method, but is ignored by the univariate VNSTPNT method.
(2) The multivariate NSTPNT method is divided into two parts of component transformation and correlation coefficient transformation.The former is the same as the univariate NSTPNT method,while the latter is newly derived.
(3) The univariate NSTPNT method determines the marginal PDF of the RV, while the multivariate NSTPNT method determines the joint PDF.
3 Reliability and sensitivities of a power system with multiple wind farms
The WPFEs of multiple wind farms are regarded as the RV Y.Based on the historical data of the WPFEs, the transformation between Y and a normal RV Z with specific correlation is established by the multivariate NSTP NT method.With the Monte Carlo method and optimal load curtailment model, the reliability and sensitivity are estimated based on the samples of the WPFEs and the normal RV,respectively.The correlation of both samples is adjusted by a modified correlation technique.
3.1 Modified correlation control
During the estimation, the normal sample SZis drawn at first, then transformed to the sample of the WPFEs SYby the multivariate NSTPNT method.The multivariate NSTPNT method establishes the transformation between the two RVs, while in practice the samples of the RVs are adopted.The transformation based on the RVs yields errors when applied to the samples because of the limited sample size.The correlation control technique is introduced to ensure that the correlation of the RVs and samples stays the same.
As SYis drawn by transforming SZwith the multivariate NSTPNT method, SYis applied to estimate the reliability and SZis applied to calculate the sensitivity, as will be discussed in Section 3.3.Thus, a one-to-one correspondence between the elements of SYand SZis necessary to ensure the accuracy of the reliability sensitivity.To preserve this correspondence during the correlation control, a GA-based correlation control technique [43] is modified and the optimal subject fFitof the GA is given by:


where ρSam Yij and ρSam Zij are the correlation coefficients of SYand SZ, respectively.ΔρYand ΔρZare the differences between the correlation coefficients of the samples and RVs.Other operations including selection,crossover, and mutation are similar to [43] except that these operations should be executed on SYand SZsimultaneously.
3.2 Reliability estimation
Given the WPFEs, the load forecast errors, and the random outage of the system equipment, the reliability of wind power system is estimated.This paper mainly focuses on the unknown distribution and the correlation of the WPFEs.The correlations between the WPFEs and the load forecast error, and those between the WPFEs and the equipment outage, are ignored.We set the sample size N.The sample of the power system is drawn by combining the samples of the WPFEs, the load forecast error, and the equipment outage denoted as SSys,h(h=1,…, N).By substituting SSys,hinto the optimal load curtailment model based on DC power flow [6, 9], the reliability indices including the loss of load probability(LOLP) and the expected demand not served (EDNS)are calculated as:

where Ifis the indicator of the load curtailment, and If=1 denotes system failure with load curtailment.Lcis obtained by solving the optimal load curtailment model.
3.3 Reliability sensitivities with correlated WPFEs
The sensitivities of the reliability indices with respect to the distribution parameters of the WPFEs are calculated as:

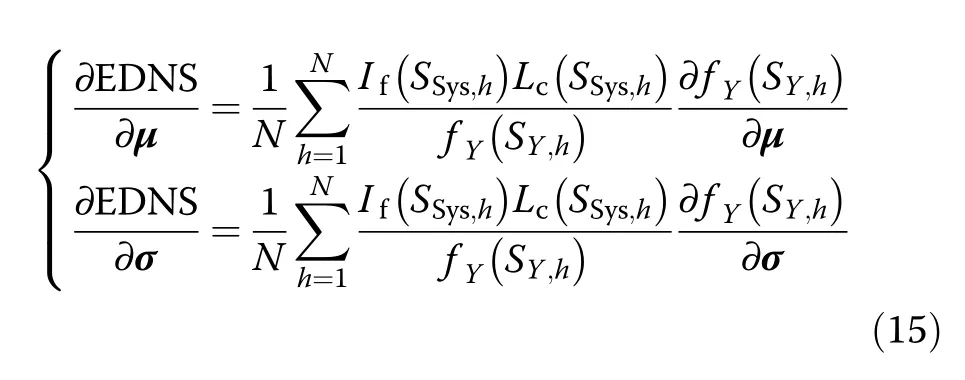
where SY,his the element of SY.
With the unknown distribution of the WPFEs and the correlation between multiple wind farms, the joint PDF of the WPFEs is expressed by (10) according to the multivariate NSTPNT method.Thus, in (14) and (15),the joint PDF of the WPFEs is replaced by that of normal RV, ϕ (SZ,h|ρZ)as:
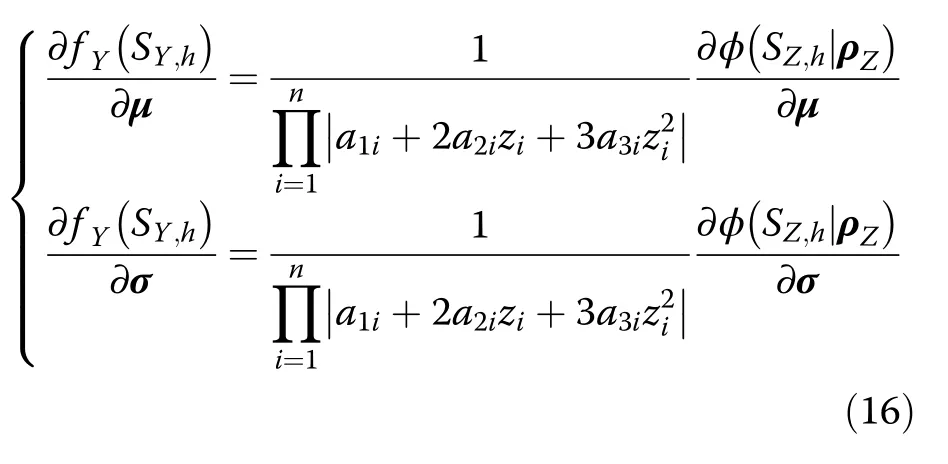
where SZ,his the element of SZ.The joint PDF of the normal RV is given by:

where C is the covariance matrix given as:

The derivation of ϕ (SZ,h|ρZ) with respect to μ is written in the form of the vector as:

The derivation of ϕ (SZ,h|ρZ) with respect to σ cannot be written in the form of a vector, and should be calculated separately for each σias:
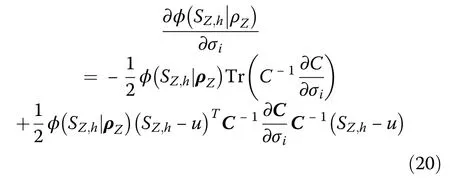
where Tr represents the trace of a matrix.
The derivation of C with respect to σjis a sparse matrix with only the elements of the ithrow and the ithcolumn being nonzero,as:

By substituting (15), (18) and (19) into (13) and (14),we obtain the sensitivity of the wind power system reliability with respect to the distribution parameters of the WPFEs considering the correlation between multiple wind farms.
The main difference of the sensitivities between the univariate case and the multivariate case lies in the joint PDF.Ignoring the correlation between multiple wind farms, the covariance matrix is a diagonal matrix.Thus,the joint PDF is expressed as the product of the marginal PDFs, and the sensitivity is calculated independently with the univariate NSTPNT method.If the WPFEs of multiple wind farms are independent, the sensitivities calculated by the univariate NSTPNT and the multivariate NSTPNT methods are identical.However, correlation of the WPFEs exists in practice and the covariance matrix cannot be regarded as a diagonal matrix.Therefore, ignoring the correlation of the WPFEs leads to errors in calculating the reliability and sensitivity.Thus, it is necessary to use the multivariate NSTPNT method to estimate the sensitivity in the multivariate case.
The coefficient of variance (CV)is applied as a convergence criterion of the reliability indices and sensitivities,

where E and D represent the expectation and the variance of the sample, respectively.
The process to estimate the reliability and sensitivity of a wind power system considering the correlated WPFEs is illustrated in Fig.3.
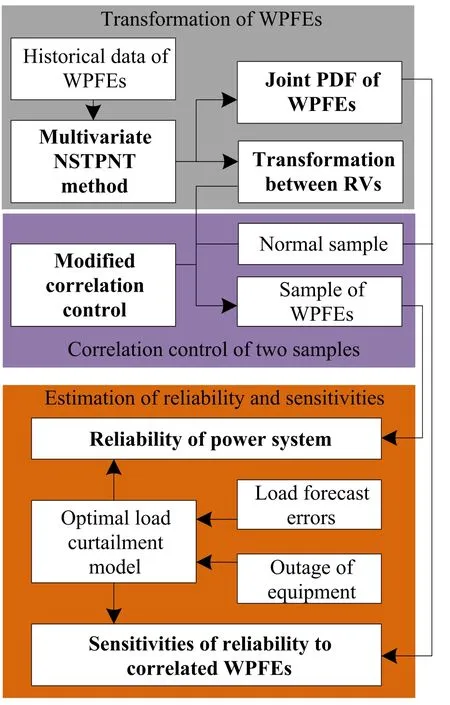
Fig.3 Reliability and Sensitivity considering correlated WPFEs
4 Results and discussion
The IEEE 14-bus test system [7] is modified to verify the proposed method.Two wind farms, noted as W1 and W2, are integrated to bus 2 and bus 8, respectively, as shown in Fig.4.The historical data of wind power output and the forecast from Elia [11] is adopted, while the WPFEs are obtained by calculating the difference between the actual wind power and the forecasted value.The penetration of wind power is 20% and the reserve capacity is determined based on the “3+5” rule [28].The correlation coefficient of the WPFEs is set at 0.5[10].The LOLP and EDNS of the system are 0.2643 p.u.and 0.0355 p.u., respectively.
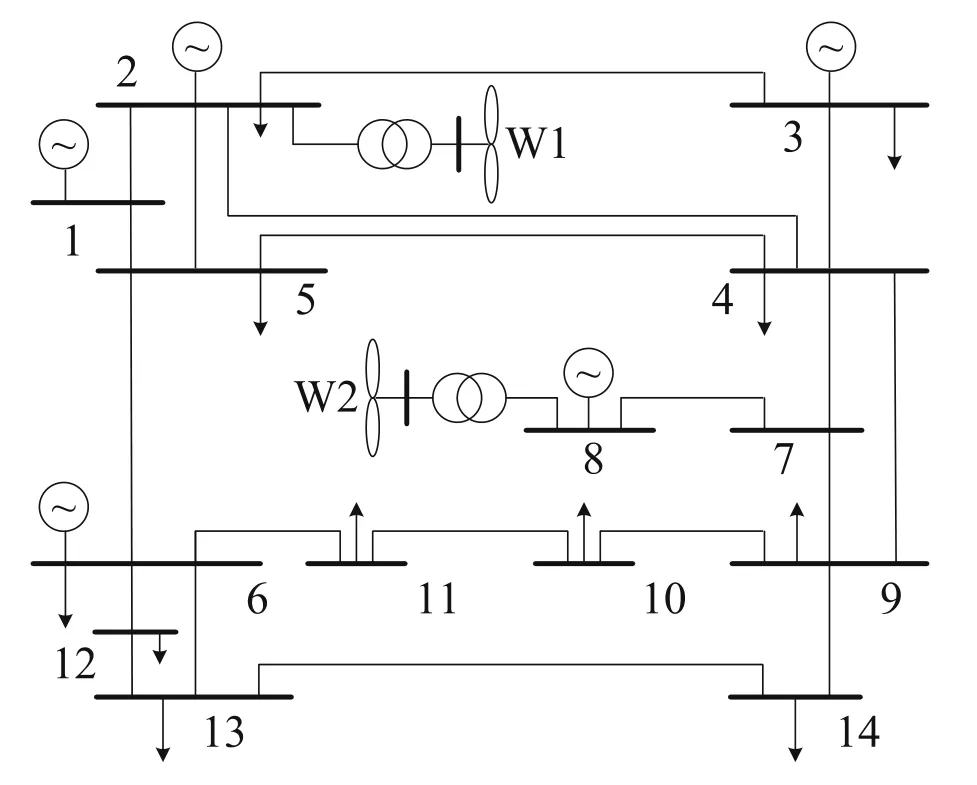
Fig.4 Modified IEEE 14-bus test system
4.1 Verification of the multivariate NSTPNT method
By assuming the same marginal distributions of the WPFEs, the correlation coefficient of the WPFEs ρY12changes from −1 to 1.The transformed correlation coefficients ρZ12obtained by the multivariate NSTPNT and the multivariate TPNT are compared in Fig.5.As can be seen, the results from the two methods are quite close.
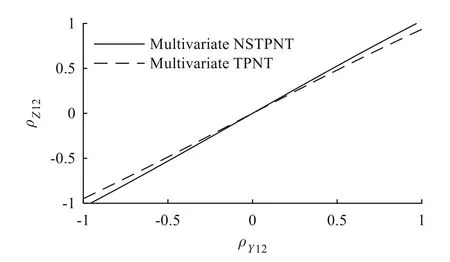
Fig.5 Comparison of the transformed correlation coefficient
With ρY12fixed at 0.5, ρZ12obtained by the multivariate NSTPNT method is 0.5247 which costs 0.9631 s on average.The joint PDFs are constructed using the multivariate GMM, the multivariate normal distribution, the multivariate TPNT method, and the multivariate NSTP NT method, respectively.The corresponding contours are compared in Fig.6 with the result obtained from the multivariate GMM selected as the reference.As is seen from Fig.6, the contour determined by the multivariate normal distribution is different from the others, while the contours determined by the multivariate NSTPNT method and the multivariate TPNT method are similar.The error of the joint PDF constructed by the multivariate NSTPNT is more obvious at the edge than in the central part.In general, the accuracy of the multivariate NSTPNT method and the multivariate TPNT method are similar, with both performing better than the multivariate normal distribution.As the multivariate NSTP NT method is applied to calculate the sensitivity of the power system reliability with respect to the distribution parameters of the WPFEs, its accuracy is thus verified.

Fig.6 Comparison of the contours of correlated WPFEs
4.2 Error analysis of correlation control
With the sample size N set at 1000, the normal sample SZand the WPFEs sample SYare drawn with three cases.The differences between the correlation of the samples and the target value are compared.The cases are defined as follows:
Case 1:Monte Carlo method with Cholesky decomposition, and the correlation of SZcontrolled;
Case 2:Monte Carlo method with GA, and the correlation of SZcontrolled;
Case 3:Monte Carlo method with GA, and the correlations of SZand SYcontrolled.
The convergence criterion of the GA is set at 10−5.Each case is repeated 100 times.The expectation and the standard deviation of ΔρYand ΔρZare listed in Table 1.As can be seen, the average error of Case 1 is the largest.For ΔρZ, the difference between Case 2 and Case 3 is small, while for ΔρY, only Case 3 is satisfactory.Thus it is necessary to control the correlation of the normal sample and the WPFEs sample simultaneously.

Table 1 Error analysis of correlation control
The average numbers of iterations for Cases 2 and 3 are 47.28 and 1069.53, respectively, and cost 0.1729 s and 4.5256 s,respectively.The increased calculation time is acceptable considering the time-consuming estimation of the reliability and sensitivity.
4.3 Error analysis of correlation control
By changing the sample size, the reliability indices of the power system and their sensitivities with respect to the distribution parameters of the WPFEs are estimated, and the CVs of the reliability and sensitivity are calculated.Because of limitations on space in this paper, only the CVs of the LOLP and EDNS, and the sensitivity of W1 are shown in Fig.7.In general, the reliability indices converge faster than the sensitivities, and so it is more time-consuming to estimate the sensitivities than the reliability.The slowest rate of the convergence is observed for the sensitivities of the EDNS with respect to the standard deviation.When the sample size is 8.5×10⁴, all the CVs are less than 0.08.
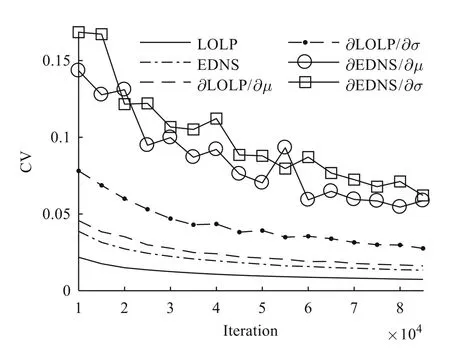
Fig.7 CVs of reliability indices and sensitivities
4.4 Verification of sensitivities
The sample size is now set at 8.5×10⁴.The reliability indices are calculated repeatedly as the expectation and standard deviation of the WPFEs are changed respectively within the range of ±10% and compared with those estimated by the sensitivities.The results of W1 are shown in Fig.8.
As is shown in Fig.8 (a) and (b), the red curves are not straight, which reflect the exact results of the LOLP change with the expectation and standard deviation.The reason is that the LOLP is a discrete value.It represents the probability of the power outage obtained as the number of the power outage divided by the sample size.
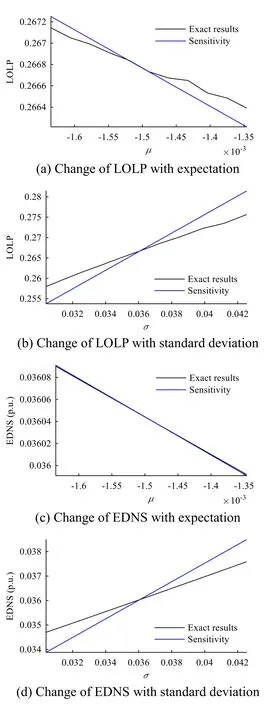
Fig.8 Verification of sensitivities
The relative errors of the sensitivities of LOLP with respect to the expectation and standard deviation are less than 0.07% and 1.63%, respectively.For EDNS, the relative errors are less than 0.03% and 2.42% respectively.The difference between the results obtained by the two methods is small, which verifies the accuracy of the proposed sensitivity model.
4.5 Impact of WPFE correlation on reliability and sensitivity
The reliability of the power system is calculated with different correlation coefficients of the WPFEs, as shown in Table 2.The LOLP and EDNS increase monotonously with the correlation coefficients.Hence ignoring the correlation between the multiple wind farms will lead to an optimistic estimation of power system reliability.
Based on the results in Table 2, the sensitivities of the reliability are calculated using the multivariate NSTPNT method and the univariate NSTPNT method, respectively, where the latter ignores the correlation.The differences of the sensitivities between two methods are shown in Table 3.When ρY12is 0, the maximum relative error is less than 0.0006%, so the results obtained from the two methods are consistent with each other if the WFPEs are independent.With the increase of ρY12, the relative errors increase monotonously with a maximum value of around 83%.It means that with higher levels of WPFE correlation, the errors of the sensitivities caused by ignoring the correlation will be significant.

Table 2 Impact of WPFE correlation on reliability
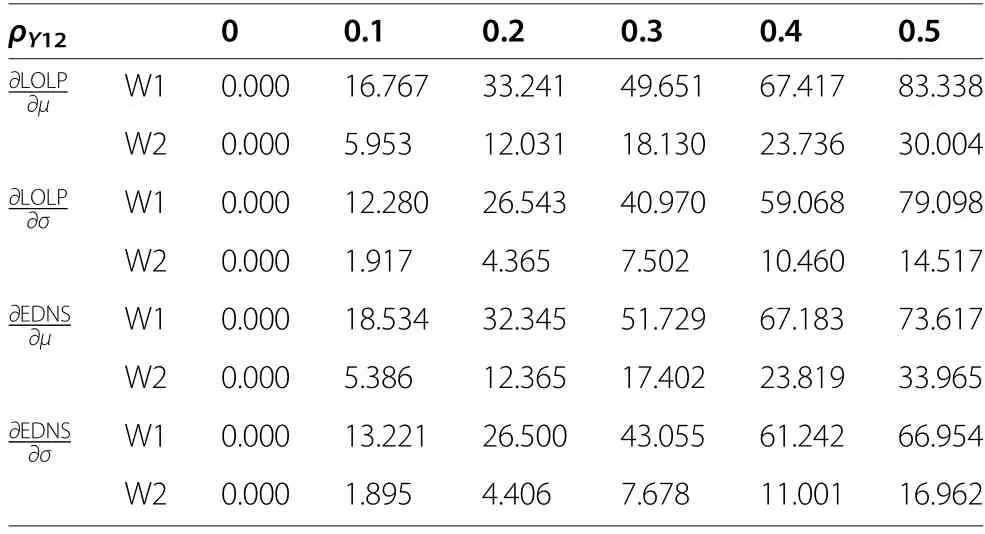
Table 3 Relative error of sensitivity (%)
5 Conclusion
The existing method uses the univariate NSTPNT to calculate the reliability and sensitivity of the system with a single wind farm, but is not competent for multiple wind farms with correlations of WPFEs.In this paper, a reliability sensitivity model considering the correlated forecast errors among multiple wind farms is proposed.The main work is summarized as follows:
(1) The univariate NSTPNT method is extended to the multivariate one by deriving the analytical expression of the correlation coefficients before and after the transformation to establish the transformation between the WPFEs and a normal RV with a specific correlation.The reliability sensitivity to the WPFEs is then expressed by the normal RV.
(2) Combining the Monte Carlo method and the multivariate NSTPNT method, the normal sample is transformed to the WPFEs one, and this is substituted into the optimal load curtailment to estimate the reliability and sensitivity.
(3) During the sampling, the error of the correlation between the WPFEs sample and its target value caused by transformation is corrected by a modified GA.
The numerical results yield the following conclusions:
(1) By comparison with the GMM and the TPNT method, the accuracy of the multivariate NSTPNT method is verified, while the accuracy of the sensitivity is validated by comparing the results from repeated calculations using different parameters.
(2) Ignoring the correlation of the WPFEs between the wind farms yields an overly optimistic estimation of power system reliability and errors of sensitivity.Such impacts will be more significant with higher levels of correlation.
(3) The reliability indices converge faster than the sensitivities.The slowest rate of the convergence is observed for the EDNS sensitivity with respect to the standard deviation.This is used as the indicator for the convergence of the whole calculation.
Future studies can be directed at the following areas:
(1) The accuracy of the multivariate NSTPNT method is verified by comparing the contours of the joint PDFs constructed by different methods.It may be improved with a quantitative approach.
(2) The slow convergence may be improved by a variance reduction technique.
Abbreviations
CV:Coefficient of variance; EDNS: Expected demand not served; GA: Genetic algorithm; GMM: Gaussian mixture model; LOLP: Loss of load probability;NSTPNT: Non-standard third-order polynomial normal transformation;PDF: Probability density function; RV: Random vector; TPNT: Third-order polynomial transformation;WPFEs: Wind power forecast errors
Acknowledgements
Not applicable.
Authors’ contributions
WD and SL conceived the study, carried out the programing test and drafted the manuscript.HZ,TF, TH and YZ helped perform the study analysis and revised the manuscript.All authors read and approved the final manuscript.
Funding
This work was supported by the Natural Science Foundation of China under grant 51877061.
Availability of data and materials
Please contact authors for data requests.
Declarations
Competing interests
The authors declare that they have no competing interests.
 Protection and Control of Modern Power Systems2021年0期
- Protection and Control of Modern Power Systems的其它文章
- A comprehensive review of DC fault protection methods in HVDC transmission systems
- Application of a simplified Grey Wolf optimization technique for adaptive fuzzy PID controller design for frequency regulation of a distributed power generation system
- A critical review of the integration of renewable energy sources with various technologies
- Operational optimization of a building-level integrated energy system considering additional potential benefits of energy storage
- An integrated multi-energy flow calculation method for electricity-gas-thermal integrated energy systems
- Sliding mode controller design for frequency regulation in an interconnected power system
