Interaction of Ca2+and soil humic acid characterized by a joint experimental platform of potentiometric titration,UV-visible spectroscopy,and f luorescence spectroscopy
Haiming Tang·Baohua Xiao·Peiwen Xiao
Abstract Rocky desertif ication has become a major environmental issue in the karst region of southwestern China.Karst rocky desertif ication was more severe in regions of limestone soil than in adjacent regions of other soils,despite the relatively higher soil organic matter(SOM)content in limestone soil.The underlying mechanism remains ambiguous.We speculated that the geochemical characteristics of limestone soils in the karst region plays an essential role,especially the high calcium content of limestone soil.To test this hypothesis,we collected limestone soil samples from a limestone soil prof ile in the southwestern China karst region and extracted humic acid(HA)from these limestone soil samples.We investigated the interaction of Ca2+and three HA samples on a joint experimental platform,which consists of an automatic potentiometric titrator,a UV—visible spectrometer,and a Fluorescence spectrometer.HA solutions were titrated by Ca2+and optical spectra of the HA solutions were monitored during the titration experiments.The results indicated that:(1)the interaction of Ca2+and HA is a combined process of adsorption and complexation.Adsorption dominated the overall distribution behavior of Ca2+,which could be f it by Langmuir and Freundlich isotherm models.Complexation was distinguished only when the concentration of Ca2+is low;(2)the changes of UV—visible spectroscopy and excitation—emission matrix f luorescence spectroscopy spectra of HA samples when they were binding with Ca2+implied the apparent molecular size and structure of HA became larger and more complex;(3)the combination of Ca2+and HA plays an important role in the SOM preservation of limestone soils but the stability of the Ca—HA association was relatively weak.The present study draws attention to maintaining the relatively higher Ca2+concentration in limestone soils in ecologic restoration attempts in karst regions.
Keywords Limestone soil·Humic acid·Calcium·Interaction·Titration·UV—Vis·EEM
1 Introduction
The karst landscape is a typical natural landscape accounting for approximately 12%of the world’s total terrestrial area(Derek and Paul 2007;Liu 2009).The karst region in southwestern China is the largest karst region with continuous carbonate rock outcrops.This region suffers a series of environmental problems,especially,the karst rocky desertif ication,due to the rapid population growth and economic development over the last two decades(Wang 2003;Wang et al.2004;Liu 2009).Different karst rocky desertif ication situations had been observed(Bai et al.2011)and limestone soil regions often found more severe karst rocky desertif ication situations compared to adjacent regions of other soils in the southwest China karst region(Zheng and Wang 2002;Yan et al.2019)despite the relatively higher SOM content in limestone soils(Liu 2009;Di et al.2019).Yet what role the characteristics of soil plays during the occurrence of karst rocky desertif ication is largely unknown.
Soil organic matter(SOM)is an important component of soil and contributes the most to the properties and service functions of soil(Osman 2013;Coleman and Wall 2014).SOM is the largest reactive carbon pool,and its turnover kinetics has the compound feedbacks to the climate changes(Schmidt et al.2011).Several potential mechanisms of SOM stabilization in the soil had been proposed,for example,the inherent recalcitrance or thermodynamic stability of SOM,the selective preservation of SOM by decomposers,the physical occlusion between SOM and decomposers,and the sorption of SOM by soil minerals to form organo-mineral complexes(Sollins et al.1996).However,recent studies argued that the SOM stabilization in soil was mainly driven by ecosystem properties rather than the different inherent recalcitrance of SOM fractions(Schmidt et al.2011;Lehmann and Kleber 2015).The mechanisms of SOM protection are still controversial and demand more extensive studies.
Humic substances,the major fraction of SOM,are complex mixtures of natural organic macromolecules produced by biotic and abiotic transformations of plant,microbial,and animal residues in soil(Aiken et al.1985).Because of the high complexity and heterogeneity,humic substances are often divided into three principal fractions,that is,humic acids(HA),fulvic acids(FA),and humin(HM)(Stevenson 1994).Of the three,HA is moderate in terms of either biochemical stability or biochemical activity and is viewed as the principal structural humic substances in soil(Stevenson 1994;Jones and Bryan 1998;Agnelli et al.2002;Janosˇet al.2008).Characterization studies on HA help to understand the composition and evolution of SOM,which are of great signif icance in the reasonable utilization and remediation of soil resources(Piccolo and Mbagwu 1994;Osman 2013).The SOM stabilization studies were mainly focused on interactions between SOM and iron-aluminum oxides in acidic soils(Gru¨newald et al.2006;Kogelknabner et al.2008;Gerke 2010;Zhao et al.2017),but few studies on neutral to alkaline soils were reported.Limestone soil,which usually forms on the carbonate rocks,is a typical neutral to alkaline soil with a relatively high content of Caand SOM(Baldock and Skjemstad 2000;Bollag and Stotsky 2000;Liu 2009;Kloster et al.2013),and its physicochemical properties are much different from those of other soils in the karst region(Di et al.2019;Yan et al.2019).Many studies had speculated that HA could complex with Cato form stable humic-Ca complexes(Duchaufour 1976;Oades 1988;Begum et al.2018),and the humic-Ca complexes might inf luence the accumulation and transformation of SOM in the limestone soil(Ma et al.2016;Di et al.2019).However,systematical and quantitative studies on the interaction between Caand HA from limestone soils were seldom reported,and whether CaCOor Caeffects characteristics of HA is still controversial(Jin and Zimmerman 2010;Plank and Bassioni 2007;Begum et al.2018;Jin et al.2018).
The primary objective of this study is to investigate interactions between Caand HAs isolated from limestone soils in the aqueous solution and to characterize changes of the apparent molecular properties of HA in the solution as the coexisting Caconcentration increasing.For this purpose,we designed a joint continuous experimental system comprised of a potentiometric titrator,UV—visible spectroscopy(UV—Vis),and f luorescence spectroscopy as the main experimental platform.The potentiometric titration,UV—Vis,and excitation—emission matrix(EEM)f luorescence spectroscopy spectra had been used widely in many kinds of research and each of them had obtained instructive results.Usually,these techniques were applied separately(Abate and Masini 2001;Chen et al.2002;He et al.2016),and data from different studies lacked consistency.We here tried to combine these three techniques into a measurement platform so that we can monitor in real-time the free concentration of Cain HA solution during the titration and observe UV—Vis and EEM f luorescence spectra of the HA solution simultaneously.The systematic study of the interaction between HA and Cacan improve understandings of how Cainf luences the stability of SOM in the limestone soil of karst regions and provide theoretical supports for strategies of mitigating karst rocky desertif ication.
2 Materials and methods
2.1 Preparation and characterization of soil and soil HA samples
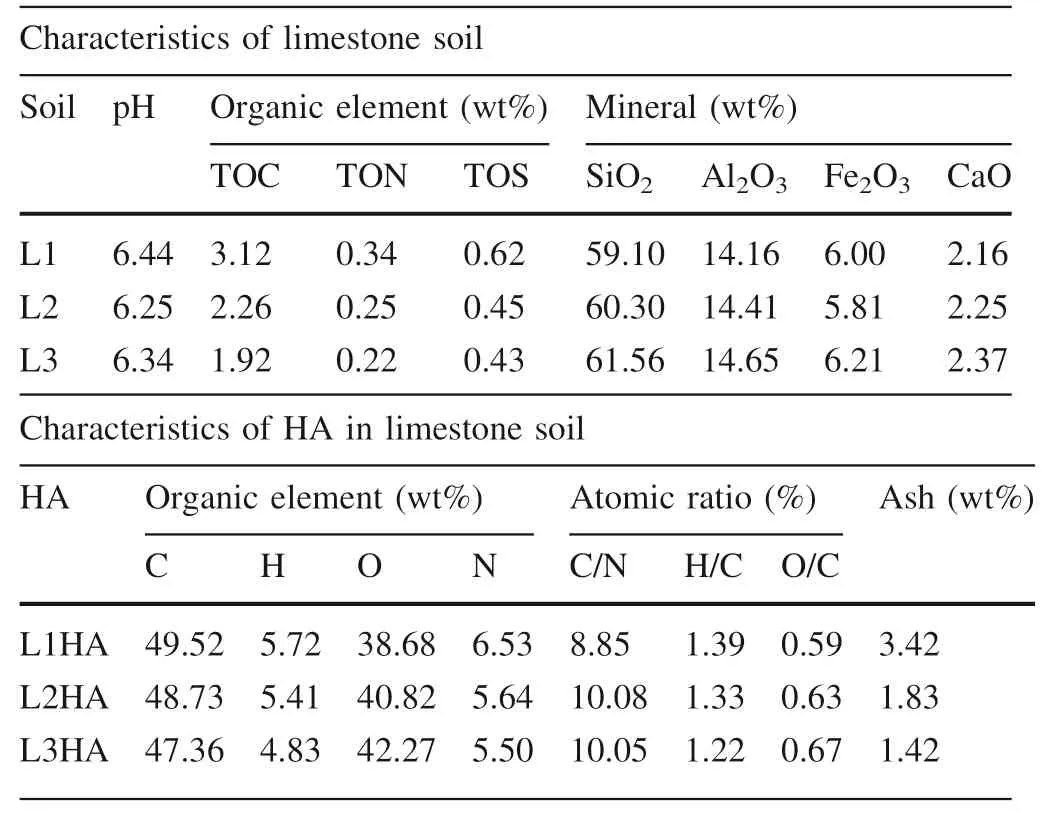
The limestone soils used in this study are the typical soil of the southwest karst region of China.The limestone soils were collected from a limestone soil prof ile(25.307°N,107.936°E)in the Maolan Natural Karst Forest reserve,Guizhou,China,where the annual average temperature is 18°C and the annual precipitation is 765 mm.Before sampling,the surface of the site was cleaned for plant litter removal.A total of three soil samples were taken from an area of 50 cm by 50 cm at three layers with depths of 0—12 cm (L1),12—24 cm (L2),and 24—36 cm (L3).According to the f ield observation,the sampling interval was determined that the soil color shifted slightly at a depth of 12 cm.The soil samples were air-dried and slightly crashed to pass the sieve of 2 mm,and visible debris of rock and plant was manually picked out.The pH of the three limestone soils(L1,L2 and L3)are 6.4,6.3,and 6.3,respectively(measured at the soil:HO ratio of 1:5).The HA samples were obtained by extracting the three soil samples with NaOH solution(0.5 mol/L),the extraction operations were detailed elsewhere(Ma et al.2016).HA samples were labeled according to the collecting depth of soil samples:L1HA(0—12 cm),L2HA(12—24 cm),L3HA(24—36 cm).The elemental compositions and primary physicochemical properties of three limestone soils and three HA samples were list in Table 1,and the distribution of functional groups in three HA samples(measured byC-NMR)was described in Table 2.
2.2 Mensuration of the interaction between Ca2+and HA
An exact amount of a HA sample(10.0 mg)was carefully dissolved in 100 mL NaCl solution(0.1 mol/L)which was purged previously by Ngas and shook mildly under Ngas protection for 12 h to obtain the initial HA solution.The concentration and ionic strength of the initial HA solution were 100 mg/L and 0.1 M,respectively.Then,the exact volume of the initial HA solution(40 mL)was transferred into a titration cup(100 mL)for the following experiments.The joint experimental platform comprised three experimental units,an automatic potentiometric titrator(Mettler Toledo T50),a UV—visible spectrometer(Agilent Cary 300),and a f luorescence spectrometer(Hitachi F-4500),and the three experimental units were sequentially connected by several Tygon tubes so that the HA solution can be circulated in the system by a peristaltic pump(Millipore).All measurements were conducted under 25°C with the Ngas protection after the HA solution f low became stable.In the automatic potentiometric titration experiment,the HA solution was titrated by the CaClsolution(1 mol/L)with an increment of 0.02 mL and a titration interval of 120 s until the total concentration of Cain the solution reached 0.07 mol/L,the real-time concentration of free Caion in the solution was measured by a Ca-ISE electrode(Mettler Toledo perfectION)during the potentiometric titration.In the meantime,the UV—Vis and the EEM f luorescence spectra of the HA solution were monitored at predetermined times.The UV—Vis spectrometer was set to scan the wavelength range of 800—200 nm at the scanning rate of 600 nm/min.The EEM f luorescence spectroscopy was set to scan the excitation range of 240—450 nm and the emission range of 300—510 nm at the same scanning rate of 2400 nm/min.5 pairs of UV—Vis and EEM spectra were obtained for each HA solution when the total concentration of Cain the solution was 0.00,0.002,0.004,0.01,and 0.07 mol/L,respectively.
Characteristics of limestone soil Soil pH Organic element(wt%) Mineral(wt%)TOC TON TOS SiO2 Al2O3 Fe2O3 CaO L1 6.44 3.12 0.34 0.62 59.10 14.16 6.00 2.16 L2 6.25 2.26 0.25 0.45 60.30 14.41 5.81 2.25 L3 6.34 1.92 0.22 0.43 61.56 14.65 6.21 2.37 Characteristics of HA in limestone soil HA Organic element(wt%) Atomic ratio(%) Ash(wt%)C H O N C/N H/C O/C L1HA 49.52 5.72 38.68 6.53 8.85 1.39 0.59 3.42 L2HA 48.73 5.41 40.82 5.64 10.08 1.33 0.63 1.83 L3HA 47.36 4.83 42.27 5.50 10.05 1.22 0.67 1.42
2.3 Data collection and analysis
2.3.1 Potentiometric titration
The free Caconcentration in the HA solution was measured directly by the potentiometric titrator equipped with a Ca-ISE electrode,the concentration Cabound with HA was calculated by the mass balance equation(1),

q
is the concentration of Cabound with HA(mol/kg),V
is the volume of the HA solution(l),M
is the weight of the HA sample(kg),C
andC
are the calculated total concentration of Cain the solution and the concentration of free Cain the HA solution measured by the Ca-ISE(mol/L),respectively.The Langmuir model,the Freundlich model,the Langmuir—Freundlich model and the Toth model were employed to f it the titration experimental data to investigate underlying binding processes of Caon HA.The Langmuir model,the Freundlich model,the Langmuir—Freundlich model,and the Toth model are described by Eqs.(2),(3),(4),and(5),respectively: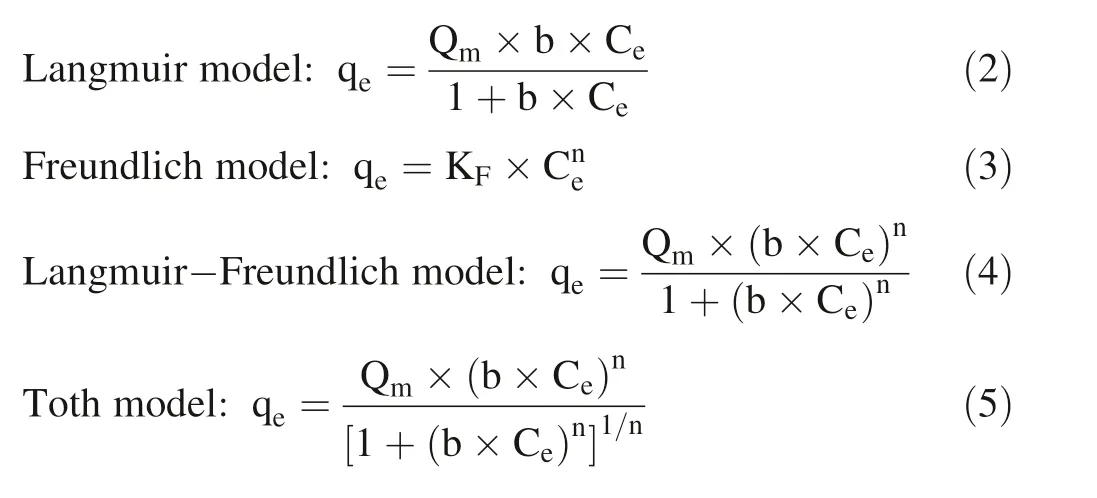
C
is the concentration of free Cain the HA solution(mol/L)andq
is the concentration of Cabound with HA(mol/kg);Q
is the maximum concentration of Cacan be sorbed by HA(mol/kg)andb
is the model parameter related to the sorption energy(l/mol)in Eqs.(2),(4)and(5);n
is the model parameter related to the heterogeneity of available sorption sites in Eqs.(3),(4)and(5);K
in Eq.(3)is the Freundlich parameter related to the sorption capacity.The titration results of the three HA samples and the f it curves by different sorption models were plotted in Fig.1.
Chemical shift(ppm) 0—45 45—60 60—110 110—140 140—160 160—185 185—230 Functional groups Alkyl group Methoxy group Carbo-hydrate Aromatic group Phenolic group Carboxyl group Ketonic grou L1HA 15.63 7.98 30.84 19.65 10.29 10.28 5.34 L2HA 14.66 7.91 29.40 21.75 10.99 10.38 4.92 L3HA 17.31 9.52 35.60 19.37 8.01 6.88 3.32

Fig.1 The HA-bound Ca2+concentration in HA samples Vs the free Ca2+concentration in the solutions during titration experiments and their sorption models f itting curves.Note:C e(mol/L)is the equilibrium free Ca2+concentration in the solution;q e(mol/kg)is the equilibrium HAbound Ca2+concentration in HA samples
2.3.2 UV-visible spectroscopy
A series of optical parameters calculated from the UV—Vis spectrum of HA had been suggested to quantify the physicochemical characteristics of HA(Chen et al.1977;Helms et al.2008;Vidal et al.2016).In this study,we selected three optical parameters,E/E,E/E,andΔlogK
,to investigate changes of the apparent molecular size,weight,and structural complexity for the HA sample during its interaction with different concentrations of Ca.Brief ly,the E/Evalue,one of the most used parameters in SOM characterization studies,refers to the ratio of absorbances at 465 nm and 665 nm in the UV—Vis spectrum.Prior studies had shown that the E/Evalue was a good indicator for the molecular weight of HA,the lower the E/Evalue,the heavier the molecular weight of HA(Chen et al.1977).The E/Evalue,which was used as the indicator of molecular size and weight of HA(Vidal et al.2016),refers to the ratio of absorbances at 250 nm and 365 nm in the UV—Vis spectrum;the lower E/Evalue,the larger molecular size of HA(Helms et al.2008).The ΔlogK
was viewed as the absorbances difference between 400 and 600 nm in the UV—Vis spectrum(Kumada 1987),studies had suggested thatΔlogK
could be used to characterize the degree of the molecular condensation of HA;the lowerΔlogK
,the higher molecular condensation degree of HA(Giovanela et al.2010).To better distinguish the specif ic inf luence of Caon molecular properties of three HA samples,we plotted the variations of E/E,E/E,and ΔlogK
versus the total concentration of Cain the HA solutions in Fig.2.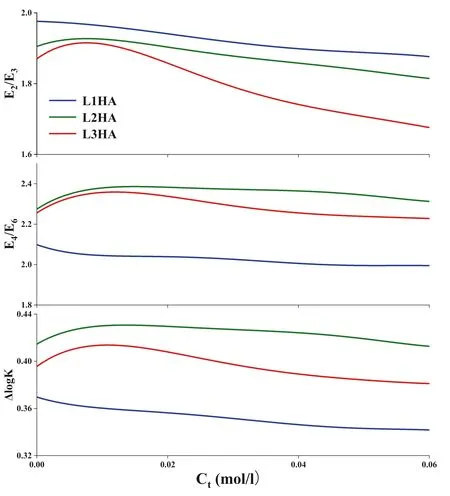
Fig.2 The variations of E2/E3,E4/E6,andΔlog K of three HA samples as the total concentration of Ca2+increasing.Note:Ct(mol/L)is the total concentration of Ca2+in the experiment system
2.3.3 EEM f luorescence spectroscopy
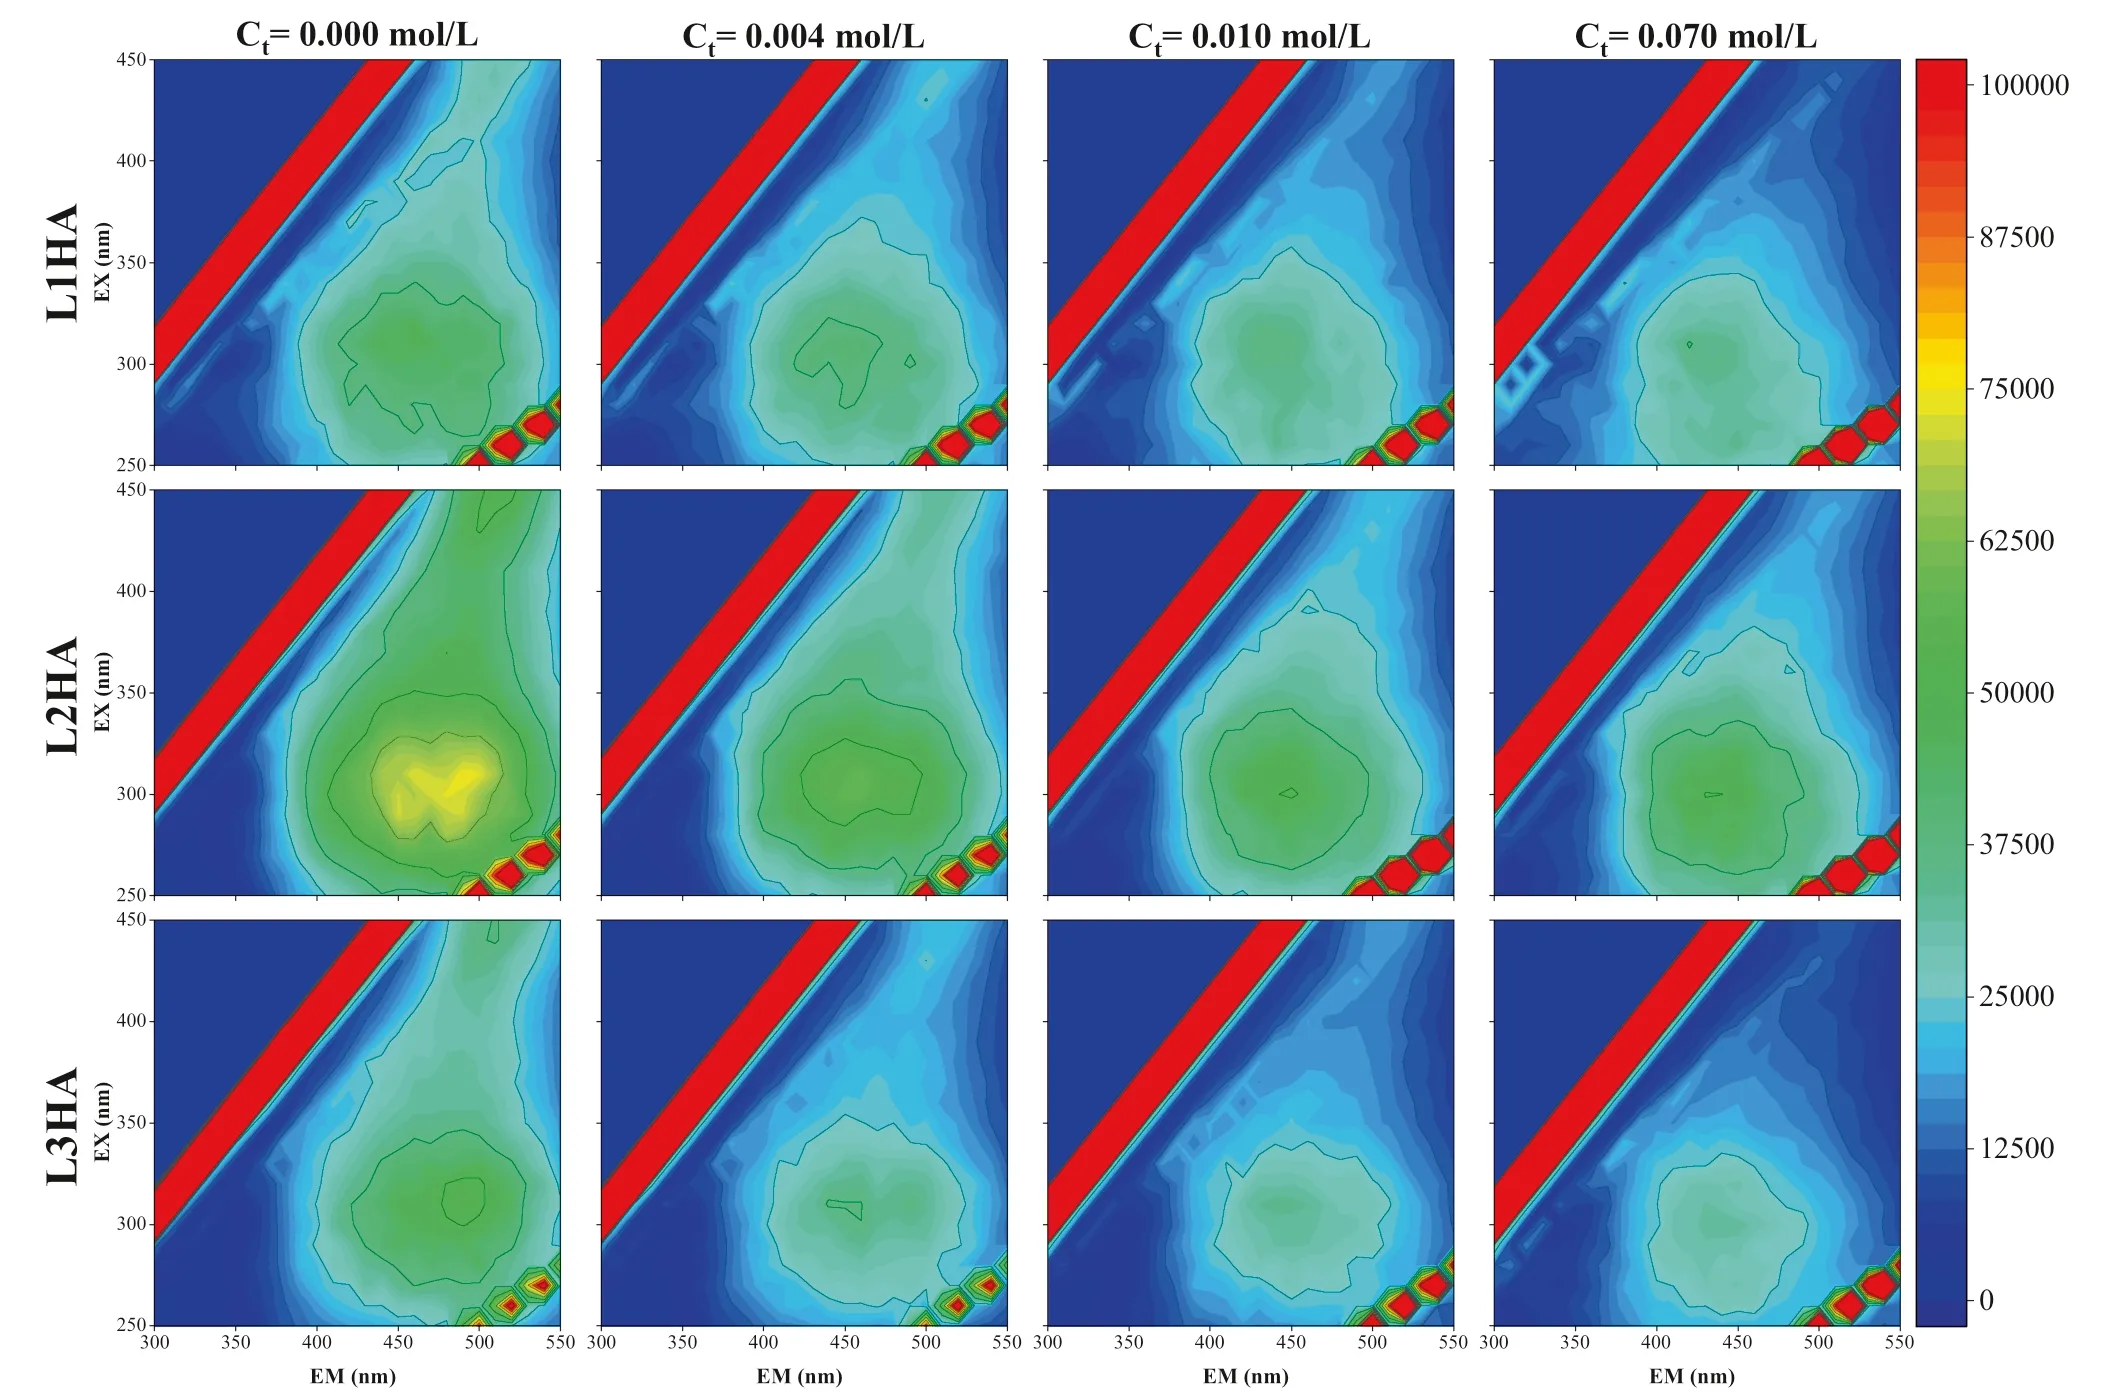
The EEM f luorescence spectrum was often used to investigate the structure and composition of HA.In this study,we focused on changes of f luorescence signals in the EEM spectra along with the continuous adding of Ca.Additionally,a series of f luorescence peaks of HA could be identif ied from the EEM spectrum(Senesi 1990;Coble 1996;Chen et al.2003).The distribution of different types of f luorescence peaks as illustrated in Fig.3 and summarized in Table 3.The f luorescence peaks in regions A and C are mainly related to carboxyl and carbonyl structures in natural organic matters(Wu and Tanoue 2001).The f luorescence peaks in region E are related to the SOM fraction with low molecular weight and high f luorescence effect(Wu et al.2003).The f luorescence peaks in region B are related to two kinds of protein-like structures in natural organic matters(Wu et al.2003).The EEM spectra of three HA samples at different total Caconcentrations were shown in Fig.4.

Fig.3 The zone division of different types of f luorescence peak of the typical HA in the EEM spectrum.Note:A is the UV fulvic-like f luorescence peaks zone,B is the protein-like f luorescence peaks zone,C is the visible fulvic-like f luorescence peaks zone,E is the humic-like f luorescence peaks zone
3 Results
3.1 Potentiometric titration
The potentiometric titration data of Cain three HA solutions(L1HA,L2HA,and L3HA)and their f it curves by Freundlich,Langmuir,Langmuir—Freundlich,and Toth models were plotted in Fig.1 and f it parameters were listed in Table 4.It can be seen from Fig.1 and Table 4 that the L3HA sample from the bottom layer of the limestone soil prof ile showed the lowest ability in taking Cafrom the solution,while the L2HA sample from the middle layer showed the highest ability.The results implied that adsorption most likely is the major mechanism that underlies the binding of Caand HA samples in the solutions since all three sets of titration data could be f it well by the classic Freundlich and Langmuir sorption models.Table 4 list the f it parameters of Freundlich,Langmuir,Langmuir—Freundlich,and Toth models.TheK
of the Freundlich model andQ
of the other three models were closely related to sorption capacity,the f itK
values showed an order of L2HA>L1HA>L3HA,theK
of L2HA was about 18,320 while that of L3HA was about 2478,the f it LangmuirQ
values showed the same trend of L2HA>L1HA>L3HA.In terms of the Langmuir—Freundlich model and the Toth model,they f it well for L3HA,acceptably for L2HA,and inferiorly for L1HA,indicating that these two models are not suitable to depict observations for all three HA samples.Moreover,the Tekim model failed completely(data not showed).All the same,the L3HA sample showed the lowestQ
values of Langmuir—Freundlich and Toth models.Then
value from the Freundlich model f itting was the lowest(0.475)for L3HA and the highest(0.865)for L2HA,which might suggest that the L3HA sample has the highest heterogeneous binding sites for Cawhile the L2HA sample has the lowest.Theb
value from the Langmuir model f itting was the highest(50.271)for L3HA,the lowest(6.242)for L2HA,and medium(15.407)for L1HA.The reverse variation trends ofQ
andb
values among the three HA samples indicated that the intrinsic sorption mechanisms of Caon HA samples might be different from each other.After the titration experiments,there were nonnegligible pH decrements in all three HA solutions,the pH of the solution decreased by 0.09,0.10,and 0.07,respectively,for L1HA,L2HA,and L3HA.We believed these pH changes were signif icant and meaningful,because,on the one hand,these pH decrements should not derive from changes in the solution’s ionic strength,which was controlled to be constant by 0.1 mol/L NaCl,and on the other hand,the high precise pH electrode of the titrator(Mettler Toledo T50)had an accuracy of±0.01,which is much smaller than observed pH decrements and such ensured that the measured pH decrements were not random errors.The pH decrements in titration experiments were consistent with Casorption capacities in three HA samples,the higher is the sorption capacity the larger is the pH decrement,suggesting that Caion may likely displace Hion from the HA samples.This is consistent with the acidic functional group contents estimated from theC-NMR spectra in three HA samples(Table 2)and the amounts of Cathey have bound in the titration experiment.The pH changes verif ied that carboxyl and phenolic functional groups of HA are the main reaction sites for Ca,where Caion competes with Hion and eventually replace Hto form Ca—HA complex.Therefore,we believed that the complex reaction is also crucial for the interaction of Caand HA.
3.2 UV-visible spectroscopy
The variations of UV—Vis spectra as increasing of the total Cacontent in HA solutions were numerically illustrated by plotting E/E,E/E,andΔlogK
versus the Caconcentration in Fig.2.The L1HA sample extracted from the upper layer of the limestone soil prof ile showed the least initial E/Eratio among three HA samples and its E/Eratio decreased continuously as the Cacontent in the solution was increased,implying that L1HA has the largest apparent molecular weight and becomes even bigger in the reaction with Ca.The E/Evariations of L2HA and L3HA showed a similar pattern,their E/Eratios increased as the increasing of the Caconcentration in the low concentration range(<0.010 mol/L)and then became decreasing when the concentration of Cawas higher than 0.015 mol/L,indicating that different concentrations of Camay have different effects on the apparent molecular weight of L2HA and L3HA.The E/Eratio and the ΔlogK
value are also empirical proxies for complexity,condensation,aromaticity,and molecular size of SOM(Peuravuori and Pihlaja 1997;Giovanela et al.2010;Enev et al.2018).Generally,their values were decreased by the Catitration,implying that the apparent molecular structure of HA samples became more complex in the interaction with Ca.However,their variation trends for three HA samples were not always consistent,indicating the multiplicity of their roles and the distinct characteristics of the HA samples.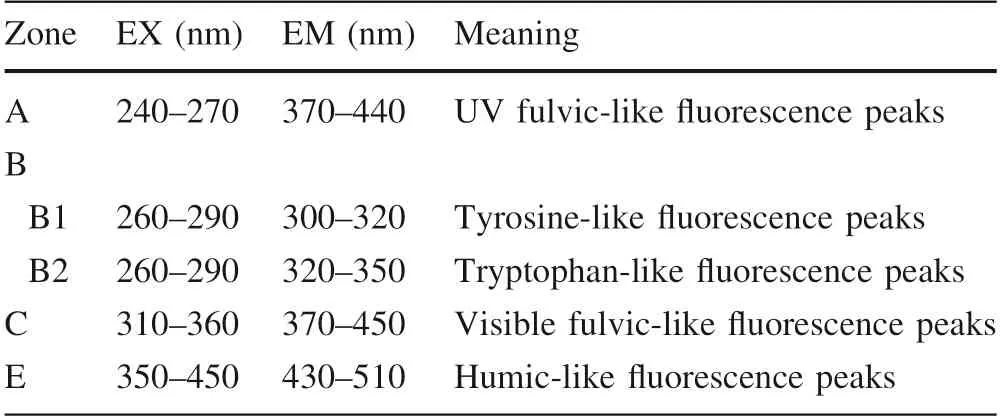
Zone EX(nm)EM(nm)Meaning A 240—270 370—440 UV fulvic-like f luorescence peaks B B1 260—290 300—320 Tyrosine-like f luorescence peaks B2 260—290 320—350 Tryptophan-like f luorescence peaks C 310—360 370—450 Visible fulvic-like f luorescence peaks E 350—450 430—510 Humic-like f luorescence peaks
3.3 Fluorescence spectroscopy
The EEM spectra of three HA samples and their variations under different total Caconcentrations were visibly different(Fig.4).In general,the EEM spectra of all three HA samples shifted gradually but signif icantly when the concentration of Caincreased from low to high,among them,the L2HA spectra showed the strongest peak intensity and the broadest peak area.It is visible in Fig.4 that when the concentration of Caincreased,the intensities of the humic-like f luorescence peaks(peak E)of all HA samples were abated,indicating that components of large molecular size and high f luorescence functional group content decreased when the concentration of Caincreased.However,changes in the fulvic-like peaks(Peak A&C)and protein-like f luorescence peaks(Peak B)were barely distinguished.For better comparison,we picked out the peak intensity values from the four different zones,visible fulvic-like f luorescence peak zone(I,peak C),UV fulvic-like f luorescence peak zone(II,peak A),tryptophanlike f luorescence peak zone(III,peak B2)and tyrosine-like f luorescence peak zone(IV,peak B1)of EEM spectra(Fig.4)and plotted them against the concentration of Cain Fig.5.It can be seen that the intensity of the fulvic-like f luorescence peaks(I)decreased sharply when the total concentration of Cawas below 0.01 mol/L,especially L2HA,then became relatively constant when the total concentration of Cawas higher than 0.03 mol/L.The intensities of both visible fulvic-like f luorescence peaks(I)and UV fulvic-like f luorescence peaks(II)showed an order of L2HA>L1HA>L3HA,which is consistent with the trend of their total contents of carboxyl and phenolic groups(Table 2),again indicating that Cainteracted mainly with carboxyl and phenolic groups of HA.The peak intensities of protein-like f luorescence peaks(III&IV)of all three HA samples increased as Caadding while L1HA showed the highest peak intensities.The protein-like structures of HA will not increase by adding Ca,the increment of protein-like f luorescence peaks intensities most likely resulted from more exposure or aggregation of scattered protein-like structures in HA samples,implying the modif ication effects of Caon the structural conf iguration of HA samples in the solution.

Fig.5 The change of the fulvic-like and protein-like f luorescence peaks in HA samples with Ca2+concentration increasing.Note:I stands for the change of the visible fulvic-like f luorescence peaks(peak C),II the change of the UV fulvic-like f luorescence peaks(peak A),III the change of the tryptophan-like f luorescence peaks(peak B2),IV the change of the tyrosinelike f luorescence peaks(peak B1)
4 Discussion
Studies on the karst rocky desertif ication in the southwest karst region of China had noticed that limestone soils in this region often have higher SOM contents than adjacent other soils(Wang et al.2004;Ma et al.2016).However,it was also often reported that the limestone soil region suffered more severe rocky desertif ication than adjacent regions of other soils when the overlying vegetation was spoiled(Zheng and Wang 2002;Di et al.2019),which is quite disaccorded with the high SOM content in limestone soils since SOM is commonly considered as the binder of soil particles to resist soil erosion.Meanwhile,it was reported that SOM and metallic ions can form stable humic-metal complexes in soil(Lopez-Sangil and Rovira 2013;Bimu¨ller et al.2016).We speculated that the high calcium content in the limestone soil may play an essential role in the behaviors of limestone soils during the karst rocky desertif ication.

Sample Initial pH End pH Freundlich model Langmuir model n K F(mol/kg)/(mol/L)n R2 Q m(mol/L) b(l/kg) R2 L1HA 6.27 6.18 0.701±0.009 9403.785±267.049 0.990 2615.535±80.832 15.407±0.745 0.988 L2HA 6.26 6.16 0.865±0.005 18,320.248±343.107 0.997 5656.350±199.391 6.242±0.266 0.998 L3HA 6.30 6.23 0.475±0.011 2478.597±96.581 0.960 813.706±12.364 50.271±1.978 0.979 Langmuir—Freundlich model Toth model Q m(mol/L) b(L/mol) n R2 Q m(mol/L) b(L/mol) n R2 L1HA 7634.363±3264.844 2.150±1.615 0.777±0.038 0.990 183,034.109±500,333.016 0.808±1.566 0.217±0.107 0.990 L2HA 6560.741±1063.354 5.020±1.177 0.978±0.022 0.998 5506.663±1968.288 6.446±2.122 1.000±0.191 0.998 L3HA 832.663±39.313 47.757±5.189 0.973±0.050 0.979 818.392±55.397 50.371±2.277 0.990±0.115 0.978
This study found that the combination of Ca2+with HA molecules in the aqueous solution is a combination process of complexation and adsorption.The adsorption dominated the overall distribution of Ca2+between solution and HA phases.This conclusion can be told by sorption model fittings results,where the two classic sorption models,Langmuir model,and Freundlich model,f it the titration data much better compared to Langmuir—Freundlich and Toth models,further the chemical sorption related Tekim model failed completely in f itting.It is reasonable to postulate that the main driving force for Cato combine with HA samples is the electrostatic attraction,hereby we believed that the combination of Ca—HA in limestone soils should not be as stable as the Ca—HA complexes mentioned in literatures(von Lu¨tzow et al.2006;Liu 2009).The following real-time UV—Vis and EEM spectra showed that the combining with Cadid modify the molecular conf iguration of HA,as shown in Fig.2,the overall decreasing trends of E/E,E/E,andΔlogK
were found for all HA samples,indicating that when the concentration of Cain solution was high enough,the apparent molecular weight,size,and complexity of all HA samples in the solution increased uniformly,and,consequently,geochemical behaviors of HA were different.Although the interaction of HA and Cafound in this study was dominated by adsorption,complexation of HA and Cacan be distinguished in the low concentration range of Ca(<0.01 mol/L),which is consistent with the prior report(Srivastava et al.2006).This was supported by the variations of E/E,E/E,andΔlogK
showed in Fig.2,their values increased(except L1HA)in the initial titration stage showing that the apparent molecular weight,size,and complexity of HA were reduced by complexing with Ca.According to the Pearson theory(Pearson 1968),Cais a hard acid and oxygen-containing functional groups,such as carboxyl and phenolic functional groups,in HA are a series of the hard base,such Cashould be bound well with carboxyl and phenolic functional groups in HA.The titration results showed that L2HA had the highest Cabinding capacity,slightly higher than that of L1HA,and much higher than that of L3HA,and this trend is consistent with the contents of carboxyl and phenolic functional groups in three HA samples.Therefore,this study suggested that the carboxyl and phenolic functional groups in HA are the primary binding sites for Ca.This conclusion was also supported by the observed pH decrements in the titration experiments and was consistent with prior conclusions that Camainly interacts with carboxyl groups of HA(Peterson 1948;Leenheer et al.1995).Nonetheless,the exact amount of Cacomplexed with HA cannot be estimated practically due to the indef inite buffer capacity of HA under experimental conditions of the present study.Previous studies reported metal ions,such as Cu,Pb,Fe,Feand Al,complexed with HA and clay in soils forming inner-sphere or outer-sphere complexes(Peterson 1948;Senesi et al.1992;Ro¨mer et al.1998;Begum et al.2018)or behaved as bridges to connect parted SOM fragments(Kloster et al.2013)and by such retarded the degradation rate of SOM(Gerke 2010).Likewise,Cawas proposed to bridge linking or f locculating small humic molecules and forming humic supramolecular structures in soils(Piccolo 2002),other studies suggested that Cacould reduce the surface potential and electric f ield intensity of soil humic acids and lead to their aggregation and f locculation(Tian et al.2020).The present study evaluated the interaction of Caand HA and investigated the effects of the Ca—HA combination to apparent molecular size,structure,and other physicochemical properties of three HA samples obtained from limestone soils of the southwest karst region of China.The results showed that the overall interactions of Cawith three HA samples were predominated by adsorption,implying that the stability of the Ca—HA combination should be lower than that of those of Fe-HA and Al-HA,which is consistent with prior f indings,HA formed inner sphere-type complexes with clay bridged by Feand Al(Hemingway et al.2019)but formed outer sphere-type complexes or humic supramolecules with clay bridged by Ca(Kalbitz and Kaiser 2008).However,the distinctive difference between the titration curve of L3HA and those of L1HA and L2HA may suggest that binding reactions of Cato HA are related to acidic functional group’s distribution and the spatial conf igurations of HA.
The observed overall changes of E/E,E/E,ΔlogK
values and EEM spectra of three HA samples indicated that the molecular space conf iguration of the HA samples became bigger and more complex and that some dispersive functional groups,like amino acid-like groups,were concentrated during the titration process.Furthermore,variations of these proxies(E/E,E/E,andΔlogK
)at different concentration levels of Cafor different HA samples were not always coincident,implying that manifold interaction mechanisms and properties of HA samples have comprehensive inf luences on the characteristics and behaviors of Ca—HA aggregates.Given Cais a relatively easily lost element of soil and whose content in the soil will decrease quickly in the long-term cultivation unless been complexed by SOM(Bubier et al.2011;Meng et al.2016;Moore et al.2019),together with the f inding of relatively low stability of HA-Ca could explain the common phenomenon in the southwest karst region of China that limestone soils with high TOC content degraded much faster than adjacent other soils when native vegetation covers were spoiled.When the limestone soil was exposed directly to the rain or runoff water erosion and the Casupplement from vegetation litters was stopped,Cain the humic-Ca structure would be washed out and humic materials once being protected by humic-Ca structure would become vulnerable to being washed away and many kinds of biochemical degradation.5 Conclusion
The present study employed a joint experimental platform of a potentiometric titration,a UV—Vis spectroscopy,and a f luorescence spectroscopy and developed a sequential realtime monitoring method to investigate the interactions of Caand HA in the aqueous solution of the constant ion strength and the changes of apparent molecular characteristics of the HA samples in the interaction.The titration data indicated that the interaction of HA and Cawas a combined process of complexation and adsorption in the experimental Caconcentration range(up to 0.07 mol/L),and that adsorption was the dominated process,the overall distribution of Cabetween solution and HA f it well with classic adsorption models,Langmuir and Freundlich models,but not the chemical sorption related Temkin model.The complexation interaction of Caand HA could be distinguished only when the concentration of Cawas low(less than 0.01 mol/L).The interaction of Caand HA showed remarkable inf luences on physicochemical properties of HA,the apparent molecular size,structure,and complexity of HA increased as more Caions were bound,and such the refractory of HA to biochemical degradations and runoff erosions was increased.The high Cacontent is propitious to the SOM preservation in limestone soils and this could be accounted for the relatively high SOM content in limestone soils of the southwest karst region of China.However,the stability of the Ca—HA combination should be lower compared to complexes of HA with other bivalence metal ions,like Cuand Pb,therefore Caion might be ready to dissociate from Ca—HA under strong erosions.In summary,we believed that the interaction of Cawith SOM is vital to maintain the high SOM content in limestone soils of the study area,but the binding force of the Ca-SOM combination is not very strong,when the limestone soil received strong artif icial disturbances,such as destroying of vegetation or cultivation,the combination of Ca and SOM will be spoiled by runoff water leaching and hence SOM in the limestone soil will become vulnerable to runoff erosions and biochemical degradations,eventually aggravate the karst rocky desertif ication.The present study investigated only the interaction of Caand HA,the comprehensive and systematic understandings of Cainteracting with different SOM components in limestone soils are much needed to prevent karst rocky desertif ication and restore the ecological environment of karst rocky desertif ication sites.
Acknowledgement
s This research was supported by the National Natural Science Foundation of China (U1701241,U1612441,41773147,and 41273149)and the Science Foundation of Guizhou(20113109).- Acta Geochimica的其它文章
- Validating the deep time carbonate carbon isotope records:effect of benthic f lux on seaf loor carbonate
- Petrology and geochemical framework of dolerites dykes of Temte´,North Cameroon,Central Africa
- Trace and rare earth element geochemistry of the black and grey shales of the Calabar Flank,Southeastern Nigeria:constraints on the depositional environment and the degree of metal enrichment
- Geochronological and geochemical comparison of Precambrian meta-maf ic volcanics in Zhongtiaoshan and Lu¨liangshan Regions in Shanxi,North China Craton
- Mineralogy and geochemistry of sands of the lower course of the Sanaga River,Cameroon:implications for weathering,provenance,and tectonic setting
- Episodic crustal growth and reworking at the southeastern margin of the North China Craton:evidence from zircon U-Pb and Lu-Hf isotopes of Archean tonalite-trondhjemite-granodiorite gneisses in the Bengbu-Wuhe area

