Aperture-averaged scintillation index and fade statistics in weak oceanic turbulence∗
Hao Wang(王昊) Fu-Zeng Kang(康福增) Xuan Wang(王瑄)Wei Zhao(赵卫) and Shu-Wei Sun(孙枢为)
1State Key Laboratory of Transient Optics and Photonics,Xi’an Institute of Optics and Precision Mechanics,Chinese Academy of Sciences,Xi’an 710119,China
2University of Chinese Academy of Sciences,Beijing 100049,China
3Beijing National Laboratory for Condensed Matter Physics,Institute of Physics,Chinese Academy of Sciences,Beijing 100190,China
4Songshan Lake Materials Laboratory,Dongguan 523808,China
Keywords: underwater optical communication(UOC),aperture-averaged scintillation index,fade statistics
1. Introduction
Underwater optical communication(UOC)has gained increasing attention in recent years for the increasing demand of military applications.[1–3]It has obvious advantage over the underwater acoustic communication in many aspects,etc.,large data capacity, and low-time delay in short to medium distance. However,propagation of a laser beam used in UOC is seriously limited by oceanic turbulence,causing the degradation of UOC performance. To tackle this issue, Nikishov and Nikishov firstly proposed an oceanic turbulence spectrum, providing a foundation for further analysis of oceanic turbulence.[4]Since then,there have been some studies on“the aperture-averaged scintillation index”(SI)and performance of UOC in oceanic turbulence based on Nikishov’s spectrum.For example, Korotkova presented numerical simulation of SI of both plane and spherical waves in weak oceanic turbulence.[5]Wanget al.[6]gave an analytical expression of SI by geometrical optics approximation. Yiet al.[7,8]also analyzed SI of both plane and spherical waves in weak oceanic turbulence and showed that using large-aperture receiver can remarkably decrease SI and consequently improve the system performance significantly. Recently,Gokce and Baykal[9,10]systematically studied how the aperture’s size of the receiver affects SI in strong oceanic turbulence.
Although much progress has been made in this field,the validity of them in real situation is strongly restricted by Nikishov’s spectrum,which is over-simplified in describing turbulence in several aspects. For example,it assumes that seawater has a stable stratification,that is,the larger the density is,the lower it lies,so that the eddy diffusivity ratio is equal to unity.However, because the surface water is affected by winds and heat exchanges with atmosphere, it is usually neither stable nor layered. Especially at medium and high latitude on earth,the density stratification is reduced or even disappeared.[11]Awareness of such a problem in Nikishov’s spectrum, Yueet al.[12]proposed a modified power spectrum model,which took the instability of stratification into account. Furthermore,their spectrum considered the outer scale of the turbulence as a variable rather than setting it to be infinite. Based on this new model,they investigated how laser beam wanders in weak turbulence. Their results are very different from those using Nikishov’s spectrum. They also showed that the wander of a laser beam with Gaussian intensity profile is significantly reduced by decreasing the outer scale of turbulence. It seems promising that Yue’s spectrum can bring new insight to the theoretical studies of UOC systems. However,to our knowledge,no such research of UOC systems by applying Yue’s spectrum is available yet.
In this study, we present an improved model of a UOC system in weak oceanic turbulence based on Yue’s spectrum.[12]We derive the analytic expressions of SI in weak oceanic turbulence and carry out a numerical simulation. It is found that spherical wave is preferable in the UOC system in weak turbulence compared to plane wave,and the apertureaveraged effect has a significant impact on UOC system’s performance. We further discuss some typical fade statistics of the UOC system including the probability of fade, the expected number of fades per time and the mean fade time,signal-to-noise ratio(SNR)and bit error rate(BER),according to the numerical simulation. Particularly,the eddy diffusivity ratio and the outer scale of the turbulence are considered[11]in our model and their effect on SI is discussed.
2. Theory
2.1. The oceanic turbulence power spectrum with the eddy diffusivity ratio and the outer scale
Let us firstly briefly introduce Yue’s spectrum used in our model. In 2019,Yueet al.[12]presented an oceanic turbulence power spectrumΦn(κ),which includes the temperature spectrumΦT(κ), the salinity spectrumΦS(κ), and the coupling spectrumΦTS(κ). The power spectrum of oceanic turbulence is expressed as
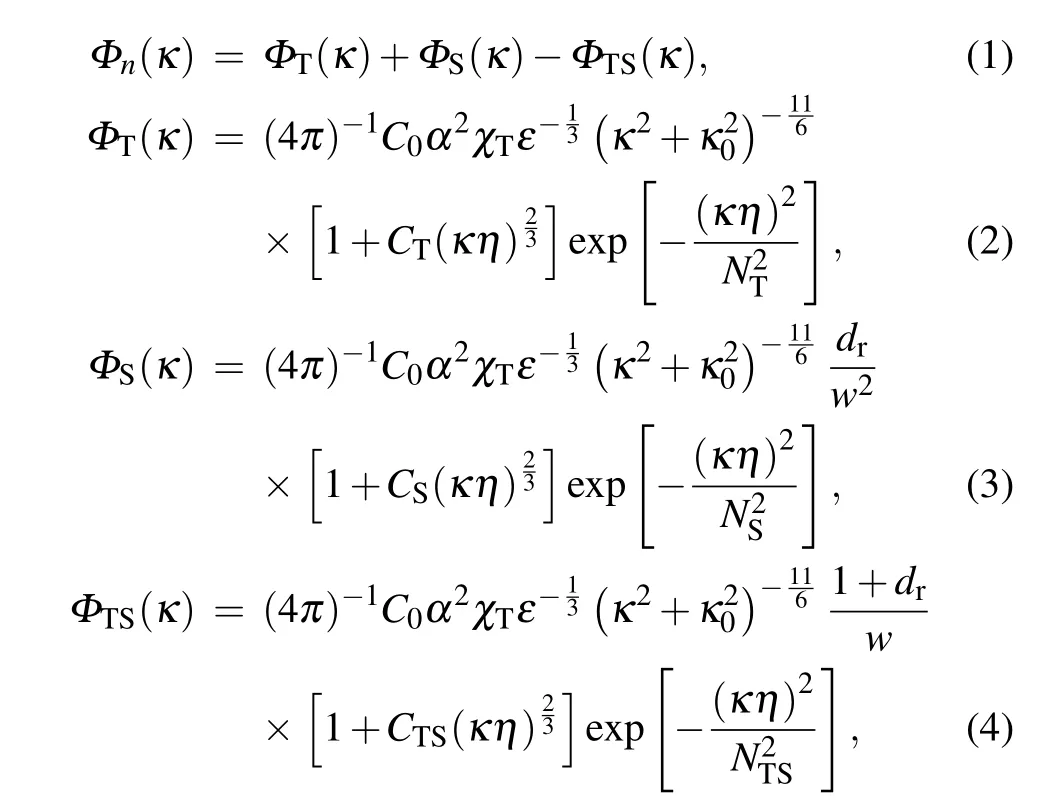
whereκis the magnitude of the spatial frequency;αis the thermal expansion coefficient,which is related to the temperature and salinity of the marine environment;κ0=2π/L0(L0is the outer scale of turbulence);εis the dissipation rate of turbulent kinetic energy per unit mass of fluid in the range from 10−1m2/s3to 10−10m2/s3.C0is a constant equal to 0.72.In Eqs. (2)–(4),ηis Kolmogorov microscale length (inner scale);χTis the dissipation rate of mean-squared temperature,varying from 10−4K2/s to 10−10K2/s;wis a dimensionless parameter providing the ratio between temperature and salinity that contributions to the refractive index spectrum ranging from−5 to 0.PT,PSandPTSare the Prandtl number of temperature,salinity,and the coupled temperature salinity,respectively,wherePTS=2PTPS/(PT+PS).Ci(i=T,S or TS)is a constant related toΦi.Niis a function of the Prandtl numberPi, governing the upper bound for the inertial-diffusive range ofΦi,which can be written as
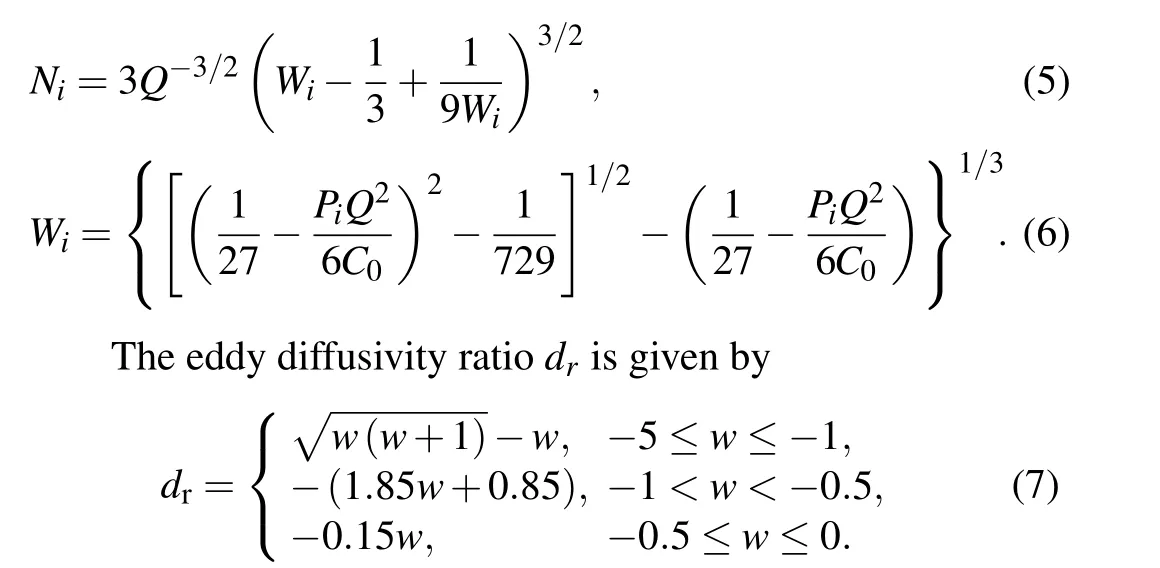
From Eq.(7),it can be seen thatdris a segmented function ofw.However,in previous studies using Nikishov’s spectrum,dris treated as unity,independent ofw.
2.2. Aperture-averaged SI and fade statistics
SI of plane and spherical waves in weak turbulence is defined as[13]
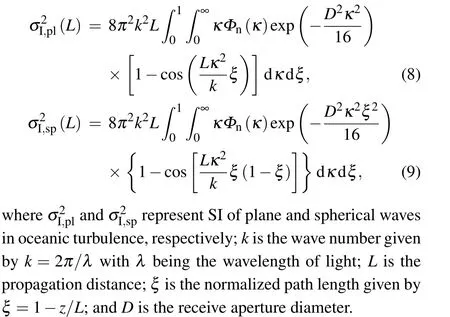
Substituting Eq.(1)into Eqs.(8)and(9),SI of plane and spherical waves can be expressed as
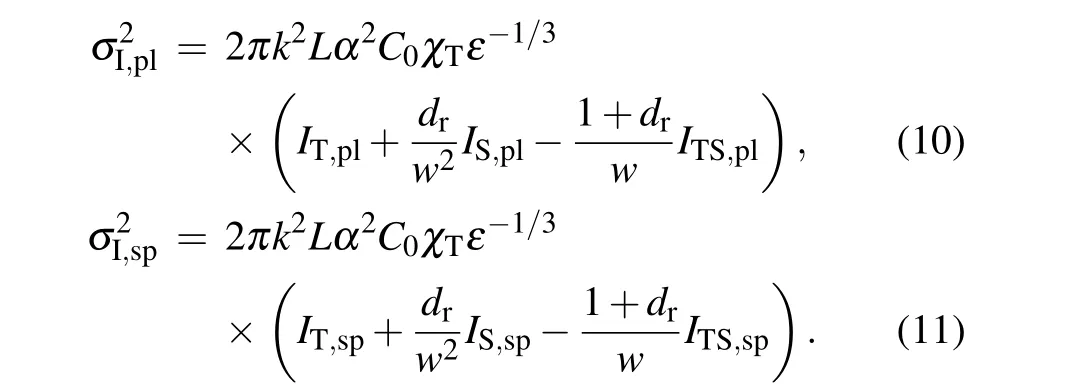
We leave the detailed calculation of SI in the Appendix.
Referring to the mathematical model for the probability density function(PDF)of the randomly fading irradiance signal,we discuss the probability of fade,the expected number of fades per time,the mean fade time below a prescribed threshold,SNR and BER.
The probability of fade can be expressed as[13]

wherej=pl or sp represents plane and spherical waves, respectively; erf(x) is the error function. The fade parameterFT, given in decibels (dB), represents the dB level below the on-axis mean irradiance.
The number of negative crossing of a prescribed threshold〈n(IT)〉characterizes the expected number of fades per time,which can be expressed as

where〈···〉represents the ensemble average andv0is the quasi-frequency.
Mean fade time〈t(IT)〉can be written as

For a shot-noise-limited system,the SNR at the output of the detector can be written as[5,7,8]

where SNR0is the SNR in the absence of turbulence.
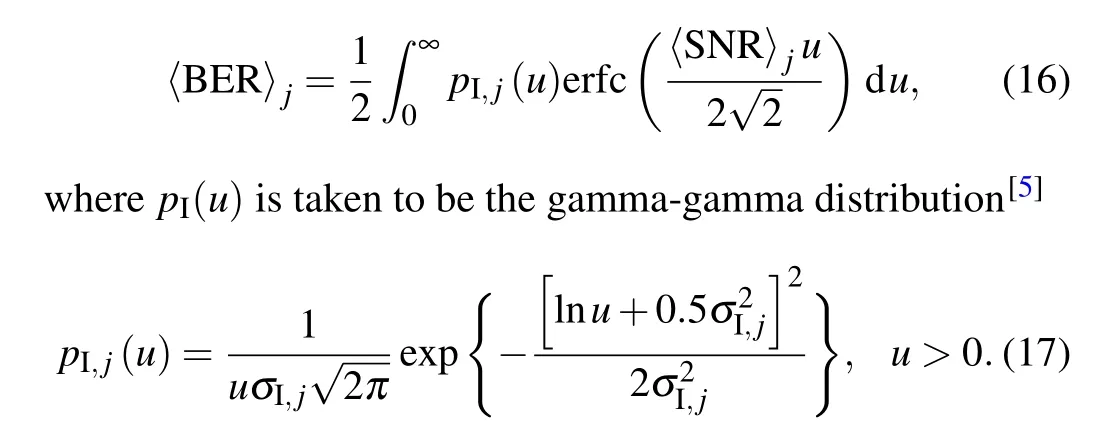
In the presence of oceanic turbulence, the probability of error is considered to be a conditional probability that must be averaged over the PDF of the random signal to determine the unconditional mean BER.In terms of a normalized signal with unit mean,it leads to the expression[5,7,8]
3. Result and discussion
In this section, we present some numerical results based on our model. All the expressions developed in the paper are restricted to weak turbulence,so we limit the SI below 1.[7]A typical marine environment is considered,in which the salinity is 35% and temperature is 20◦C,[10]α=2.56×10⁻⁴L/◦C,PT= 7,PS=700,PTS=13.86,CT= 2.18,CS= 2.22 andCTS=2.21,[10]χT=10−7K2/s,ε=10−4m2/s3. We set the wavelengthλ= 532 nm in the calculation, which is in the range of light window[14](470–580 nm)for the seawater.
Notably,although we introduce outer scaleL0in the analytical expression of SI for both plane and spherical waves in Eqs. (10) and (11),L0has negligible effect on SI (details are not shown here)similar to that in atmosphere turbulence. This justifies setting it to be infinite in previous studies.[15]

Fig. 1. SI of plane wave (a) and spherical wave (b) versus w for various receive aperture diameters. The solid lines are with dr calculated by Eq.(7),while dotted lines are with dr=1. The red solid/dotted lines represent D=0 mm,the green solid/dotted lines represent D=1 mm,the blue solid/dotted lines represent D=3 mm and the magenta lines represent D=5 mm, respectively. For all the curves, L=20 m and η =10−3 m.
Firstly, we study how SI varies according tow,ηandLone by one.Figure 1 showsσ2I,plandσ2I,spas functions ofwfor variousDin two cases (drcalculated by Eq. (7) anddr=1).D=0 mm corresponds to the point receiver. Sincedris separated into three pieces in Eq.(7),the curves ofσ2I,plandσ2I,sp(solid line)in this case can also be divided into three sections.In the first section,σ2I,plandσ2I,spinitially increase aswincreases,reaching a maximum whenwis about 1.15,and then decreases aswapproaches−1. However,the overall changes ofσ2I,plandσ2I,spare small.The second section is fromw=−1 tow=−0.5,whereσ2I,plandσ2I,spdecrease parabolically. The third section is fromw=−0.5 tow=0,whereσ2I,plandσ2I,spincrease sharply with the increase ofw. Since−5<w <−1 and−1<w <0 are dominated by temperature fluctuations and salinity fluctuations, respectively, from these curves, we may conclude that salinity fluctuations have greater impact than temperature fluctuations on oceanic turbulence.However,their influences onσ2I,plandσ2I,spare not trivial particularly in the second section. In addition,increasingDwill reduceσ2I,plandσ2I,sp, which is more noticeable when the salinity fluctuations dominate the underwater turbulence (−1<w <0). On the other hand,σ2I,plandσ2I,spwithdr=1 show different trends,namely, they monotonically increase aswincreases from−5 to 0,though from these two curves,it also seems that salinity fluctuations have greater impact than temperature fluctuations on oceanic turbulence. At a fixed receive aperture diameter,Nikishov’s spectrum underestimates turbulence strength than Yue’s spectrum with−1<w <0, while it overestimates turbulence strength with−5<w <−1.[15]In both the cases,SI of plane wave is larger than that of spherical wave indicating that spherical wave is less affected by oceanic turbulence.
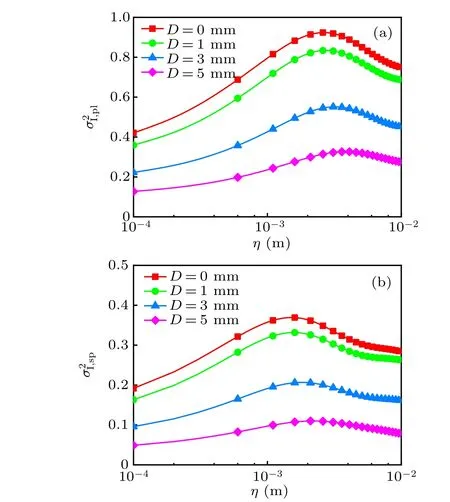
Fig.2. SI of plane wave(a)and spherical wave(b)versus Kolmogorov microscale length for various receive aperture diameters. For all the curves,L=20 m and w=−1.
Next, we showσ2I,plandσ2I,spas a function ofηat certainDin Fig. 2. For eachD,σ2I,plandσ2I,spfirst increase and then decrease with increasingη,and finally saturate at a level commonly described as the saturation regime.[5,13]The peak values ofσ2I,plandσ2I,spshould occur when the random focusing due to large-scale inhomogeneities achieves its strongest effect.[13,14]Then such a focusing effect reduces due to multiple scattering asηfurther increases. Whenηis fixed, lowerσ2I,plandσ2I,spare observed for largerD. Such a trend is most obvious whenσ2I,plandσ2I,spare around their peak values. Plane wave is quite sensitive to theη,leading to a higher value ofσ2I,plthan the correspondingσ2I,sp. This is consistent with the case of atmosphere turbulence.[6]
Figure 3 presents SI of plane and spherical wave through oceanic turbulence with respect toLfor variousD. It can be seen that for eachD,σ2I,plandσ2I,spincrease quadratically with increasingL, indicating that UOC system works well only in short to medium distance. There is a significant drop inσ2I,plandσ2I,spwhenDincreases from 0 mm to 5 mm due to the effect of aperture averaging, especially in long propagation distance, because an increase inLcauses a decrease in the receiver intensity correlation and thus the receiver aperture successfully averages all the intensity fluctuations. Given the sameLandD,σ2I,plis larger thanσ2I,sp,which means spherical wave is less affected by oceanic turbulence than plane wave.Particularly,σ2I,plwith point receiver is about 2.5 timesσ2I,sp.The result is similar to that in atmosphere turbulence.[6]
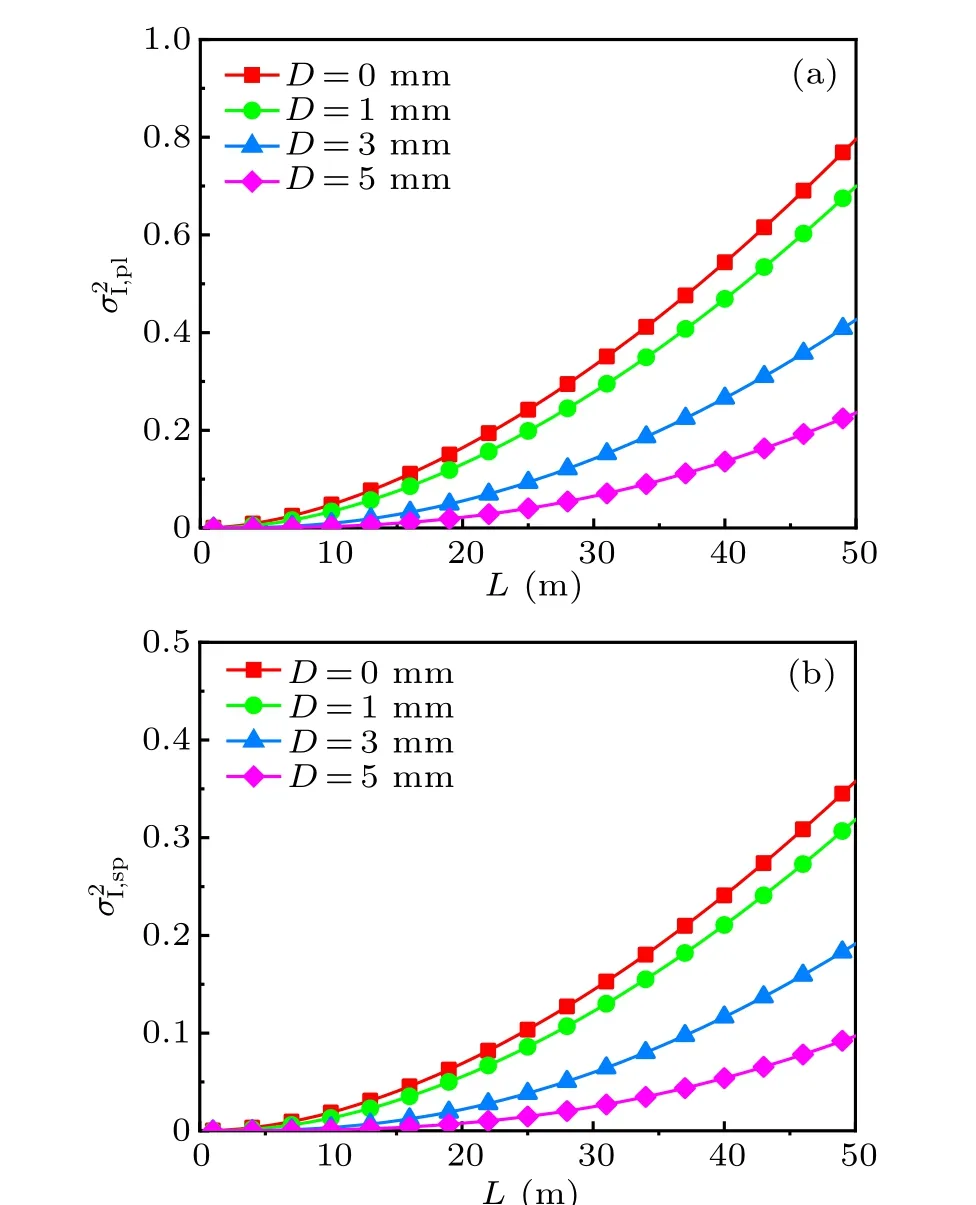
Fig.3. SI of plane wave(a)and spherical wave(b)versus propagation distance for various receive aperture diameters. For all curves,w=−1 and η =10−3 m.
In order to demonstrate the validity of our analytic method, SI of plane wave withD=0 mm at different propagation distances is simulated by Monte Carlo simulation,[5]as shown in Fig. 4 (spherical wave is difficult to simulate by Monte Carlo because its infinite beam width). Table 1 gives a comparison between the SI’s extracted from the analytic method and the Monte Carlo method. The relative error between the them is less than 10%,proving the rationality of our analytic method.
Next, performance of the UOC system is evaluated for different aperture diameters by investigating typical fade statistics includingPr(I ≤IT),〈n(IT)〉and〈t(IT)〉as functions ofFTfor variousDbased on the SI.We chooseυ0=550 Hz in our analysis for the convenience of making comparison between different conditions.[13,16,17]

Fig.4. Plane wave at 0 m(a),10 m(b),20 m(c),30 m(d),40 m(e)and 50 m(f).

Table 1.SI of plane wave at different propagation distances(SI1 is from this paper and SI2 is calculated by the Monte Carlo method).
As shown in Fig.5,Pr(I ≤IT)decreases with increasingFTandD. Particularly, increasingFTby several dB can substantially reducePr(I ≤IT) by several orders of magnitude,especially with largeD.[18]Pr(I ≤IT) of spherical wave is lower than that of plane wave under the sameFTandD. To achieve the samePr(I ≤IT)of 10−6under the sameD,FTfor spherical wave is again lower than the plane wave. These results indicate that spherical wave is better than the plane wave for UOC.
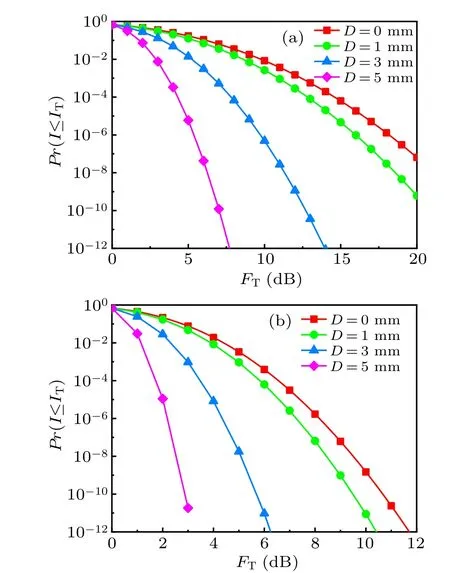
Fig. 5. Probability of fade of plane wave (a) and spherical wave (b)versus FT for various receive aperture diameters. For all the curves,L=20 m,w=−1 and η =10−3 m.
Next,the effect of receiving aperture diameter on〈n(IT)〉for plane and spherical wave is shown in Fig.6. It can be seen that〈n(IT)〉firstly reaches the peak value with increasingFT,then rapidly decreases to low level; and〈n(IT)〉of the point receiver is the smallest whenFTis set to less than 1dB. On the contrary,if anFTof more than 1dB is chosen,〈n(IT)〉decreases with increasingD. To achieve the same〈n(IT)〉, the requiredFTvalue decreases with an increase inD, consistent with the previous studies.[19–22]For example, to achieve the〈n(IT)〉of 100,FTof 4.3, 6.1, 8.1 and 9 dB are required forD=0, 1, 3 and 5 mm for plane wave, respectively, where it reduces to 2.8, 4, 5.1 and 5.5 dB, forD=0, 1, 3 and 5 mm for spherical wave, respectively. This means that under the same oceanic turbulence and system parameters,the UOC system with spherical wave has the lower requirement forFTthan that with plane wave. These results also indicate that spherical wave is better than the plane wave for UOC.
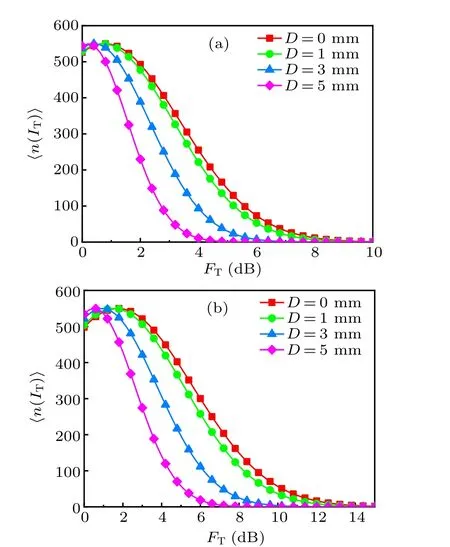
Fig.6.Expected number of fades versus FT of plane wave(a)and spherical wave (b) for various receive aperture diameters. For all curves,L=20 m,w=−1 and η =10−3 m.
Finally, we plot〈t(IT)〉againstFTwith variousDin Fig. 7. We can see that〈t(IT)〉monotonically decreases withFT. ForDless than 1 mm, increasingFThas no significant impact on〈t(IT)〉. However, whenDis larger than 3 mm,〈t(IT)〉reduces several orders of magnitude by increasingFT.To achieve a targeted〈t(IT)〉of 10−6s, theFTvalues of 4.3 and 6.9 dB are required forD=0 and 1 mm in the case of plane wave,respectively,while they reduce to 1.7 and 3.4 dB,respectively, forD= 0 and 1 mm in the case of spherical wave. If we want to achieve an acceptable〈t(IT)〉(for example, 10−6s)[23,24]atFT=5 dB,Dmust be larger than 5 mm and 3 mm for plane wave and spherical wave, respectively.This means that spherical wave for UOC can achieve the same〈t(IT)〉with less difficulty and lower cost than plane wave.These results again indicate that spherical wave is better than the plane wave for UOC.
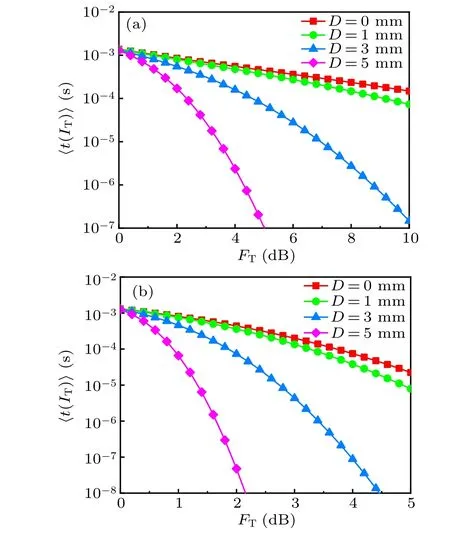
Fig. 7. Mean fade time versus of plane wave (a) and spherical wave for various receive aperture diameters. For all the curves, L=20 m,w=−1 and η =10−3 m.
In Fig. 8, we plot the SNR in dB as a function ofLfor variousD. SNR0is set as 10 dB[25]in our analysis for convenience of making comparison between different conditions.Unsurprisingly,turbulence causes a drop in SNR.[7,8]Particularly,SNR decreases with increasingLand decreasingD. Under the same oceanic condition,the SNR of spherical wave is only slightly better than that of plane wave.
Finally, numerical calculation of the BER against theLfor variousDleads to the results shown in Fig. 9. These results indicate that to achieve an acceptable level of BER(typically around 10−6)[7,8,26]with a receive diameter of 5 mm in the presence of oceanic turbulence,Lis required to be limited in 40 m for spherical wave, while it reduces to 15 m for plane wave. This means that under the same BER, spherical wave for UOC can work in longer distance than plane wave,indicating that spherical wave is better than the plane wave for UOC.
It is concluded that the performance of UOC with spherical wave is superior to that of plane wave due to the fact that lower SI leads to lower fade statistics.[27,28]We believe that our results provide a guidance for future UOC systems to choose best parameters such as propagation distance, receiving aperture diameter and fade threshold parameter to fit different ocean conditions.
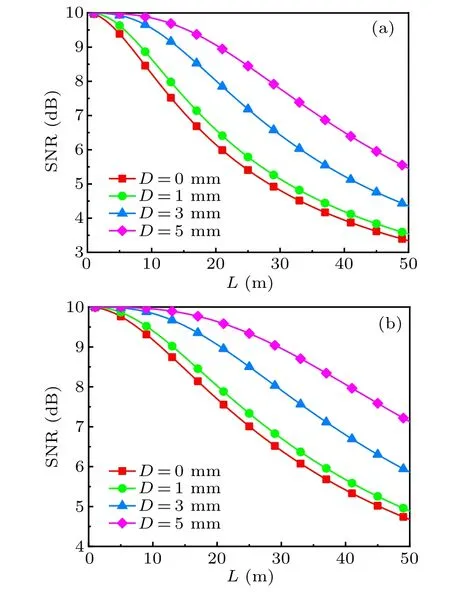
Fig.8. SNR of plane wave(a)and spherical wave(b)versus propagation distance for various receive aperture diameters. For all the curves,w=−1 and η =10−3 m.
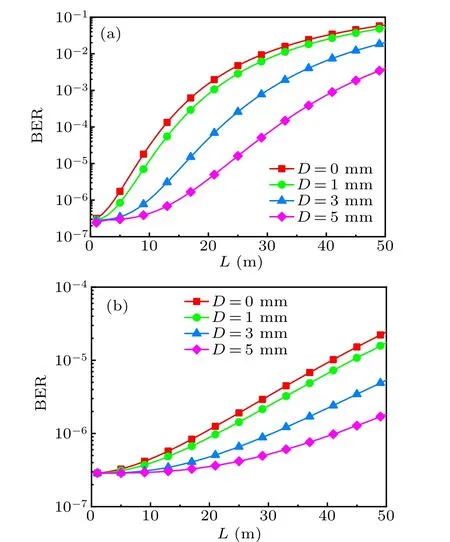
Fig.9. BER of plane wave(a)and spherical wave(b)versus propagation distance for various receive aperture diameters. For all the curves,w=−1 and η =10−3 m.
4. Conclusion and perspectives
In summary, we have adopted a spatial power spectrum model that considers the eddy diffusivity ratio and outer scale of turbulence and derived the analytical expressions of SI for plane and spherical waves based on the Rytov theory in weak turbulence.The numerical results show thatw,η,LandDplay an importance role in SI,whileL0does not. In many cases,SI based on our model is very different from that based on Nikishov’s spectrum.Based on SI,the typical fade statistics of the UOC system including thePr(I ≤IT),〈n(IT)〉,〈t(IT)〉, SNR and BER are discussed,clearly showing that the UOC system with spherical wave has advantage over that with plane wave.These results are helpful for design of UOC systems in future.
Acknowledgement
We would like to thank Professor Xiang Yi(Xidian University)and Professor Haiping Mei(Anhui Institute of Optics and Fine Mechanics)for helpful discussion and valuable suggestions.
Appendix A
Here, we would show how to calculateσ2I,plandσ2I,spin details based on Yue’s spectrum.The results are valid for weak oceanic turbulence where SI is below 1.
SI of plane wave is expressed as[13]
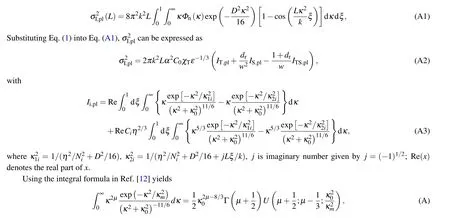
where Γ(···)represents the gamma function andU(···)represents the confluent hypergeometric function of the second kind.
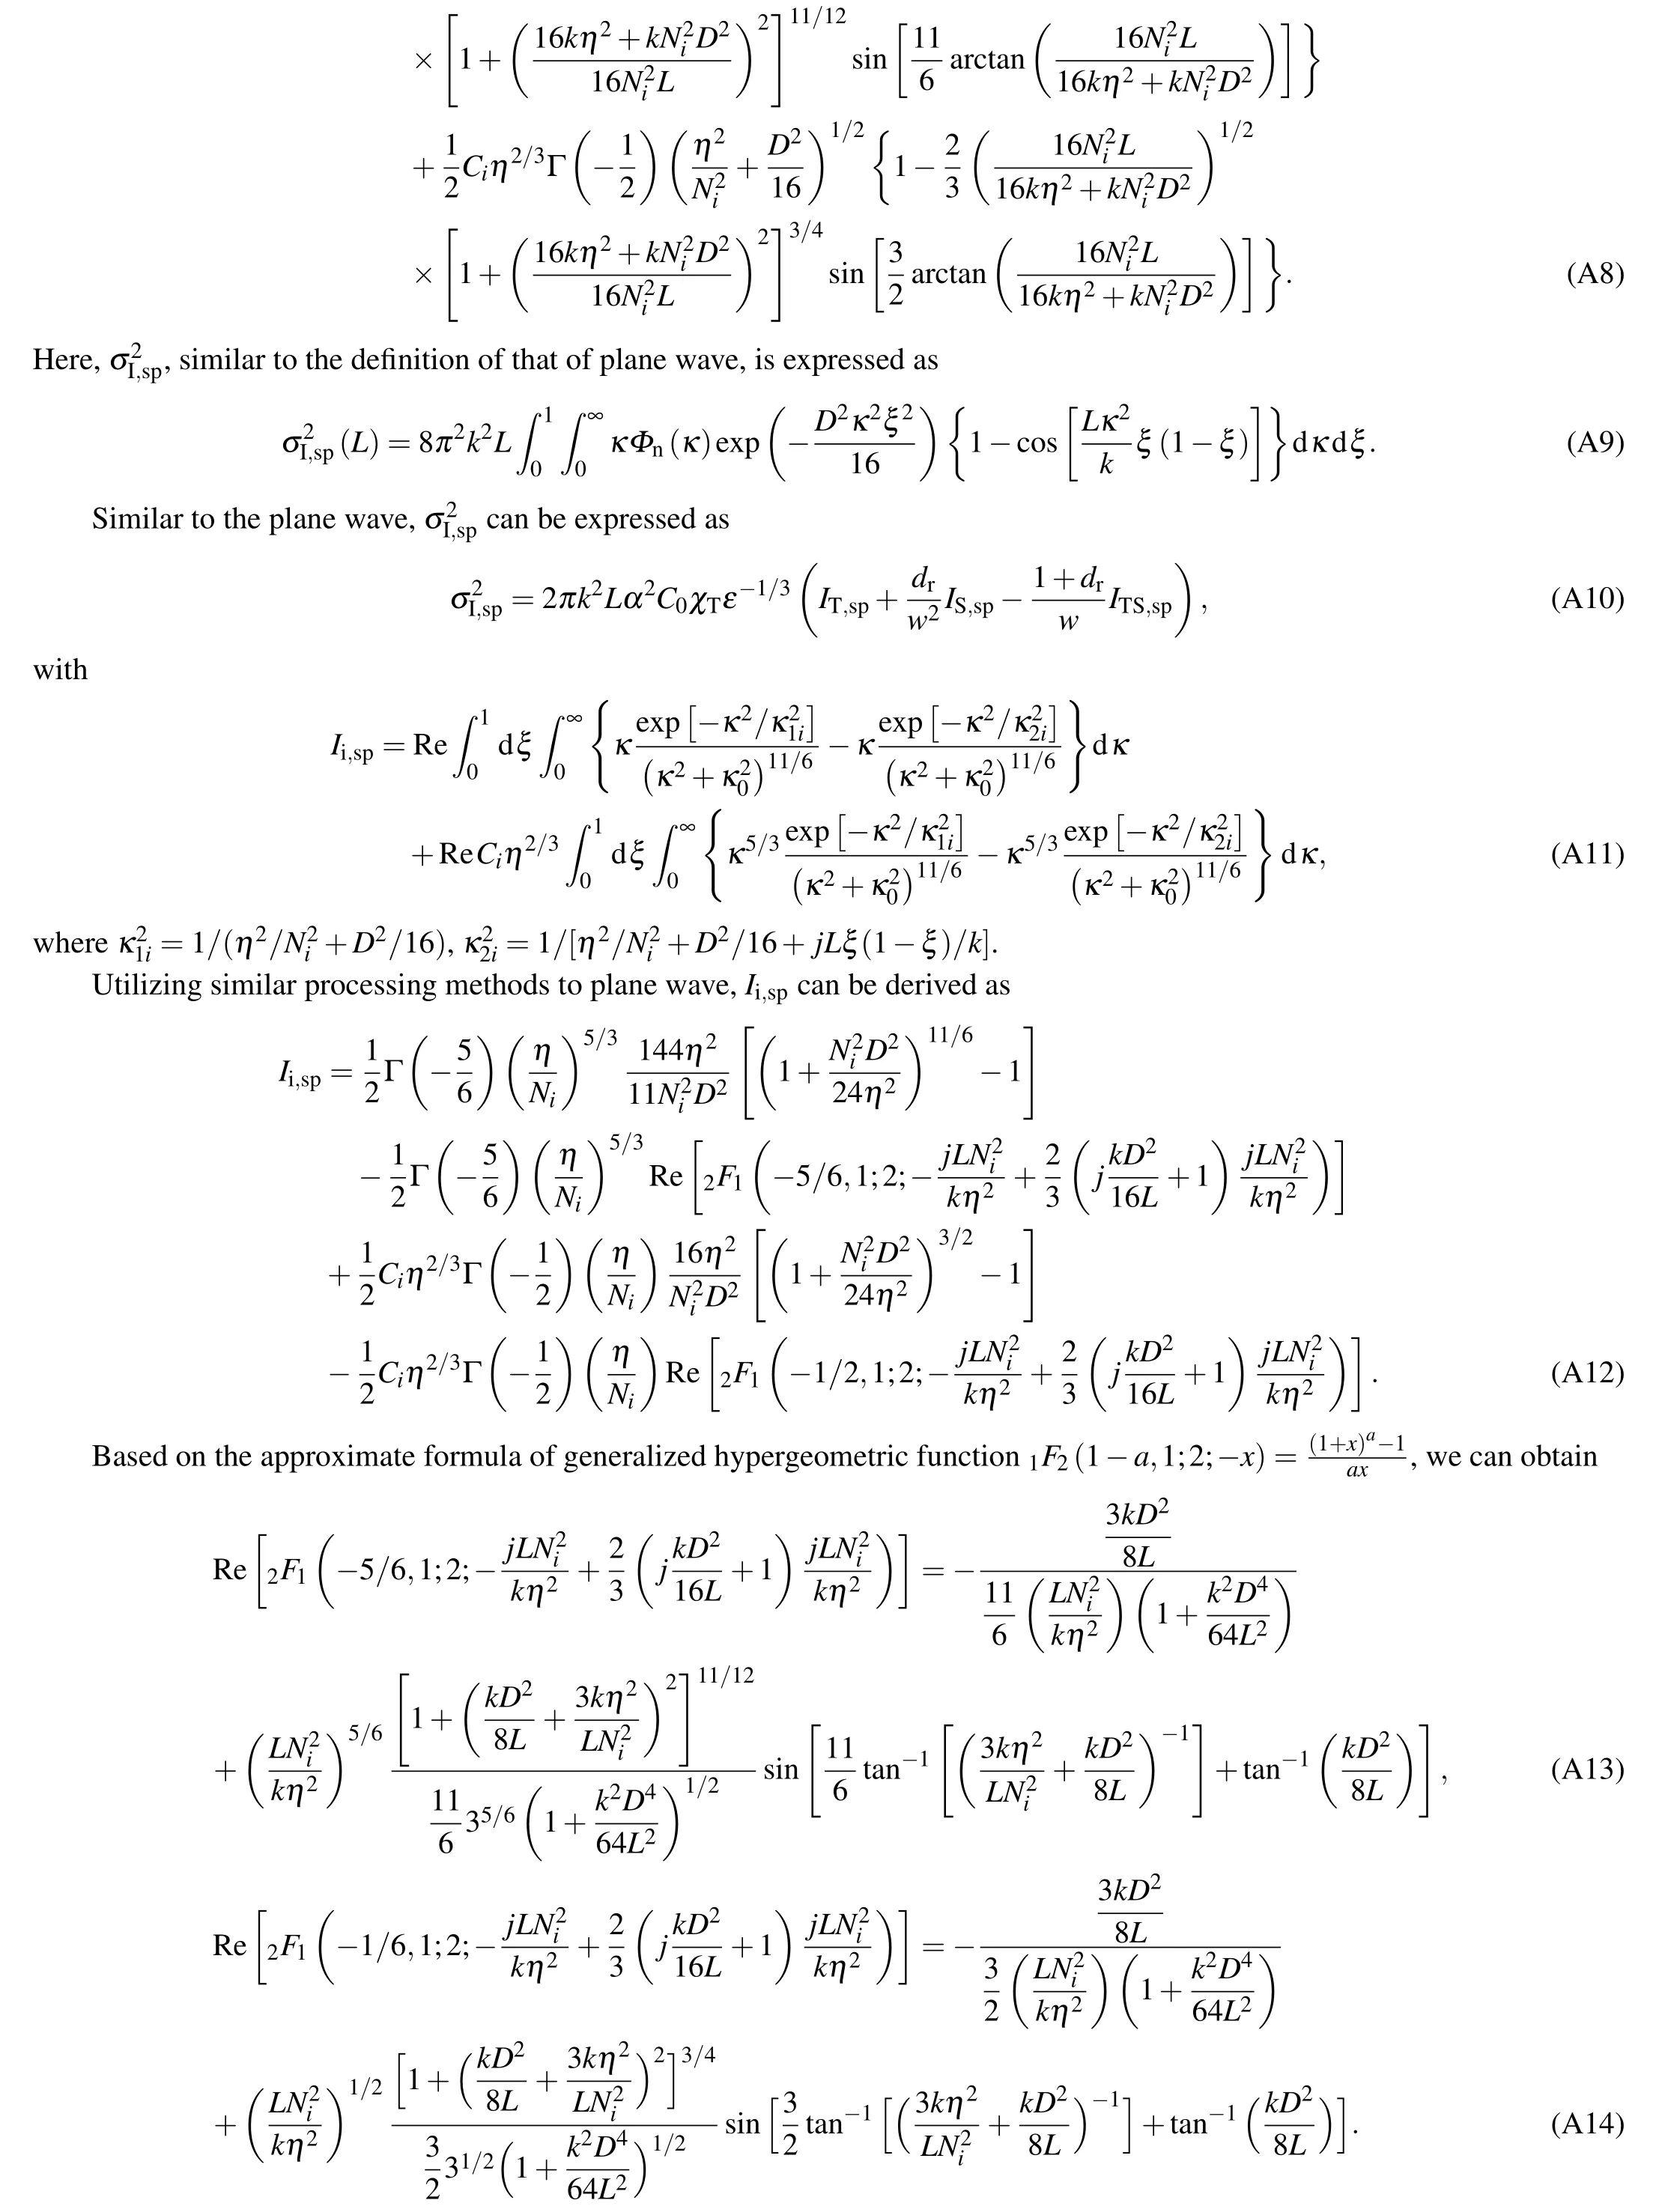
By performing the integral overκin Eq.(A3),we obtain


- Chinese Physics B的其它文章
- Quantum computation and simulation with vibrational modes of trapped ions
- ℋ∞state estimation for Markov jump neural networks with transition probabilities subject to the persistent dwell-time switching rule∗
- Effect of symmetrical frequency chirp on pair production∗
- Entanglement properties of GHZ and W superposition state and its decayed states∗
- Lie transformation on shortcut to adiabaticity in parametric driving quantum systems∗
- Controlled quantum teleportation of an unknown single-qutrit state in noisy channels with memory∗

