Transcriptomic analysis reveals the transcription factors involved in regulating the expression of EPSPS gene,which confers glyphosate resistance of goosegrass (Eleusine indica)
ZHANG Chun,YU Chao-jie,ZHANG Tai-jie,GUO Wen-lei,TIAN Xing-shan
Guangdong Provincial Key Laboratory of High Technology for Plant Protection,Institute of Plant Protection,Guangdong Academy of Agricultural Sciences,Guangzhou 510640,P.R.China
Abstract Glyphosate inhibits the enzyme 5-enolpyruvylshikimate-3-phosphate synthase (EPSPS) and overexpression of the EPSPS gene is one of the molecular mechanisms conferring glyphosate resistance in weeds. A regulatory sequence of EPSPS gene was isolated previously,and an alteration in its 5´-untranslated region (UTR) pyrimidine (Py)-rich stretch element is involved in the regulation of EPSPS expression in glyphosate-resistant (GR) Eleusine indica. However,the transcription factors involved in this regulatory sequence remain to be elucidated. In this study,we investigated the regulatory network of EPSPS overexpression associated genes in a GR E.indica population by RNA-seq. The differentially expressed transcript analyses revealed that glyphosate treatment caused an increase in the expression of 2 752 unigenes and a decrease in the expression of 4 025 unigenes in the GR E.indica,compared to the glyphosatesusceptible (GS) E.indica. Among them,1 373 unigenes were identified to be co-expressed with the EPSPS gene in GR E.indica. GO and KEGG pathway analyses showed that the up-regulated unigenes were mainly enriched in chloroplasts and associated with the shikimate biosynthesis pathway,chlorophy II and peroxisome metabolism processes. Notably,the expression of a Shikimate kinase which catalyzed the conversion of Shikimate to Shikimate 3-phosphate (S3P,a substrate of EPSPS),was also up-regulated. Eight transcription factors were identified as likely to be involved in the regulation of the EPSPS expression,and three of them (ARF2,ARF8 and BPC6) showed more binding sites because of a (CT)n insertion of the 5´-UTR Py-rich stretch element in GR. However,the yeast one-hybrid assay illustrated that ARF8 and BPC6 could bind to the 5´-UTR Py-rich stretch element of wild type EPSPS,but could not bind to the mutated form. Our data suggests that the transcriptional regulation of EPSPS expression is complex and was significantly altered in GR E.indica. These discoveries provide new references for further study of the EPSPS overexpression mechanism that endows glyphosate resistance.
Keywords:transcriptomic, EPSPS,5´-UTR Py-rich stretch element,transcription factor,glyphosate resistance
1.Introduction
Glyphosate has been used as a very effective herbicide for nearly 50 years,making a substantial contribution to world food production and it has become the world’s most widely used herbicide (Dukeet al.2018). However,widespread glyphosate application has resulted in the evolution of glyphosate-resistant (GR) weeds,and more than 51 weed species have been reported to be glyphosate resistant (Heap 2021). These resistant weeds are seriously eroding the efficacy and value of glyphosate. As the target protein of glyphosate,5-enolpyruvylshikimate-3-phosphate synthase (EPSPS),which is a major enzyme in the aromatic amino acid synthesis pathway,plays a critical role in the evolution of glyphosate resistance via either amino acid mutations or gene overexpression. Mutations at Pro-106 or/and Thr-102 of EPSPS have been identified in a number of GR weed species in the field (Baersonet al.2002;Sammons and Gaines 2014;Yuet al.2015). In addition,higher expression levels of theEPSPSgene resulting from gene amplification or transcriptional regulation is another molecular mechanism for GR,which causes plants to have sufficient EPSPS activity to maintain the shikimic acid pathway in the presence of glyphosate (Yuanet al.2002;Dinelliet al.2006;Gaineset al.2010;Wiersmaet al.2015).
Eleusine indica,is one of the world’s worst weeds. At least,13 GRE.indicapopulations have been reported in ten countries (Heap 2021). In our previous study,EPSPSoverexpression without amino acid mutation was found to be responsible for glyphosate resistance in anE.indicapopulation from southern China (Zhang Cet al.2015).Furthermore,nucleotide alterations in the upstream regulatory region of theEPSPSgene (e.g.,a 12-base tandem repeat of CTCTCTGTCTCT) were identified in the 5´-untranslated region (UTR) pyrimidine (Py)-rich stretch element of GREPSPS(Zhanget al.2018). The changes in promoter activity of theEPSPSgene and transcription factors may significantly affect the expression of theEPSPSgene (Wiersmaet al.2015). Hence,we speculated that the alteration in the 5´-UTR Py-rich stretch element ofEPSPSis responsible for glyphosate-inducedEPSPSoverexpression,thereby conferring glyphosate resistance in thisE.indicapopulation.
The 5´-UTR Py-rich stretch motif is a typical transcriptional regulatory element,which is composed of GA/CT-dinucleotide repeat DNA sequences (referred as“(CT)n”) (Vianaet al.2011). (CT)nacts as the“regulatory knobs”which regulate the downstream gene expression (Kashiet al.1997;Trifonov 2004). In yeast,the promoters with the (CT)nshowed higher transcriptional efficiency than those without the repeats (Vinceset al.2009). In plants,the (CT)nare involved in the expression and tissue localization of some specific genes (Baoet al.2002;Joshi-saha and Reddy 2015). The length of (CT)nwas positively correlated with the expression level of the tryptophan decarboxylase (tdc) gene inCatharanthus roseus(Kumar and Bhatia 2016). The (CT)nis rather common among different species and regulates gene expression. However,it is unclear how this increased length of 5´-UTR (CT)naffectsEPSPSgene expression and which transcription factors bind to the (CT)nelement.In this study,we deployed RNA-seq and yeast one-hybrid assay approaches to explore the regulatory network and key transcriptional factors that are involved in the regulation of theEPSPSgene in GRE.indica.
2.Materials and methods
2.1.Identification of plant materials used for RNAseq
The original putative GRE.indicapopulation was collected from a citrus orchard in Guangdong Province (23°48´N,114°46´E),where glyphosate was used frequently and continually (for more than 10 years). A purified subset of this population that was confirmed to be resistant to glyphosate was generated and used as the GR population in this study. A seed sample from one known glyphosate-susceptible (GS) population (22°8´N,113°44´E) was collected from a fallow field in Guangzhou City in Guangdong Province. It was used as the GS population after purification. Seeds of both biotypes were sown on wet filter paper and maintained in a chamber at 28-30°C,with a 12-h light/12-h dark photoperiod and 70% relative humidity. After germination,the seedlings were transplanted to trays (28 cm×54 cm) filled with autoclaved soil and grown outdoors during the normal growing season. At the tillering stage,eight plants were randomly selected from both GS and GRE.indicapopulations,and three tillers of each plant were separated and replanted in pots (one tiller per pot,48 pots in total). Two tillers of each plant were used for the detection ofEPSPSoverexpression and the 5´-UTR (CT)ninsertions of theEPSPSgene,while the third one was used for RNA-seq.
For analysis ofEPSPSoverexpression,one tiller perE.indicaplant was treated with 1 000 g ha-1glyphosate,another tiller from each plant without glyphosate treatment was used as the control. BecauseEPSPSexpression inE.indicaleaf sheaths is significantly higher than in the leaf (Zhang Cet al.2015),6 h after treatment,leaf sheaths of each individual tiller were used for total RNA extraction.Total RNA was extracted according to the instructions of the manufacturer (TaKaRa,Co.9769,Dalian,China). Reverse transcription of each RNA sample was performed using the Reverse Transcriptase M-MLV Kit (TaKaRa,Co.639522,Dalian,China),according to the manufacturer’s protocol. The primer pair used forEPSPSamplification was:5´-AAGGAGACCGAGAGGATGG-3´(forward) and 5´-CGGCAGGAGAGCAAAAGAG-3´(reverse). The primers for the reference geneEF1αwere:5´-TGGTGGTTTTGAGGCTGGTA-3´ (forward) and 5´-TCATCTGCTTCACTCCAAGAG-3´ (reverse).EPSPSexpression levels were determined by qPCR using SYBR Master Mix (TaKaRa,Co.639676,Dalian,China). The conditions were set as follows:template DNA was denatured at 95°C for 10 min,followed by 40 cycles of 95°C for 5 s,58°C for 30 s,and 72°C for 30 s for each cycle,according to the SYBR Green Kit manufacturer’s instructions (TaKaRa,RR820L,Dalian,China) using the Bio-Rad fluorescence quantitative PCR system (CFX96 Touch,Bio-Rad,Guangzhou,China).
Leaf material from a single tiller of each target GS and GRE.indicaplant without glyphosate treatment was used for genomic DNA isolation. Genomic DNA was extracted by the Genomic DNA Purification Kit (Thermo,#K0512,Guangzhou,China) according to the manufacturer’s instructions. Genomic PCR,followed by polyacrylamide gel detection,was carried out to identify the 5´-UTR (CT)ninsertions of theEPSPSgene inE.indica. The PCR conditions were set as follows:95°C for 3 min,32 cycles of 95°C for 30 s,58°C for 30 s,and 72°C for 60 s,and a final extension at 72°C for 10 min. The PCRamplified product was about 120 bp in length. A total of 2 μL of each of the PCR products was used to conduct the polyacrylamide gel (0.8%) electrophoresis followed by silver staining. The primer pair used to amplify theEPSPSgene fragment which contains the (CT)ninsertions was:CT-F:5´-GCGGCGCACGCCTCAGCTCA-3´ (forward) and CT-R:5´-GTCGAGGTTGGTTTGGCTGC-3´ (reverse).
After identification,the third tillers of three GR plants with inducible expression and (CT)ninsertion mutation of theEPSPSgene were selected for RNA-seq,whereas three GS tillers without inducible expression and (CT)ninsertion mutation of theEPSPSgene were used for controls. Six hours after glyphosate treatment (1 000 g ha-1),the samples (leaf and sheath tissues) were cut,immediately frozen with liquid nitrogen and stored at -80°C until RNA extraction.
2.2.RNA-seq analysis
To reveal the molecular regulatory mechanism of theEPSPSgene expression on the GR development inE.indica,leaf sheaths of the GS and GRE.indicaseedlings were collected at 6 h after glyphosate treatment (indicated as GS and GR groups,respectively). Transcriptome analysis was performed with three replicates. A total of 30 mg of each RNA sample was used to generate resistant and susceptible RNA-seq libraries using the mirVana™ miRNA ISOlation Kit (Ambion-1561). Approximately 4 μg of total RNA was used for RNA-seq.RNA purity was checked using the Agencourt AMPure XP (Beckman Coulter,#A63881,CA,USA) and RNA concentration was measured using Qubit RNA Assay Kit (Life Technologies,#Q32852,CA,USA). RNA integrity was assessed using the RNA Nano 6000 Assay Kit of the Bioanalyzer 2100 System (Agilent Technologies,Santa Clara,CA,USA). The transcriptome sequencing and analysis were conducted through OE Biotech Co.,Ltd.(Shanghai,China). Raw data (raw reads) were processed using Trimmomatic (Bolgeret al.2014). The reads containingpoly-N and the low-quality reads were removed to obtain the clean reads. After removing adaptor and low-quality sequences,the clean reads were assembled into expressed sequence tag clusters (contigs) andde novoassembled into transcripts by using Trinity (version 2.4) in the paired-end method (Grabherret al.2011).
The longest transcript was chosen as a unigene for annotation by alignment with the sequences in the databases of NCBI nonredundant (NR),SwissProt,and Clusters of orthologous groups for eukaryotic complete genomes (KOG) using Blastx with a threshold E-value of 10-5(Altschulet al.1990). The proteins with the highest hits for the unigenes were used to assign functional annotations. Based on the SwissProt annotation,Gene ontology (GO) classification was performed by the mapping relation between SwissProt and GO terms. The unigenes were mapped to the Kyoto Encyclopedia of Gene and Genomes (KEGG) database to annotate their potential metabolic pathways (Kanehisaet al.2008).Then fragments per kilobase of transcript sequence per million base pairs sequenced (FPKM) and read count values of each unigene were calculated using Bowtie2 (Trapnellet al.2010;Langmead and Salzberg 2012) and eXpress (Roberts and Pachter 2013).
2.3.Identification of differentially expressed unigenes (DEGs) and functional enrichment analyses
DEGs data were standardized using the DESeq (2012) functions estimate Size Factors,and the nbinom Test function was used to calculate theP-value and fold change (Anders and Huber 2012).P-value<0.05 and fold change>2 (up-regulated) or fold change<0.5 (downregulated) were set as the thresholds for significantly differential expression patterns. Transcription factor identification was conducted by using Pfam (http://pfam.xfam.org/).
For further analysis,Gene Ontology (GO) enrichment analysis of differentially expressed genes was implemented by the GOseq R package. GO functional classification of DEGs was conducted by using WEGO 2.0 (http://wego.genomics.org.cn/). The Kyoto Encyclopedia of Genes and Genomes (KEGG) Database was used to analyze the pathway map of DEGs (https://www.kegg.jp/). GO and KEGG pathway enrichment analyses were conducted to analyze the biological functions of the modules. Significantly enriched GO terms and pathways of the genes in the modules compared to the background were defined by a hypergeometric test with a threshold of false discovery rate (FDR) less than 0.05.
All data generated or analyzed in this study are included in this submitted manuscript and supplementary material. Reads of the transcriptome were deposited in the Sequence Read Archive (SRA) database of NCBI with the accession number SRR12328728.
2.4.Yeast one-hybrid assay
Yeast one-hybrid assays were implemented originally according to the Matchmaker Gold Yeast One-Hybrid Librid Screening System User Manual (Clontech,San Francisco,USA),to test the abilities of identified transcription factorsARFandBPCto bind to the 5´-UTR Py-rich stretch element ofEPSPS. AnARF8and aBPC6ORF truncation sequences were amplified fromE.indicacDNA by PCR and cloned into the pGADT7 vector (Clontech). The 5´-UTR Py-rich stretch element fragment (CTCTCTCTCTCTCTCTCTCTCTCT,referred to as YJ1) and mutant tandem repeats (CTCTCTCTCTCTCTCTCTCTGTCTCTCTCTCTCTCT,referred to as YJ2) were cloned and inserted into theBstI andBstBIsites of the p53-AbAi vector. Yeast Y1HGlod was transformed with the vector pGADT-prey and the bait plasmids (pGADT-ARF8+Y1H[pAbAi-YJ1]/Y1H[pAbAi-YJ2];pGADT-BPC6+Y1H[pAbAi-YJ1]/Y1H[pAbAi-YJ2]).The transformants were screened by plating on SD/-Leu/AbA plates. After 4-5 days,the positive yeast strains were picked,diluted in 0.9% NaCl and spotted on SD/-Leu or SD/-Leu/Aba. The plates were incubated for 3 days at 30°C.
2.5.Statistical analysis
Statistical analysis was performed by using Student’st-test. Data are presented as the mean±SE of three independent biological replicates andP<0.05 was accepted as significant.
3.Results
3.1. EPSPS overexpression and (CT)n insertion mutation in E.indica
In order to analyze the transcriptional regulation network of theEPSPSgene and identify whether the mechanism of transcriptional regulation of theEPSPSgene was changed by (CT)ninsertion in GRE.indica,eight plants were randomly selected from both GR and GSE.indicapopulations for detection of the (CT)ninsertion mutation at the 5´-UTR of theEPSPSgene by polyacrylamide gel (0.8%) electrophoresis. The results showed that the 5´-UTR Py-rich stretch element mainly exists in the mutated form in the eight GRE.indicaplants,whereas the wild form of the 5´-UTR Py-rich stretch element exists mainly in the eight GS plants (Fig.1-A). DNA sequencing showed that the mutations are caused by the insertion of a 12-base tandem repeat (CTCTCTGTCTCT,referred to as (CT)6) in the 5´-UTR Py-rich stretch element.Four GR plants (No.1,4,5 and 7) exhibited additional nonspecific bands. In order to avoid the influence of unknown factors,the GR (No.2,3 and 6 referred to as GR1,GR2 and GR3,respectively) and GS plants (No.1,2 and 3 referred to as GS1,GS2 and GS3,respectively) were picked and used for the detection ofEPSPSgene expression. In the case of glyphosate treatment,the level ofEPSPSgene expression in the three GRE.indicaplants was significantly induced,while the expression level of theEPSPSgene did not change in the three GSE.indicaplants (Fig.1-B). These results suggested that the selected GS and GR plants met the requirements of transcriptome analyses,and the tillers of the GR1-3 and GS1-3 plants were used for RNA-seq.
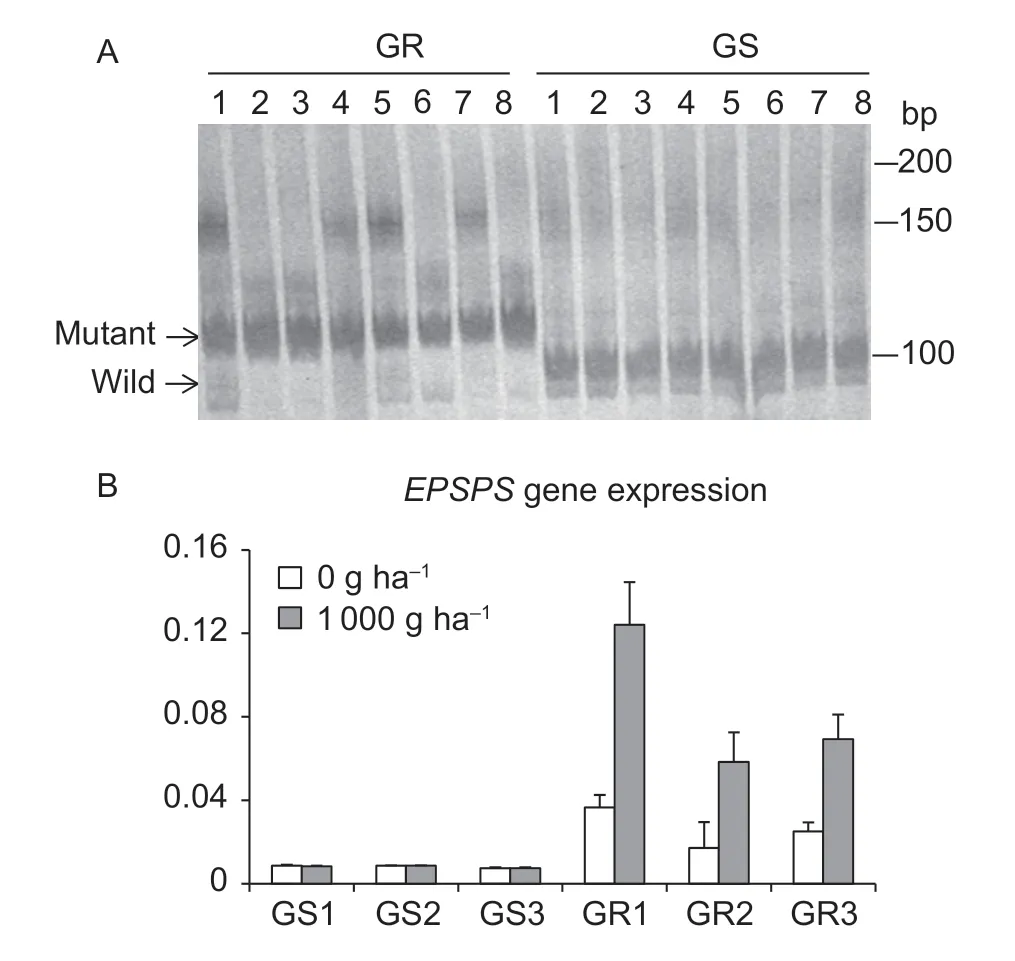
Fig.1 Analysis of (CT)n insertion mutation and expression of EPSPS in GS and GR Eleusine indica populations at 6 h postglyphosate treatment (1 000 g ha-1). A,(CT)n sequence PCR analysis based on the polyacrylamide gel electrophoresis and silver staining methods. B,qRT-PCR analysis of the EPSPS expression was normalized with EF1α as an internal control. Three duplicates were performed for each sample. Data are mean±SE (n=3). Mutant,the 5´-untranslated region (UTR) of the EPSPS gene with a (CT)6 insertion;wild,the original 5´-UTR of the EPSPS gene;GS1-3,glyphosate-susceptible plants;GR1-3,glyphosate-resistant plants.
3.2.Transcriptome sequencing and differentially expressed unigene (DEGs) analyses
Transcriptome analysis was performed with three replicates per group. Principal component analysis (PCA) of the samples showed that component contributes 80.15% on the two-dimensional principal component axis and the GS and GR plants are clearly separated into two groups on the main component axis of PC1 (Fig.2-A),suggesting significant differences between the GR and GS groups. Afterde novoassembly,a total of 38 230 unigenes were obtained. After comparisons between the GR and GS groups with |log2(GR/GS)|>1 andP-adjusted <0.05,6 777 DEGs were identified (Appendix A),of which 2 752 were up-regulated and 4 025 were down-regulated (Fig.2-B). The overall patterns of gene expression in the GR and GS groups are represented as a heatmap (Fig.2-C). In particular,the data of DEGs confirmed that theEPSPStranscripts increased in the GRE.indicaweeds,as compared to the GS weeds (Fig.2-D),implying that there were differences in the regulatory mechanisms of theEPSPSgene expression between GR and GSE.indica.
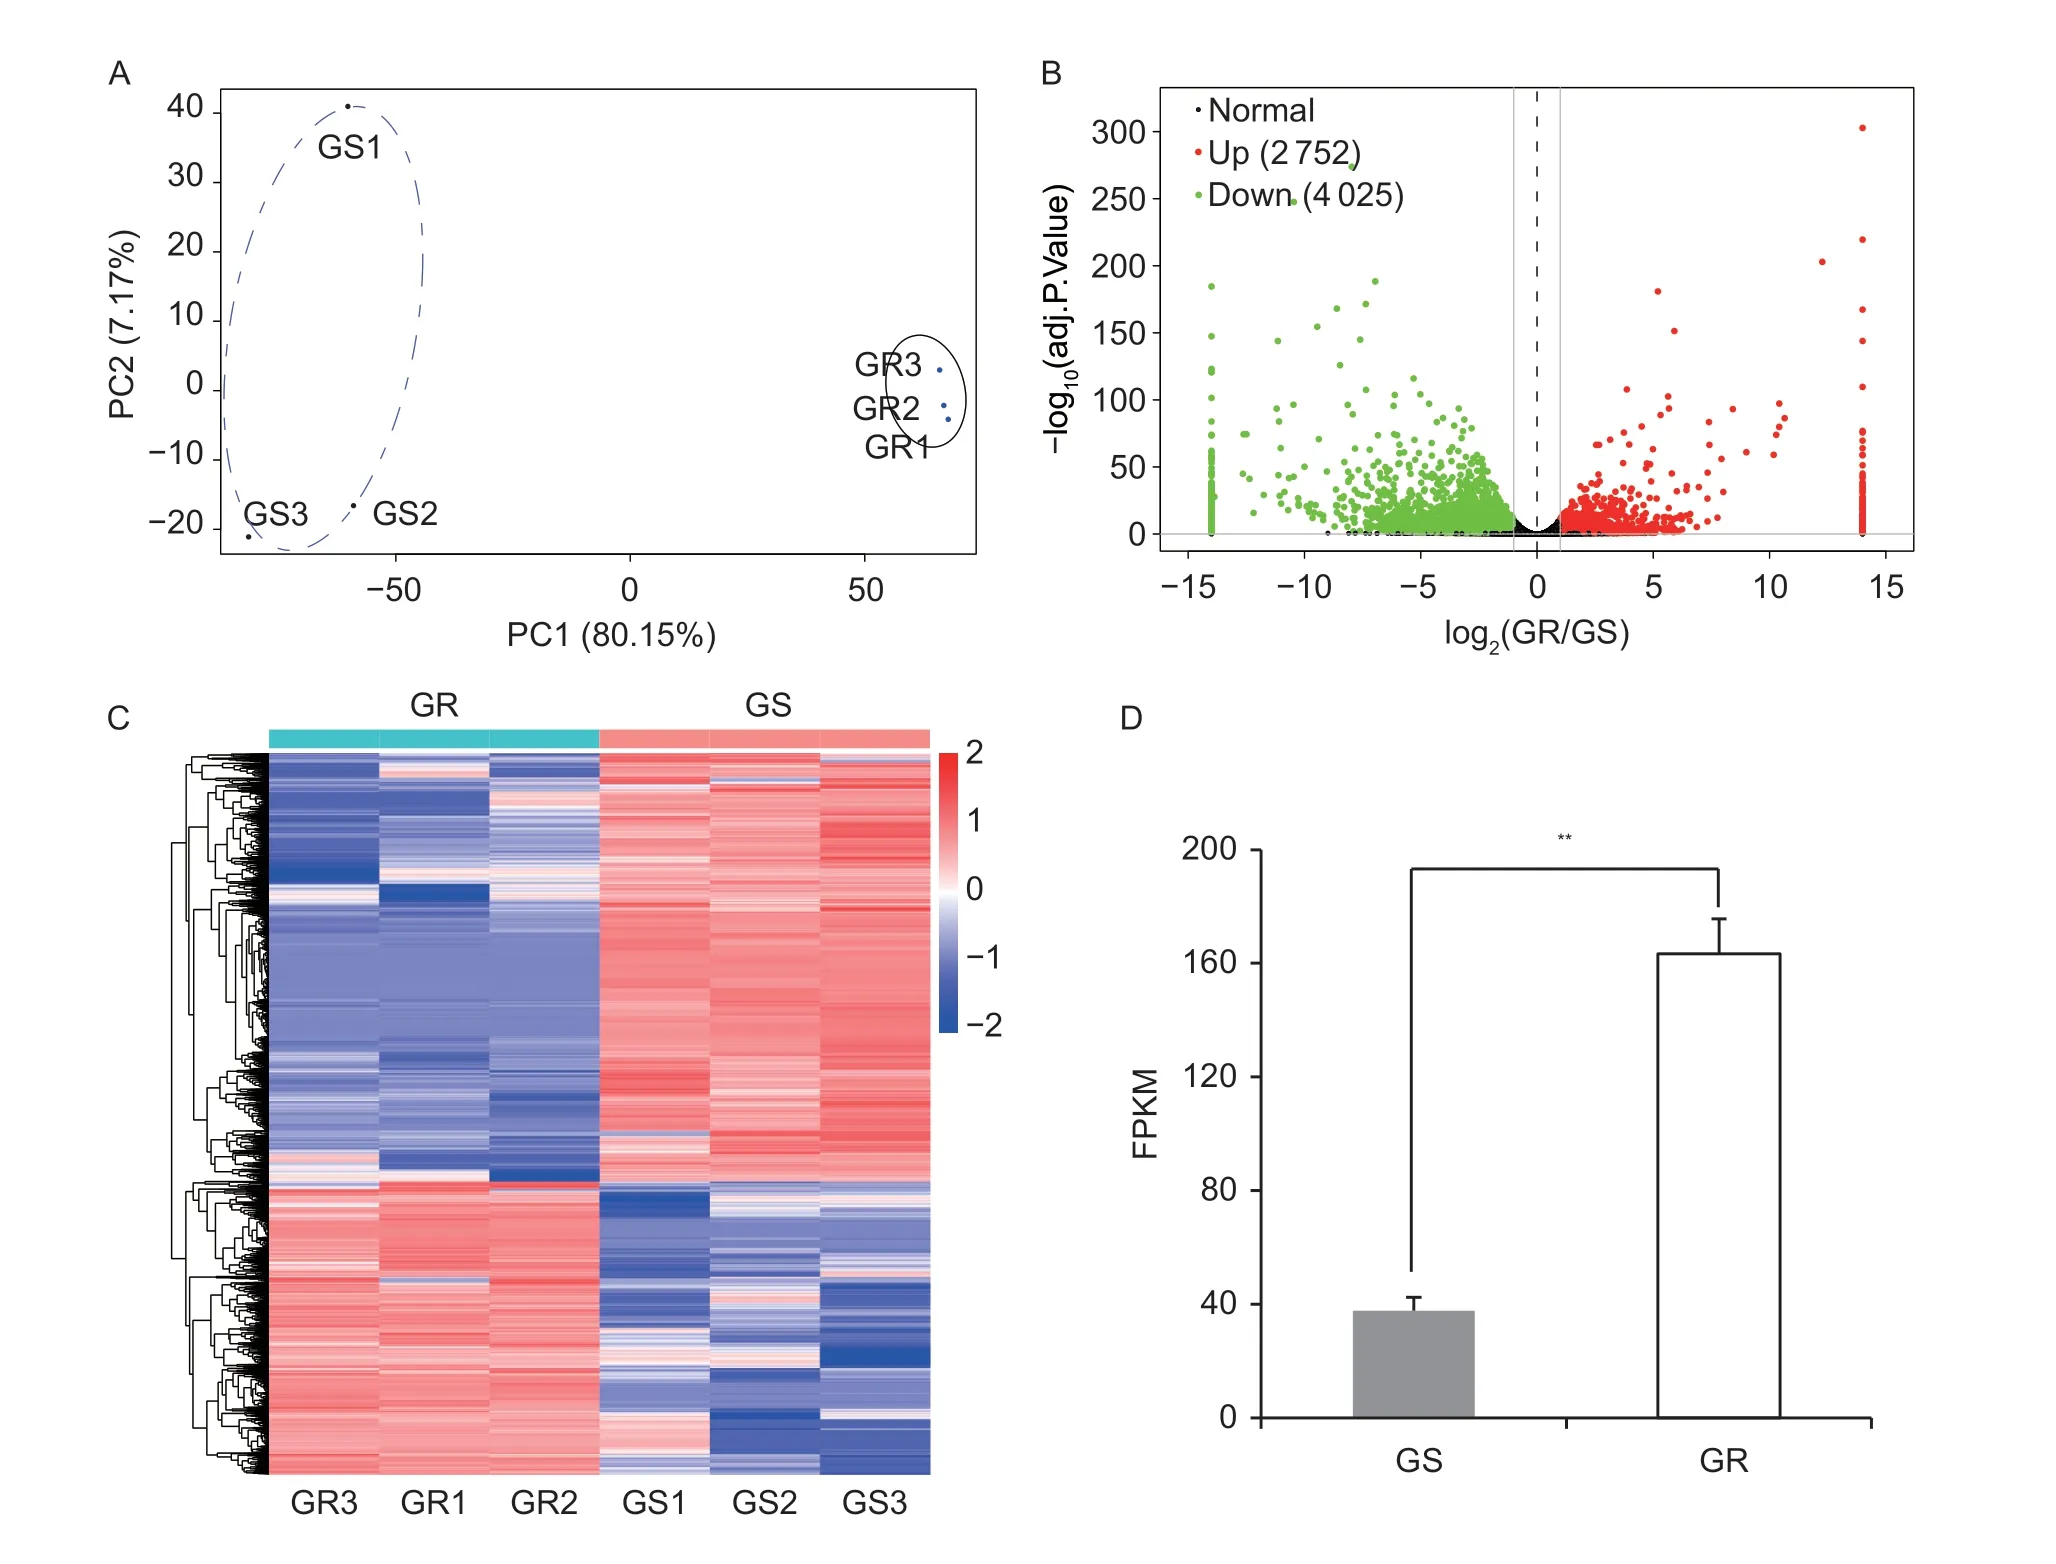
Fig.2 Expression patterns of differentially expressed transcripts in Eleusine indica between the glyphosate-susceptible (GS) and glyphosate-resistant (GR) groups. A,principal component analysis (PCA) of RNA-seq data of GS and GR E.indica at the 5-6 leaves stage 6 h after glyphosate treatment. B,Volcano plot of the differentially expressed unigenes. The red dots indicate the number of the up-regulated genes and the green dots indicate the number of the down-regulated genes using |log2(GR/GS)|>1 and P-adjusted <0.05 as the cutoff thresholds. C,Heatmap and hierarchical clustering of the differentially expressed unigenes. D,fragments per kilobase of transcript sequence per million base pairs (FPKM) of the EPSPS genes. The values are mean±SE (n=3). Statistical analysis was performed using Student’s t-test,P<0.05.
3.3.Identification of DEGs that co-expressed with EPSPS
To further reveal the possible regulatory network of theEPSPSgene in the GRE.indica,the DEGs that coexpressed either positively or negatively withEPSPSwere analyzed using the Pearson correlation coefficient (PCC). A total of 1 373 DEGs that co-expressed withEPSPSwere identified with |PCC|>0.99,P-value<0.01 and FDR<0.01 as significant co-expression criteria (Appendix B),of which 728 were positively co-expressed and 645 were negatively co-expressed. These DEGs can be divided into four categories. Category 1 contained 708 up-regulated unigenes that were positively correlated with the expression ofEPSPS,category 2 contained 20 up-regulated transcription factor unigenes that were positively correlated with the expression ofEPSPS,category 3 contained 611 down-regulated unigenes that were negatively correlated with the expression ofEPSPS,and category 4 contained 34 down-regulated transcription factor unigenes that were negatively correlated with the expression ofEPSPS(Fig.3).

Fig.3 Co-expression network of EPSPS gene in Eleusine indica. Red and green solid circles represent the different up-regulated and down-regulated transcripts,respectively. Yellow and gray lines represent the transcripts that were positively and negatively correlated with the EPSPS gene,respectively. Group 1,708 up-regulated unigenes that are positively correlated with EPSPS;Group 2,20 up-regulated transcription factor unigenes that are positively correlated with EPSPS;Group 3,611 down-regulated unigenes that are positively correlated with EPSPS;Group 4,34 down-regulated transcription factor unigenes that are positively correlated with EPSPS.
3.4.Gene Ontology (GO) classification of DEGs that co-expressed with EPSPS
To analyze the functions of DEGs that co-expressed withEPSPS,WEGO 2.0 was used to carry out the GO classification (Yeet al.2018). The results showed that the positively co-expressed DEGs were enriched in the GO items of chloroplast,chloroplast part and extracellular region in the cellular component catalog (Fig.4). For the molecular function catalog,the DEGs were enriched in catalytic enzyme activity,such as endonuclease activity,hydrolase activity acting on glycosyl bonds,hydrolyzing O-glycosyl compounds,peptidase activity and oxidoreductase activity. These DEGs may participate in carbohydrate metabolic and macromolecule catabolic biological processes (Fig.4). Most of DEGs that are positively co-expressed withEPSPSare classified into chloroplast and chloroplast parts,which suggests that photosynthesis is probably more active in GR than in GSE.indicaafter glyphosate treatment,or that the photosynthesis in the GR population is less inhibited by glyphosate than in the GS population.
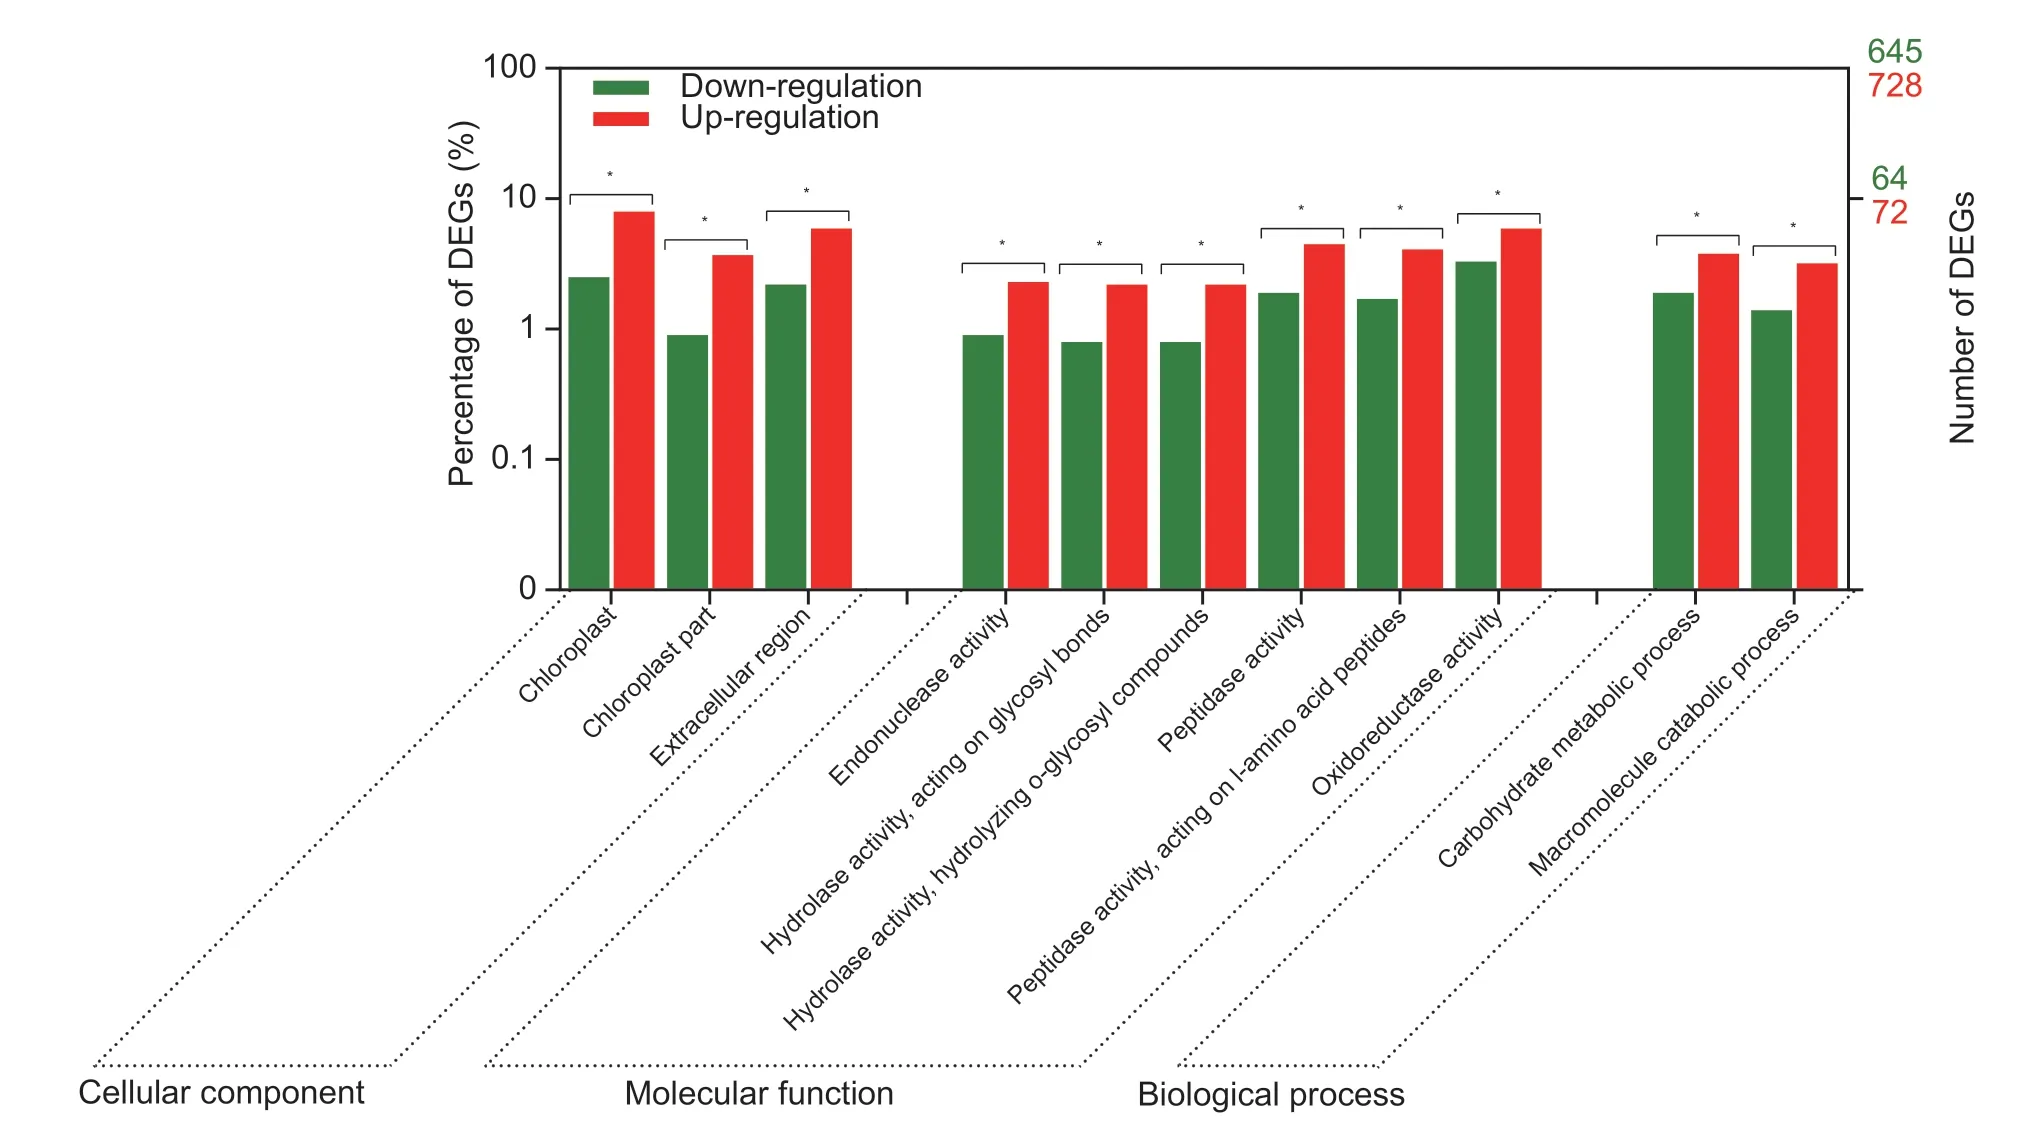
Fig.4 Gene Ontology classification of differentially expressed unigenes that co-expressed with EPSPS. Asterisks indicate that the differences between the two groups are significant at P<0.05. DEGs,differentially expressed unigenes.
Among the DEGs that co-expressed withEPSPS,a shikimate kinase like 2 gene (DN12267_c0_g1_i4) was positively co-expressed withEPSPS. In the shikimic acid pathway,shikimate is transformed into the EPSPS substrate shikimate 3-phosphate catalyzed by shikimate kinase,and then shikimate 3-phosphate is transformed into 5-enolpyruvyl-shikimate-3-phosphate by EPSPS (Tzin and Galili 2010;Maeda and Dudareva 2012). This result implied that not only theEPSPSexpression,but also the synthesis of the shikimate 3-phosphate substrate also increased in the GRE.indicaafter glyphosate treatment.
3.5.KEGG pathway analysis of DEGs that co-expressed with EPSPS
KEGG analysis was conducted to explore the signal pathways that the DEGs co-expressed withEPSPSmight be involved in (Fig.5). Many of the differentially up-regulated unigenes (positively co-expressed withEPSPS) were enriched in the porphyrin and chlorophyll metabolism and peroxisome signal pathways (Fig.5).Hydroxymethylbilane synthase (HemC,DN19617_c0_g1_i1),uroporphyrinogen decarboxylase (HemE,DN8827_c0_g1_i3),protoporphyrin/coproporphyrin ferrochelatase (HemH,DN18863_c0_g1_i8),protoporphyrinogen/coproporphyrinogen III oxidase (PPOX,DN11577_c0_g1_i2),protochlorophyllide reductase (POR,DN15528_c1_g1_i1) and magnesium-protoporphyrin O-methyltransferase (BchM,DN14230_c0_g1_i1) are involved in the porphyrin and chlorophyll metabolism pathway (Fig.5-A). HemC,PPOX,BchM and POR are intermediate enzymes in the chlorophyll a and chlorophyll b synthesis pathways (Fig.5-A). Several genes that are involved in the peroxisome pathway were also identified,such as catalase (CAT,DN22113_c1_g1_i3),superoxide dismutase (SOD,DN11337_c0_g1_i2),long-chain acyl-CoA synthetase (ACSL,DN21759_c0_g2_i3) and (S)-2-hydroxy-acid oxidase (HAO,DN21669_c0_g1_i14) (Fig.5-B),and CAT and SOD are the main antioxidant enzymes. These results suggest that photosynthesis in the GR population was more active than in the GS population. In addition,GRE.indicamight become more resistant to glyphosate stress by overexpressing antioxidant enzyme genes.

Fig.5 Porphyrin and chlorophyll metabolism pathway (A) and peroxisome pathway (B). The pathways were annotated with unigenes that are positively correlated with EPSPS. Boxes with red and green backgrounds are the differentially expressed unigenes (DEGs) that co-expressed with EPSPS. Their corresponding unigene IDs are shown in blue. The red and green represent the up-regulated and down-regulated differentially expressed unigenes (DEGs),respectively.
3.6.Identification of transcription factors that may regulate the expression of EPSPS in GR E.indica
To find the transcription factors (TF) that interact with theEPSPSgene,the unigenes were analyzed using the PFAM method. In total,1 142 unigenes were found to have TF activity,including 217 differentially expressed TF unigenes,of which 54 were up-regulated and 163 were down-regulated (Appendix C). To find the TFs that potentially bind to theEPSPSgene promoter and regulate the gene expression,anArabidopsis thalianadatabase was searched for the homologs to the 1 142 TF unigenes ofE.indica. The 235 TF unigenes have homologs in theArabidopsisdatabase,among which 132 TF unigenes were predicted to bind to theEPSPSpromoter inE.indica(Appendix D).
To further find the possible TFs involved in the regulation ofEPSPSgene expression in GRE.indica,the 132 TF unigenes were further analyzed using PCC. Five TF unigenes (PIF3,MYC2,ABI3,WRKY40andMYB15) associated with the high-level expression ofEPSPSwere identified with |PCC|>0.95 and FDR<0.05 as significance criteria. Two of these TFs (WRKY40andMYB15) were down-regulated and other three (PIF3,MYC2,andABI3) were up-regulated. Three TFs (ARF2,ARF8andBPC6) that have increased binding sites because of the (CT)ntandem repeat insertion in theEPSPSpromoter of GRE.indica(Table 1) were also identified. The expression levels of the eight TF unigenes above were further determined by qRT-PCR.The results showed that the expression ofPIF3,MYC2andABI3increased significantly,whereas the expression ofWRKY40andMYB15decreased significantly in the GRE.indica,as compared to the GSE.indica(Fig.6),which was consistent with the RNA-seq results (Table 1). The expression ofARF2,ARF8andBPC6was also consistent with the results of the transcriptomic analysis (Table 1).
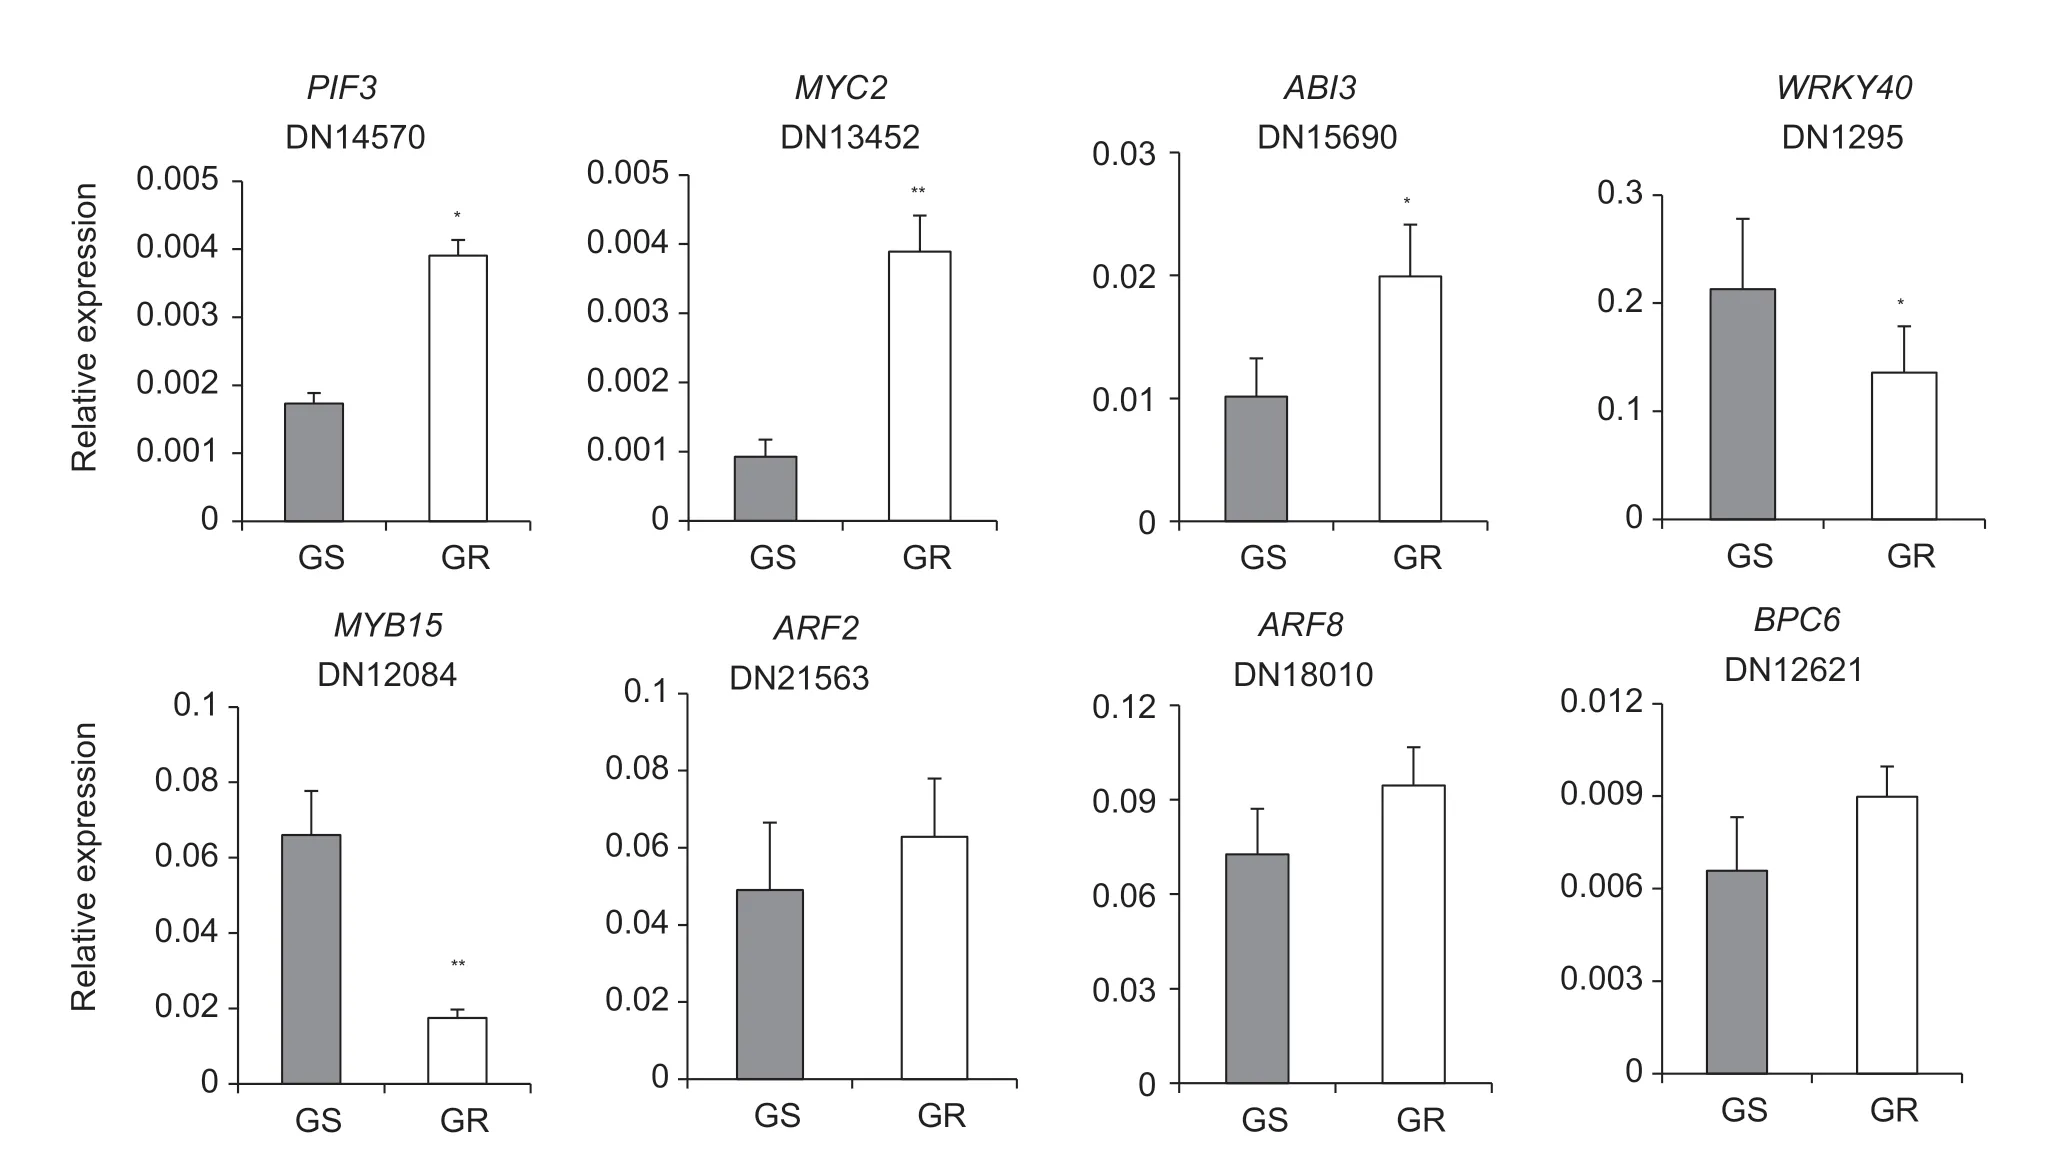
Fig.6 qRT-PCR analysis of the expression of the eight selected differentially expressed transcription factors in the glyphosatesusceptible (GS) and glyphosate-resistant (GR) Eleusine indica at 6 h post-glyphosate treatment. The relative expression levels were normalized to the EF1α levels. The values are mean±SE (n=3). Statistical analysis was performed using Student’s t-test.*,P<0.05;**,P<0.01.

Table 1 Summary of data for the eight transcription factors that are potentially involved in EPSPS expression in GR Eleusine indica1)
3.7.ARF8 and BPC6 could bind to the 5´-UTR Pyrich stretch element of the sequence
Bioinformatics analysis showed that transcription factorsARF2,ARF8andBPC6could bind to the 5´-UTR Py-rich stretch element,but there were no significant differences in the expression of either of these three transcription factors between GS and GR biotypes. A yeast onehybrid assay was explored to determine whether ARF or BPC6 proteins could bind to the 5´-UTR Py-rich stretch element. Complete coding sequences ofARF8(unigene ID,DN18171_c0_g1_i3) andBPC6(unigene ID,DN12621_c0_g1_i1) were insert into vectors containing both activation domain (AD) and were driven by PT7.Two repeated copies of 5´-UTR Py-rich stretch element sequences from GS and GR (designated as YJ1 and YJ2,respectively) were synthesized as baits. As illustrated in Fig.7,the yeasts co-transformed with eitherAFR8orBPC6along with YJ1 grew well in SD/-Leu medium with AbA (1 500 ng mL-1) in the yeast one-hybrid assay as a positive control for yeast growth. In contrast,growth of the yeasts co-transformed with eitherAFR8orBPC6gene along with YJ2 were evidently inhibited in SD/-Leu medium with 500 ng mL-1AbA as a negative control. This data indicated that the ARF8 and BPC6 proteins could bind to the 5´-UTR Py-rich stretch element of YJ1 but not to the mutant YJ2.
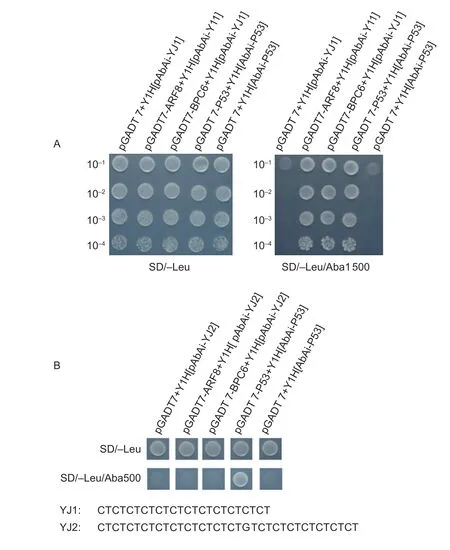
Fig.7 Both ARF8 and BPC6 proteins could bind to the 5´-untranslated region (UTR) pyrimidine (Py)-rich stretch element via a yeast one-hybrid assay. A,yeast Y1HGlod was transformed with the vector (pGADT7-ARF8 or pGADT7-BPC6) and the bait plasmids YJ1. The transformants were screened by plating on SD/-Leu/AbA plates with 1 500 ng mL-1 AbA. B,yeast Y1HGlod was transformed with the vector (pGADT7-ARF8 or pGADT7-BPC6) and the bait plasmids YJ2. The transformants were screened by plating on SD/-Leu/AbA plates with 500 ng mL-1 AbA. pGADT7-P53+Y1H[AbAi-P53] was used as the positive control,while pGADT7+Y1H[AbAi-P53] was used as the negative control.
Compared to YJ2,the CT repeats of YJ1 are increased,and a nucleotide C in the middle is mutated to G. It is suggested that the sequence elongation and mutation of the 5´-UTR Py-rich stretch element affect the binding ofEPSPSto transcription factors,and the transcriptional regulation mechanism of theEPSPSgene was significantly changed in GRE.indica,compared to GSE.indica.
4.Discussion
The herbicide glyphosate inhibits the enzyme 5-enolpyruvylshikimate-3-phosphate synthase (EPSPS).Overexpression of theEPSPSgene is one of the molecular mechanisms conferring glyphosate resistance in weeds,but the transcriptional regulation of this gene is poorly understood. A 1 142-bp upstream sequence of theEPSPSgene inConvolvulus arvensis,namedCaEPSPS-P,was obtained by genome walking,and its multiplecis-regulatory elements had been identified (Huanget al.2015). In our preliminary study,two upstream regulatory sequences ofEPSPS,Epro-S and Epro-R,were obtained from GS and GRE.indicaplants,respectively. However,the role of thecis-regulatory elements in the regulation of theEPSPSgene expression is unclear,as transcription factors that could bind to these elements and co-expression of factors withEPSPSgene were not identified. In this study,the expression and regulation network oftheEPSPSgene in GRE.indicawith a (CT)6insertion mutation was investigated through transcriptomic analysis.
RNA-seq and subsequent DEG analysis showed that 1 373 unigenes were associated with the regulation network of theEPSPSgene in GRE.indica. GO and KEGG pathway analyses revealed that the differentially up-regulated DEGs that are positively co-expressed with theEPSPSgene were mainly classified to chloroplast,porphyrin and chlorophy II metabolism,and peroxisome pathway. Photosynthesis is not a primary inhibitory target of glyphosate,but it is affected by glyphosate in many weed species (Sreenivasuluet al.2015;Silvaet al.2017).Some reports have suggested that glyphosate efficiency is affected by light quality and intensity (Sharkhuuet al.2014). When the shikimic acid pathway is blocked by glyphosate,the photosynthetic system is also seriously affected (Zhang T Jet al.2015). InA.thaliana,Convolvulus arvensisandE.indica,light response elements are found in the upstream regulatory regions ofEPSPSgenes,such as phytochrome-interacting factor (PIF) elements (CACGTG) and light-responsive elements (Sp1,CCCACC) (Sharkhuuet al.2014;Huanget al.2015;Zhanget al.2018). In this study,aPIF3factor was found to be associated withEPSPSgene overexpression,and it is suggested that the shikimate pathway is functionally closely in relation to photosynthesis.
The ultimate significance of this study is in the identification of transcription factors associated withEPSPSexpression,which might further act on the shikimate acid,chlorophy II metabolism and peroxisome pathway (Fig.8). Five differentially expressed transcription factors (DETFs) were identified,among whichPIF3,MYC2andABI3were up-regulated in GRE.indica,whereasWRKY40andMYB15were downregulated. In addition,three kinds of transcription factors (ARF2,ARF8andBPC6) could bind the 5´-UTR Py-rich stretch element (Table 1),and bioinformatics analysis showed that after the insertion of (CT)6,the number of binding sites of the regulatory region ofEPSPSgene toARFs andBPC6 increased.
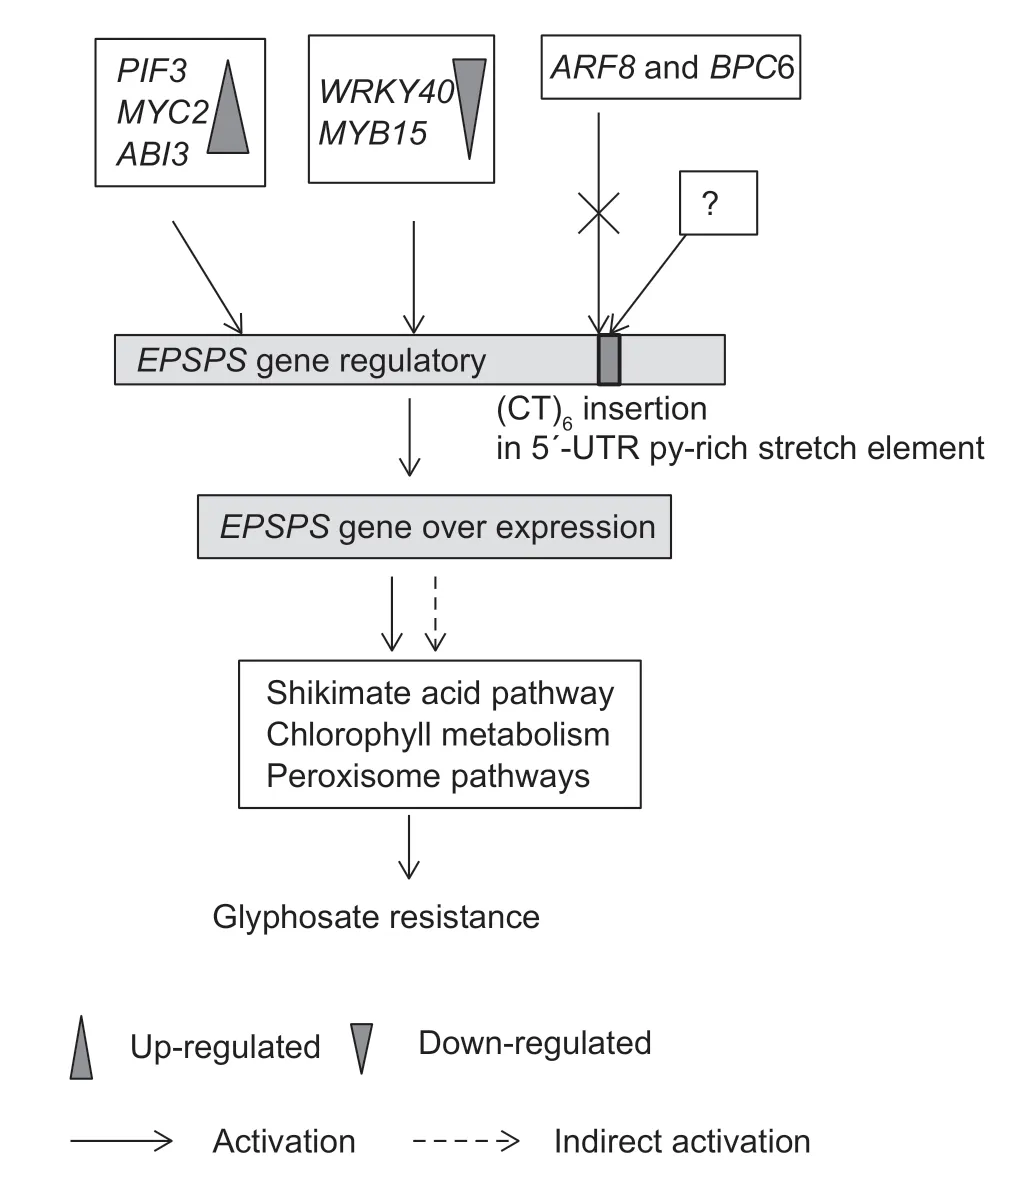
Fig.8 Diagram of the molecular regulatory mechanism of the EPSPS gene for glyphosate-resistance in Eleusine indica. The expression of EPSPS might be regulated by PIF3, MYC2, ABI3,WRKY40 and MYB15,and then directly or indirectly promote shikimate acid,chlorophyll metabolism and peroxisome pathway activities,resulting in glyphosate resistance.
As far as the five transcription factors with significantly differential expression,PIF3andMYC2,basic helix-loophelix (bHLH) DNA-binding family proteins,were found to be responsible for resistance to environmental stress.PIF3plays a regulatory role in the signal transduction of photosensitive pigments (Niet al.1998,1999). This protein functions as a light responsive transcriptional factor,regulatingEPSPSgene expression inA.thaliana(Sharkhuuet al.2014).MYCis involved in the development of the rice seed coat and the regulation of plant drought resistance (Sweeneyet al.2006;Abeet al.1997,2003). In addition,a number of transcription factors from other bHLH families are involved in a variety of plant stress resistances,including drought,high salt,iron deficiency and others (Ogoet al.2007;Zhouet al.2009).ABI3 is a protein of theAP2/B3-like transcriptional factor family and functions in the transcriptional regulation of a variety of growth and development processes,as well as various responses to environmental stimuli (Nole-Wilson and Krizek 2000). InA.thaliana,AP2/ERFtranscription factors regulate proline synthesis,enhancing cold tolerance (Gilmouret al.2000).WRKY40andMYB15significantly decreased in the GRE.indica(Table 1),in which theEPSPSexpression increased (Fig.2-D),suggesting thatWRKY40andMYB15may have negative regulatory relationships withEPSPSexpression. Earlier studies reported similar results. TheArabidopsisWRKY40gene (Shanget al.2010),as a main negative regulator,inhibited the expression of the ABA-responsive geneABI5. As a large family of transcription factors in plants,MYBtranscription factors are also widely involved in the regulation of plant development and metabolism (Bilaudet al.1996).MYBoften collaborates with other transcription factors to precisely regulate the transcription of target genes (Singhet al.1998).ArabidopsisAtMYB2 protein interacts with the bHLH family protein RdBP to co-regulate the expression of theRd22gene (Abeet al.1997). The interaction between MYB and bHLH protein was also found to regulate the biosynthesis of anthocyanin in maize and petunia (Singh 1998;Quattrocchioet al.1999). Thus,PIF3,MYC2,ABI3,WRKY40andMYB15are likely to be involved in the regulation of the expression of theEPSPSgene inE.indicaand these factors might co-operatively regulate the expression of theEPSPSgene.
BPCis a plant-specific transcription factor,specifically binding to GA/CT dinucleotide repeat DNA sequences (CT)n(Sangwan and O’Brian 2002;Santiet al.2003;Meisteret al.2004;Shankset al.2018),withBPC6belonging to theBBR-BPCfamily. As a simple sequence repeats (SSRs),(CT)nhas been found in the regulatory regions of numerous genes of higher eukaryotes (Simar-Blanchetet al.1998;Bevilacquaet al.2000;Melfiet al.2000;Wyseet al.2000;Mohammadparastet al.2014) and is often located in the 5´-UTR of the gene and has effects on gene transcription and protein function (Kashiet al.1997;Trifonov 2004;Castillo-Davis 2005). With more repeats of CT,the regulatory function appears more efficient (Vinceset al.2009;Joshi-saha and Reddy 2015). InDrosophila melanogaster,(CT)nelements repress gene expression by stabilizing nucleosomes (Crostonet al.1991;Luet al.1993). A GAGA binding protein that binds to the (CT)nelements could relieve repression (Tsukiyamaet al.1994;Tsukiyama and Wu 1995). In plants,length polymorphism of (CT)noften regulates the level of transcriptional expression of the associated gene (Kumar and Bhatia 2016). Here,a yeast one-hybrid assay demonstratedBPC6could bind to the 5´-UTR Py-rich stretch element,but could not bind to the mutant (Fig.7). Consistently,transcriptional and qRT-PCR results showed that there was no significant up-regulation ofBPC6expression in GRE.indica.After the (CT)6fragment was inserted into the 5´-UTR Py-rich stretch element,theBPC6binding sites of the element were increased in theory,but the predictedBPC6factor could not bind to the mutant 5´-UTR Pyrich stretch element. Considering a nucleotide C in the middle of the element is mutated to G,we speculated that the mutation of the 5´-UTR Py-rich stretch element may lead to the change in the activity and expression ofEPSPS,in some unknown feedback manner,such as by methylation,resulting in a failure of these transcription factors to bind with the 5´-UTR Py-rich stretch element of theEPSPSgene.
Like theBPC6factor,ARFfactor,which was hypothesized to bind to the 5´-UTR Py-rich stretch element,also did not bind to the mutant 5´-UTR Pyrich stretch element in GRE.indica.ARFis an auxin response factor involved in various aspects of plant growth and development (Kalluriet al.2007;Kumaret al.2011). There are no reports ofARFin relation to the regulation of environmental stress,and whether theARFsis involved in the regulation of theEPSPSgene expression in GRE.indicaneeds to be further verified.
5.Conclusion
Based on the transcriptomic data and yeast one-hybrid assay results,we speculated that the transcriptional regulation ofEPSPSexpression was significantly changed in GRE.indica,compared to that of GSE.indica.The three factors with up-regulated expression (PIF3,MYC2andABI3) and two factors with down-regulated expression (WRKY40andMYB15) are synergistically associated with the expression of theEPSPSgene in GRE.indica,while theARF8andBPC6 could not bind to the mutated 5´-UTR Py-rich stretch element. The change inEPSPSexpressionmight directly or indirectly act on the shikimate acid,chlorophy II metabolism and peroxisome pathway,resulting in glyphosate resistance. It remains to be determined whether the mutations of the 5´-UTR Py-rich stretch element lead to changes in the activity or expression of transcription factors,through some unknown feedback mechanisms.
Acknowledgements
This study was supported by the National Natural Science Foundation of China (31871984),the Guangdong Provincial National Natural Science Foundation,China (2017B030311006),the Department of Science and Technology of Guangdong Province,China (2019B121201003),and the special fund for Scientific Innovation Strategy-Construction of High Level Academy of Agriculture Science,China (202105TD,R2020PYJX005). We also thank Ou Jun (Technical Support Engineer of Chenzhou Zhixin Biotechnology Co.,Ltd.China,qjaqqwcw@126.com) for technical support of transcriptomic analysis.
Declaration of competing interest
The authors declare that they have no conflict of interest.
Appendicesassociated with this paper are available on http://www.ChinaAgriSci.com/V2/En/appendix.htm
 Journal of Integrative Agriculture2021年8期
- Journal of Integrative Agriculture的其它文章
- Lignin metabolism regulates lodging resistance of maize hybrids under varying planting density
- Adoption of small-scale irrigation technologies and its impact on land productivity:Evidence from Rwanda
- Comparison of grain yield and quality of different types of japonica rice cultivars in the northern Jiangsu plain,China
- Natural nematicidal active compounds:Recent research progress and outlook
- lmproving grain appearance of erect-panicle japonica rice cultivars by introgression of the null gs9 allele
- Comparative transcriptome analysis of different nitrogen responses in low-nitrogen sensitive and tolerant maize genotypes
