The turbidite-contourite-tidalite-baroclinitehybridite problem:orthodoxy vs.empirical evidence behind the“Bouma Sequence”
G.Shanmugam
Abstract The underpinning problems of deep-water facies still remain unresolved. (1) The Tb, Tc, and Td divisions of the turbidite facies model, with traction structures, are an integral part of the “Bouma Sequence” (Ta, Tb, Tc, Td, Te).However, deposits of thermohaline contour currents, wind-driven bottom currents, deep-marine tidal currents, and baroclinic currents (internal waves and tides) also develop discrete rippled units, mimicking Tc. (2) The application of “cut-out” logic of sequences, which was originally introduced for the “Bouma Sequence”, with sharp basal contacts and sandy divisions containing well-developed traction structures, to muddy contorts with gradational basal contacts and an absence of well-developed traction structures is incongruent. (3) The presence of five internal divisions and hiatus in the muddy contoured facies model is in dispute. (4) Intersection of along slope contour currents with down slope sediment-gravity flows, triggering hybrid flows, also develops traction structures. (5) The comparison of genuine hybrid flows with down slope flow transformation of gravity flows is inconsistent with etymology of the term “hybrid”. (6) A reexamination of the Annot Sandstone at the Peira Cava type locality in SE France fails to validate either the orthodoxy of five internal divisions of the “Bouma Sequence” or their origin by turbidity currents. For example, the “Ta” division is composed of amalgamated units with inverse grading and floating mudstone clasts, suggesting a mass-transport deposit (MTD). The “Tb” and “Tc” divisions are composed of double mud layers and sigmoidal cross bedding, respectively, which suggest a tidalite origin. (7) Although it was reasonable to introduce a simplistic “Bouma Sequence” in 1962, at a time of limited knowledge on deep-water processes, it is obsolete now in 2021 to apply this model to the rock record amid a wealth of new knowledge. (8)The disconnect between 12 observed, but questionable, modern turbidity currents and over 10,000 interpreted ancient turbidites defies the doctrine of uniformitarianism. This disconnect is attributed to routine application of genetic facies models, without a pragmatic interpretation of empirical data. (9) A suggested solution to these problems is to interpret traction structures in the sedimentary record pragmatically on the basis of empirical field and experimental evidence, without any built-in bias using facies models, such as the “Bouma Sequence”. (10) Until reliable criteria are developed to distinguish traction structures of each type of bottom currents based on uniformitarianism, a general term “BCRS” (i.e., bottom-current reworked sands) is appropriate for deposits of all four kinds of bottom currents.
Keywords: Turbidity currents, Contour currents, Tidal currents, Internal waves and tides, Hybrid flows, The Bouma Sequence, BCRS (i.e., bottom-current reworked sands)
1 Introduction
The geologic importance of downslope and alongslope process and their deposits in deep-water environments was discussed in detail using 540 case studies by Shanmugam(2021a). One of the important lessons learned from these modern and ancient case studies was that intersection of downslope and alongslope processes on continental margins is common(Fig.1).As a consequence,bottom-current reworked sands(BCRS)constitute an important deep-water facies (Hsü 1964; Hubert 1964; Klein 1966, 1975; Hollister 1967; Mutti, 1992; Shanmugam et al. 1993, 2009; Stanley 1993; Ito 2002; Shanmugam 2006, 2008, 2012a, 2021a;Martin-Chivelet et al. 2008; Mutti and Carminatti 2011; de Castro et al. 2020; Fonnesu et al. 2020; Fuhrmann et al.2020, among others). However, recognition of BCRS has been immersed in controversies. The main reason is that intervals of BCRS with traction structures may also be interpreted as turbidites based on the application of the turbidite facies model (Bouma 1962), which is popularly known as the“Bouma Sequence”.Although turbidites,contourites, tidalites, baroclinites, and hybridites are distinctly different depositional facies,they all have one thing in common, they all exhibit traction structures. So, how to distinguish one facies from the other? This problem has never been addressed to date.Therefore,the primary objective of this review is to identify key problem areas that pose direct challenges in distinguishing individual depositional facies. I also try to offer possible solutions, when conditions permitting.
This review is based on global case studies from the North Atlantic, Mid-Pacific Mountains, Gulf of Cadiz,Gulf of Mexico, Offshore Nigeria, Bay of Bengal, and the Annot Sandstone in the Maritime Alps that served as the type locality for the development of the “Bouma Sequence”.
2 History and methods
In proceeding with this review, it is necessary to establish a historical basis for my skepticism of the Bouma Sequence (Bouma 1962)and to list critical core, outcrop,and experimental studies that I carried out in collaboration with others as a student, as a Mobil employee, and as a consultant (Shanmugam 2021a). I described deepwater strata using conventional cores and outcrops (1:20 to 1:50 scale), which include 32 deep-water sandstone petroleum reservoirs worldwide, totaling over 10,000 m in cumulative thickness during 1974-2011. The basic premise in the following discussion is a combination of process sedimentology and physical oceanography.
· During my tenure with Mobil Research and Development Corporation in Dallas, Texas (1978-2000), both Sanders (1965) and Klein (1966) had immense influence on my thinking of deep-water processes and the Bouma Sequence (Shanmugam 1997,2000a,b,2018a;Shanmugam and Moiola 1995).
· Since 1965, my skepticism of the Bouma Sequence and the role of turbidity currents as a major depositional mechanism began to take roots. This skepticism coupled with early research by Hsü(1964), Hubert (1964), Klein (1966), Hollister (1967),Van der Lingen (1969), and my own global studies of case studies, have gradually diverted my attention away from the Bouma Sequence and turbidity currents,and towards bottom currents.
· Shanmugam’s paper “High-density turbidity currents:are they sandy debris flows?” published in the Journal of Sedimentary Research in 1996, has achieved the status of the single most cited paper in sedimentological research published in three world-renowned periodicals -- Journal of Sedimentary Research, Sedimentology, and Sedimentary Geology --during the survey period of 1996-2003(Source:International Association of Sedimentologists Newsletter,August 2003)(Racki 2003).
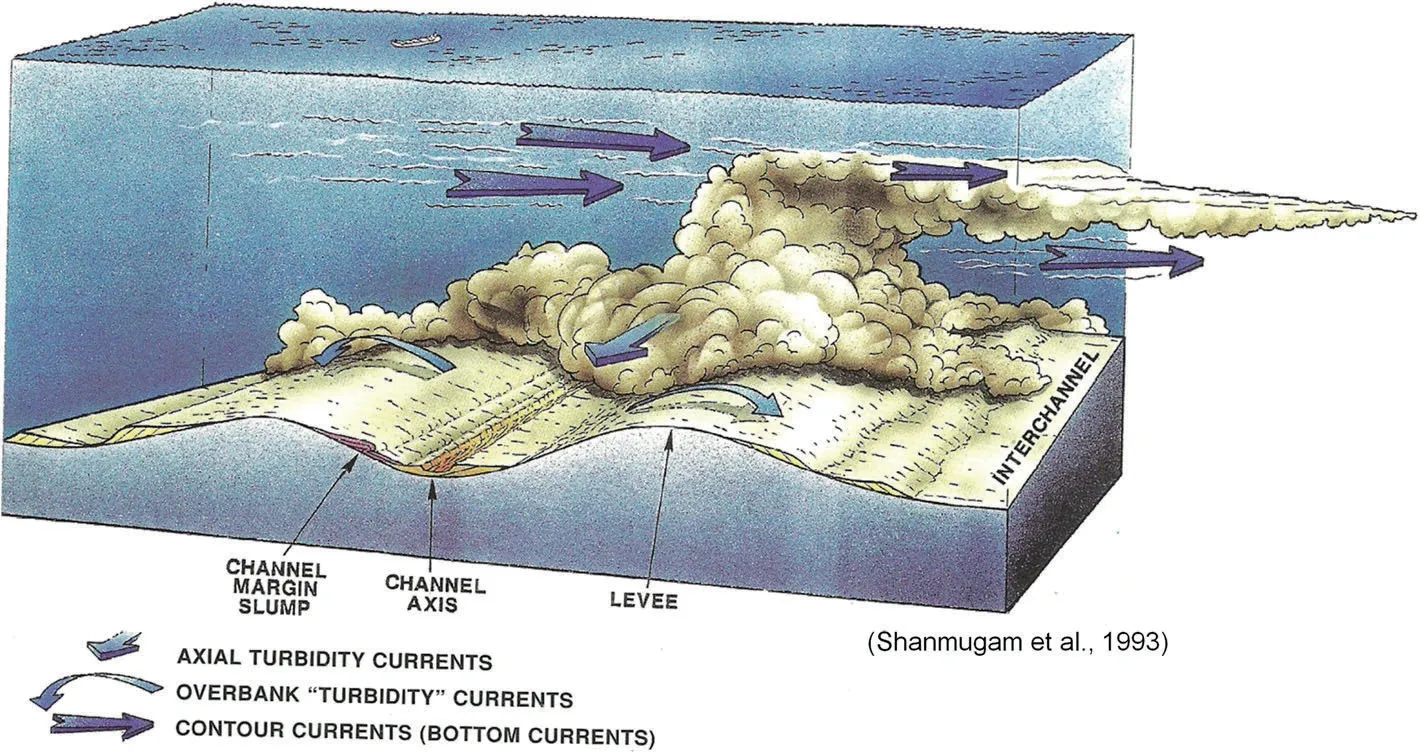
Fig. 1 Conceptual model showing the spatial relationship between downslope gravity flows (e.g., turbidity currents) and along-slope contour currents,which result in hybrid flows.From Shanmugam et al.(1993). With permission from AAPG
JSR Editorial Board (1996): Editor:John B.Southard.Associate Editor: G. A.Smith. Reviewers: D. J. W.Piper and G. Postma. This manuscript received mixed reviews, however,the editor decided to publish.Mobil Reviewers: R. J. Moiola, J. E. Damuth,and R. B.Bloch.
2.1 Ouachita flysch, USA
The Pennsylvanian Jackfork Group in the Ouachita Mountains of Arkansas and Oklahoma has conventionally been interpreted by many workers (e.g., Briggs and Cline 1967) as a classic flysch sequence dominated by turbidites in a submarine fan setting. In a detailed field and laboratory study of the Ouachita flysch, representing a ten-year research, however, we have concluded that normal size grading and Bouma Sequences, indicative of turbidite deposition, are essentially absent in these sandstone beds (Shanmugam and Moiola 1995). These beds are mass-transport deposits (MTD) and bottom-current reworked sands (BCRS). Our (Shanmugam and Moiola 1995) controversial reinterpretation had resulted in five lively discussions by some of the leading authorities in the field, which included the following researchers:
· A.H. Bouma, M.B.DeVries, and C.G. Stone, (1997)
· J. L. Coleman, (1997)
· A.E. D’Agostino and D.W. Jordan(1997)
· D.R. Lowe (1997)
· R.M. Slatt, P.Weimer, and C.G. Stone (1997)
We promptly responded to all criticisms (Shanmugam and Moiola 1997). These academic discussions had resulted in 42 printed pages in the AAPG Bulletin. It is worth noting that no other paper in the AAPG Bulletin history (1917-present) has generated this much controversy.
2.2 Basin-floor fans, North Sea
In the AAPG Bulletin, Shanmugam et al. (1995) published an article entitled “Basin-floor fans in the North Sea, sequence stratigraphic models vs. sedimentary facies”. This regional study was based on rigorous examination of nearly 12,000 ft (3658 m) of conventional slabbed core from Paleogene and Cretaceous deep-water sandstone reservoirs. These cores represent 50 wells in 10 different petroleum fields in the North Sea and adjacent regions. These reservoirs are composed predominantly of mass-transport deposits (sandy slumps and debrites). Classic turbidites are extremely rare (<1%), which contradict the conventional sequence-stratigraphic tenets of basinfloor fans (Vail et al. 1991). Our reinterpretation of massive sands in the North Sea (Shanmugam et al.1995) also had resulted in a major discussion by world-renowned sedimentologists composed of Hiscott et al. (1997) and in a reply by Shanmugam et al.(1997). This debate was mostly about high-density turbidity currents.
AAPG Bulletin Editorial Board(1995):Elected Editor:K.T.Biddle.Reviewers:R.M.Mitchum and W.J.Devlin.
Mobil Reviewers (London, UK): R. E. Dunay and K. P.Dean.
Mobil Reviewers (Dallas, Texas): S. H. Gabay, H. C.Olson, J. F. Sarg, and R. J. Moiola. Because of the economic implications of the above study to the petroleum industry, the U.K. Department of Trade and Industry(DTI) invited G. Shanmugam to organiize two “Deepwater sandstone reservoir workshops” at DTI Core Store in Edinburgh, Scotland (1995 and 1997). These two workshops, attended by geoscientists from Europe, Africa, and the USA, utilized seismic data, wireline-log data, and conventional cores from the Faeroe area,North Atlantic (see Shanmugam et al. 1995).
2.3 Ewing Bank,Gulf of Mexico (Mobil research)
The Ewing Bank article entitled “Process sedimentology and reservoir quality of deep-marine bottom-current reworked sands (sandy contourites): an example from the Gulf of Mexico” by Shanmugam et al. (1993) was the first detailed study of BCRS with implications for hybrid flows. The manuscript for AAPG Bulletin was reviewed by C. D. Hollister who introduced the term “contourite”.
2.4 The Annot Sandstone: Peira-Cava Area, Maritime Alps,SE France (Mobil research)
To understand the nature of normal grading and related complexities in the Annot Sandstone, Mobil Oil Company initiated a field research project with three geologists (R.J. Moiola, R.B. Bloch, and G. Shanmugam) in 1998. We reexamined in detail 12 sandstone units of the Annot Sandstone, exposed along a road section in the Peira-Cava Area of French Maritime Alps. This is the same road section that Bouma (1962), p. 93, his Fig. 23)and Pickering and Hilton (1998) used in their studies.Results of our reexamination of the Annot Sandstone were published (Shanmugam 2002, 2003, 2006, 2016a,2021a, 2021b).
2.5 Flume experiments on sandy debris flows
A Mobil-funded experimental flume study was carried out at St. Anthony Falls Laboratory (SAFL), University of Minnesota (1996-1998) under the direction of Professor G.Parker to evaluate the fluid dynamical properties of sandy debris flows. Results were published in two major articles (Shanmugam 2000a; Marr et al.2001).
3 The turbidite problem
3.1 Definitions of turbidites
Turbidites are defined as deposits of turbidity currents(Sanders 1965). In this article, a turbidity current is a sediment-gravity flow (Middleton and Hampton 1973) with Newtonian rheology(Dott Jr.1963)and turbulent state(Sanders 1965) in which sediment is supported by turbulence and from which deposition occurs through suspension settling (Dott Jr. 1963; Sanders 1965; Middleton and Hampton 1973; Shanmugam 1996, 1997), which results in normal grading. Turbidity currents are characterized by low sediment concentration, commonly below 9% sediment concentration by volume (Bagnold 1962). They tend to spread out and develop fan geometry; compared with tongue geometry of debrites (Shanmugam 2021a). Turbidity currents exhibit unsteady and nonuniform flow behavior, and they are surge-type waning flows. As they flow downslope, turbidity currents invariably entrain ambient fluid (seawater) in their frontal head portion due to turbulent mixing (Allen 1985). With increasing fluid content, plastic debris flows may tend to become Newtonian turbidity currents. However, not all turbidity currents evolve from debris flows. Some turbidity currents may evolve directly from sediment failures. Although turbidity currents may constitute a distal end-member in basinal areas, they can occur in any part of the system (i.e., shelf edge, slope, and basin).
3.2 The Bouma Sequence and related turbidite problems
In his seminal publication on turbidite fans, Bouma(Bouma 1962, p. 98) used the term “cone” for describing submarine fans.Bouma(1962)proposed the most convincing link between the turbidite facies model with five divisions, namely Ta, Tb, Tc, Td, and Te (Fig. 2a), and their areal distribution on a submarine fan(Fig.2b).In illustrating the lateral distribution of the five divisions (i.e., the Bouma Sequence) on a submarine fan (Fig. 2b), Bouma(Bouma 1962,p.98)stated that“It can be understood that at the outset that the deposit of a large turbidity current contains all the components belonging to the complete sequence type Ta-Te. The coarseness of the material and the velocity decrease in the current direction. Also the thickness of the graded interval decreases in the downstream direction...”. It is worth noting that the Bouma Sequence is meaningful as a predictive model only if it adherers to the Walther’s Law of Facies,which means that the five internal divisions must represent a continuous state of deposition without a break in deposition or a hiatus(Middleton 1973;Walker 1992).
Despite the popularity of the Bouma Sequence, major problems still remain unresolved. For example:
1) Since the introduction of the Bouma Sequence in 1962, there has been a steady influx of concepts proposing alternative origins of the basal Ta division (Fig. 3).These processes include the following:
· antidune (Harms and Fahnestock 1965);
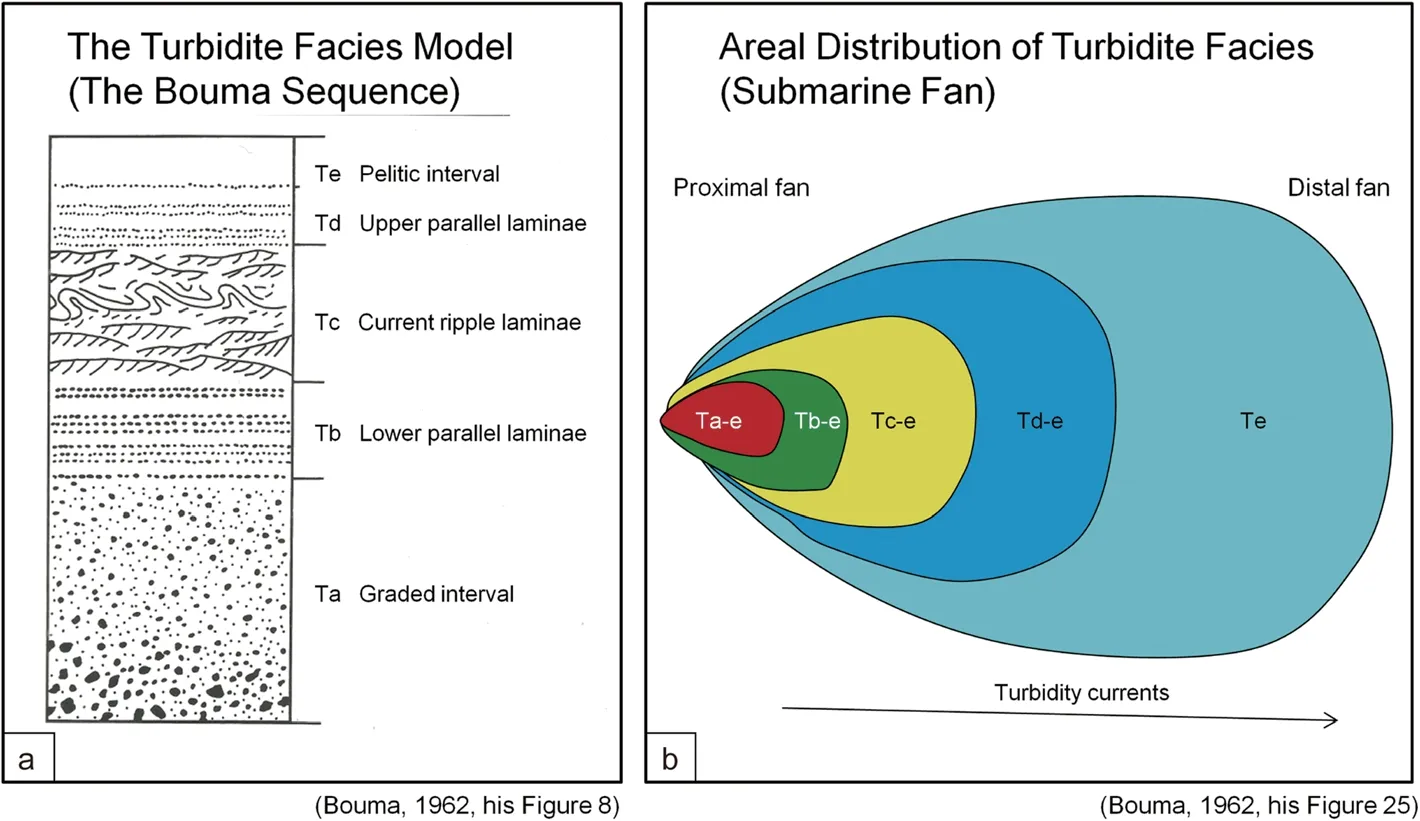
Fig. 2 The first turbidite-fan link proposed by Bouma (1962). a The turbidite facies model with five internal divisions (Ta, Tb, Tc, Td, and Te). This vertical facies model is commonly known as “the Bouma Sequence.”; b Areal distribution of turbidite facies in a submarine fan (after Bouma 1962;after Shanmugam 2016a,b)
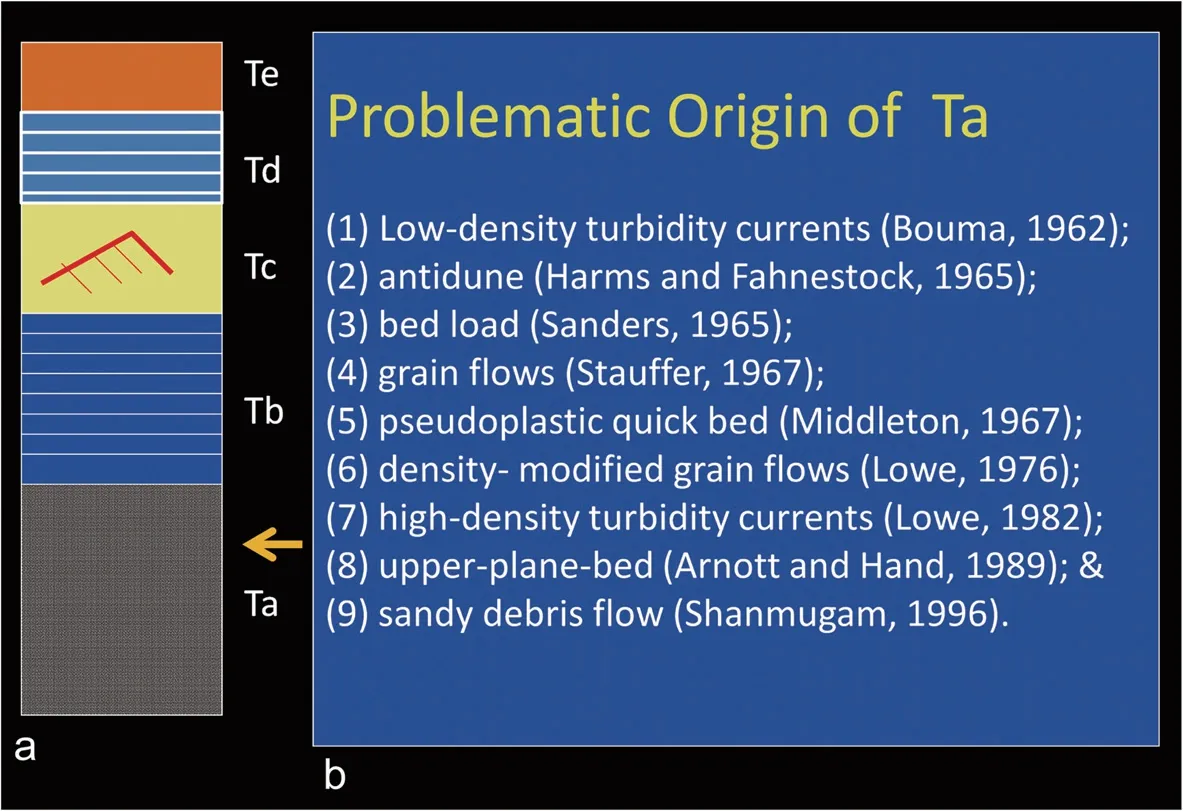
Fig.3 a The Bouma Sequence with five divisions;b Alternative origins of Ta proposed by various authors
· bed load (Sanders 1965);
· grain flows (Stauffer 1967);
· pseudoplastic quick bed (Middleton 1967);
· density-modified grain flows (Lowe 1976);
· high-density turbidity currents (Lowe 1982);
· upper-plane-bed (Arnott and Hand 1989);
· sandy debris flow (Shanmugam 1996).
2) The Tb, Tc, and Td divisions of the turbidite facies model, with traction structures, are an integral part of the “Bouma Sequence” (Fig. 4a). However, the transition from Ta to Tb is still in dispute (Fig. 4b).There is no theoretical or experimental validation of this transition (Leclair and Arnott 2005).
3) Despite their popularity in both academia (Postma and Cartigny 2014) and in the petroleum industry(Hoyal et al. 2014), the Froude fan models with implications for traction structures, suffer for the following reasons:
· No one has documented supercritical turbidity currents,which Postma and Cartigny (2014), their Fig. 3) equate with high-density (stratified) turbidity currents(Postma et al. 1988), in the modern oceans.

Fig.4 a The Bouma Sequence with five divisions;b The problematic transition from Ta to Tb as recognized by Leclair and Arnott(2005)
· There is no experimental basis for Froude fans(Kostic and Parker 2007).
4) Discrete rippled bed could be assumed to be “Tc” of the Bouma Sequence and could be interpreted to be a turbidite under the“base-and top-cut-out Bouma Sequence”logic of Walker (1965) (Fig. 5b). However, based on strict observational methods, the same discrete rippled beds could alternatively be interpreted as contourites(Hollister 1967), tidalites (Klein 1975), baroclinites(i.e., deposits of internal waves and tides) Lonsdale et al. 1972), hybridites or bottom-current reworked sands (Shanmugam et al. 1993) (Fig. 5c). At present,the “cut-out” logic has infiltrated literature not only on turbidites, but also on contourites (e.g., Stow and Smillie 2020, their Fig. 13).
5) Finally, the broad application of the term “turbidite”to deposits of all sediment-gravity flows, which includes debris flows (Fig. 6), by Mutti et al. (1999) is a lingering problem. This problem is further compounded by classifying turbidity currents and debris flows as“hyperpycnal flows” based on provenance (i.e., land derived) (Fig. 7) by Zavala (2020). The reason is that debris flows and turbidity currents have traditionally been classified as sediment-gravity flows based on sediment-support mechanisms by Middleton and Hampton (1973).
4 The bottom-current reworked sands (BCRS)problem
The term BCRS refers to traction (bedload) processes associated with deep-water bottom currents (Shanmugam et al. 1993). In deep-water environments, there are four types of bottom currents, namely (1) thermohalineinduced geostrophic bottom currents, (2) wind-driven bottom currents, (3) deep-water tidal bottom currents,and (4) internal waves and tides (baroclinic currents)(Shanmugam 2008). In addition, hybrid flows are also considered as a type of bottom currents. These bottom currents should not be confused with turbidity currents.The broad term “BCRS” is useful to represent all types of reworked sands by bottom currents in deepwater environments, irrespective of their origin (e.g.,thermohaline, wind-driven, tide-driven, or internalwave driven).
4.1 Wind-driven bottom currents
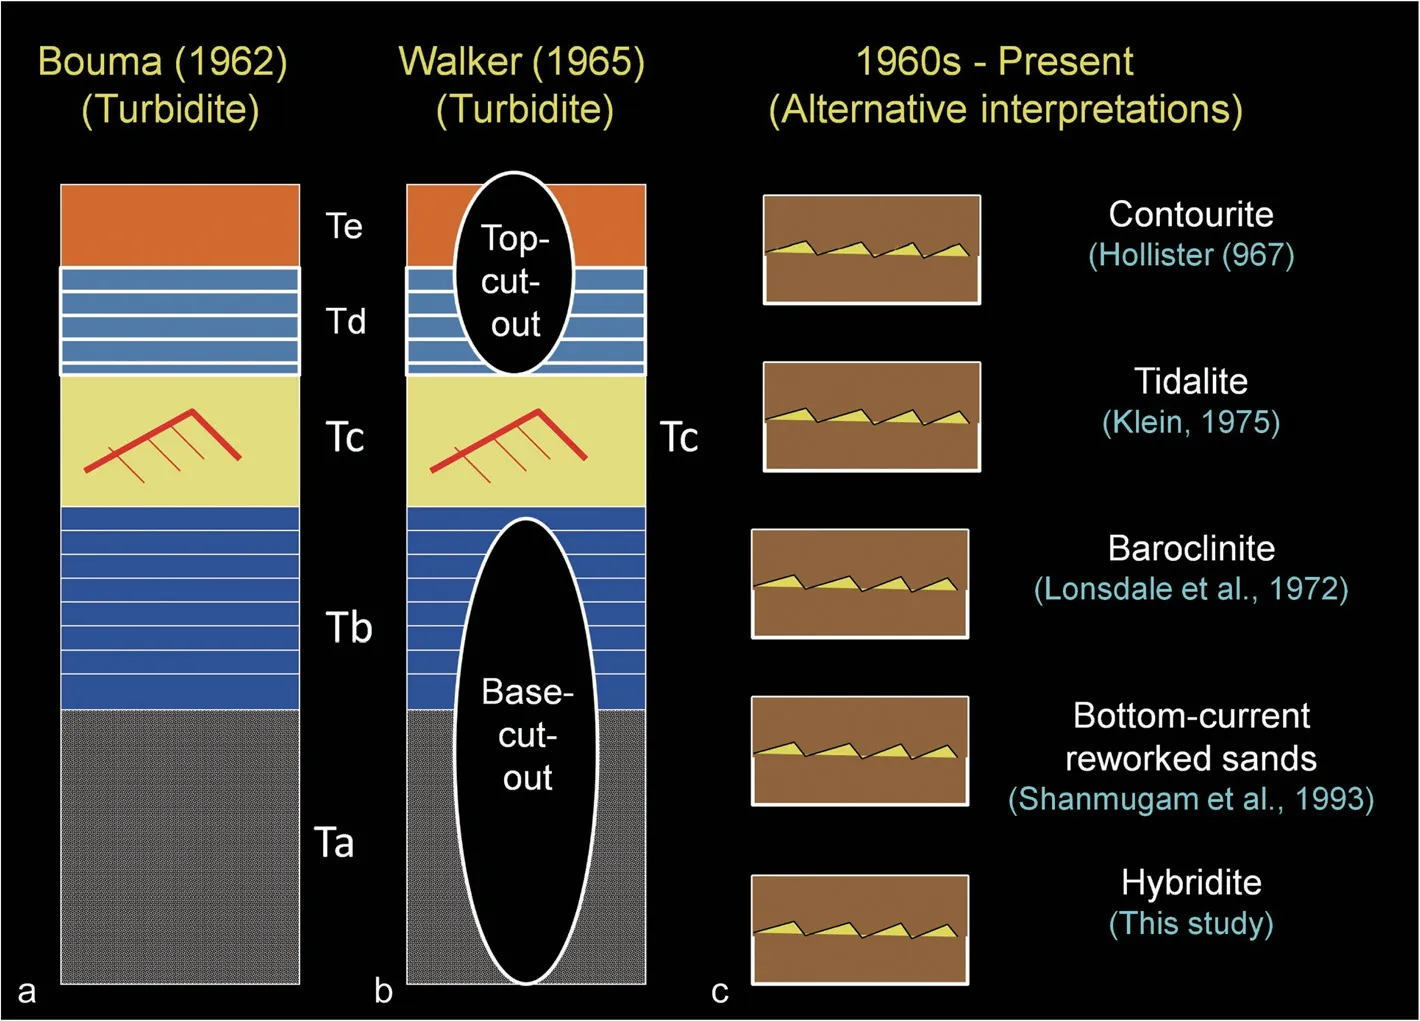
Fig. 5 a The Bouma Sequence with five divisions; b The cut-out logic proposed for explaining isolated occurrence of rippled Tc division by Walker (1965); c Alternative origins of discrete ripple chain that mimic Tc. From Shanmugam (2021a). Elsevier. Copyright Clearance Center’s RightsLink: Licensee:G. Shanmugam.License Number:4990381054264.License Date:January 15, 2021
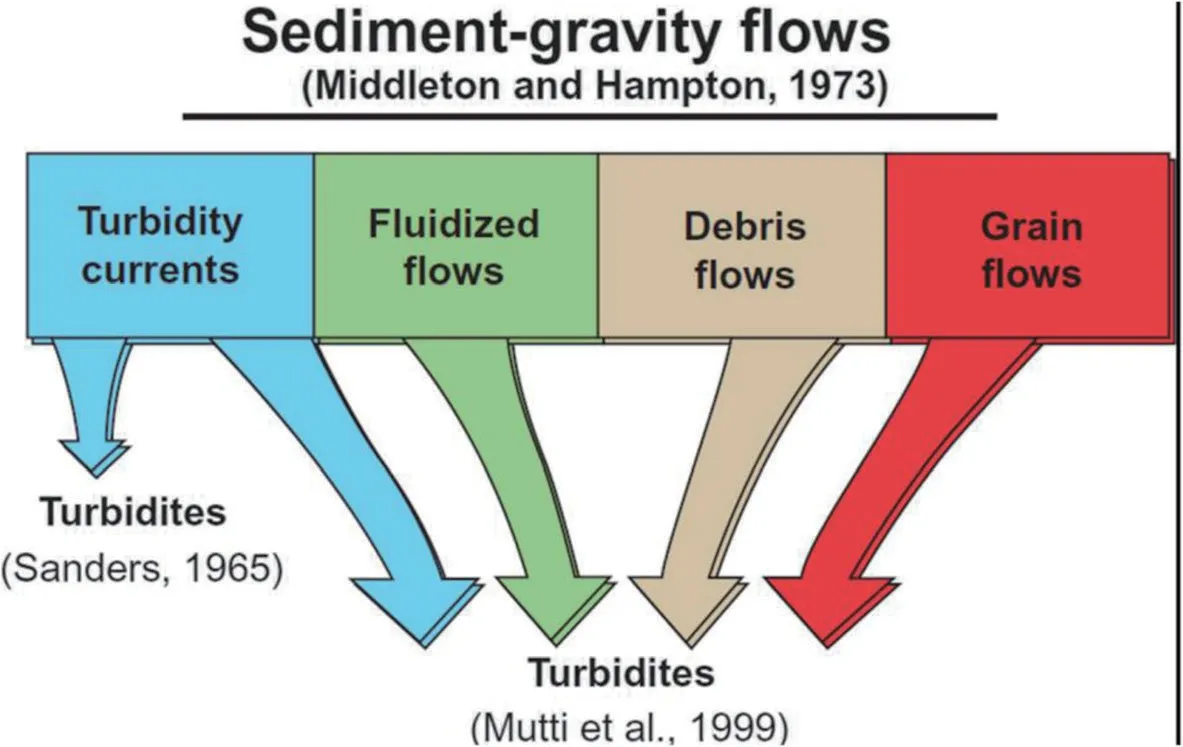
Fig. 6 Original classification of sediment-gravity flows by Middleton and Hampton (1973). Confusing application of the term “turbidites” to deposits of all four types by Mutti et al. (1999), without regard for fluid mechanics. I have adopted Sanders’ (1965) classification in which only deposits of turbidity currents are considered as turbidites. From Shanmugam (2002). With permission from Elsevier. Copyright Clearance Center’s RightsLink: Licensee:G. Shanmugam.License Number:4987691025593 License Date:January 14, 2021
The Gulf Stream is a powerful, warm, and swift Atlantic Ocean current that originates at the tip of Florida and follows the eastern coastlines of the United States and Newfoundland before crossing the Atlantic Ocean. The Gulf Stream proper is a western-intensified current, largely driven by wind stress (Wunsch 2002). The Loop Current in the eastern Gulf of Mexico is a wind-driven surface current (Pequegnat 1972), and it is genetically linked to the Gulf Stream in the Atlantic Ocean. The Loop Current enters the Gulf of Mexico through the Yucatan Strait as the Yucatan Current; it then flows in a clockwise loop in the eastern Gulf as the Loop Current, and exits via the Florida Strait as the Florida Current (Nowlin Jr. and Hubert 1972; Mullins et al. 1987). Finally, this current merges with the Antilles Current to form the Gulf Stream (Shanmugam 2021a). The Loop Current also propagates eddies into the north-central Gulf of Mexico, where the Ewing Bank area is located, a case study used in the original article (Shanmugam et al. 1993). The eastern part of Gulf of Mexico is strongly influenced by the Loop Current and in some cases the Loop Current influences the intensity of cyclones causing related bottom currents (Shanmugam 2012a, 2017).
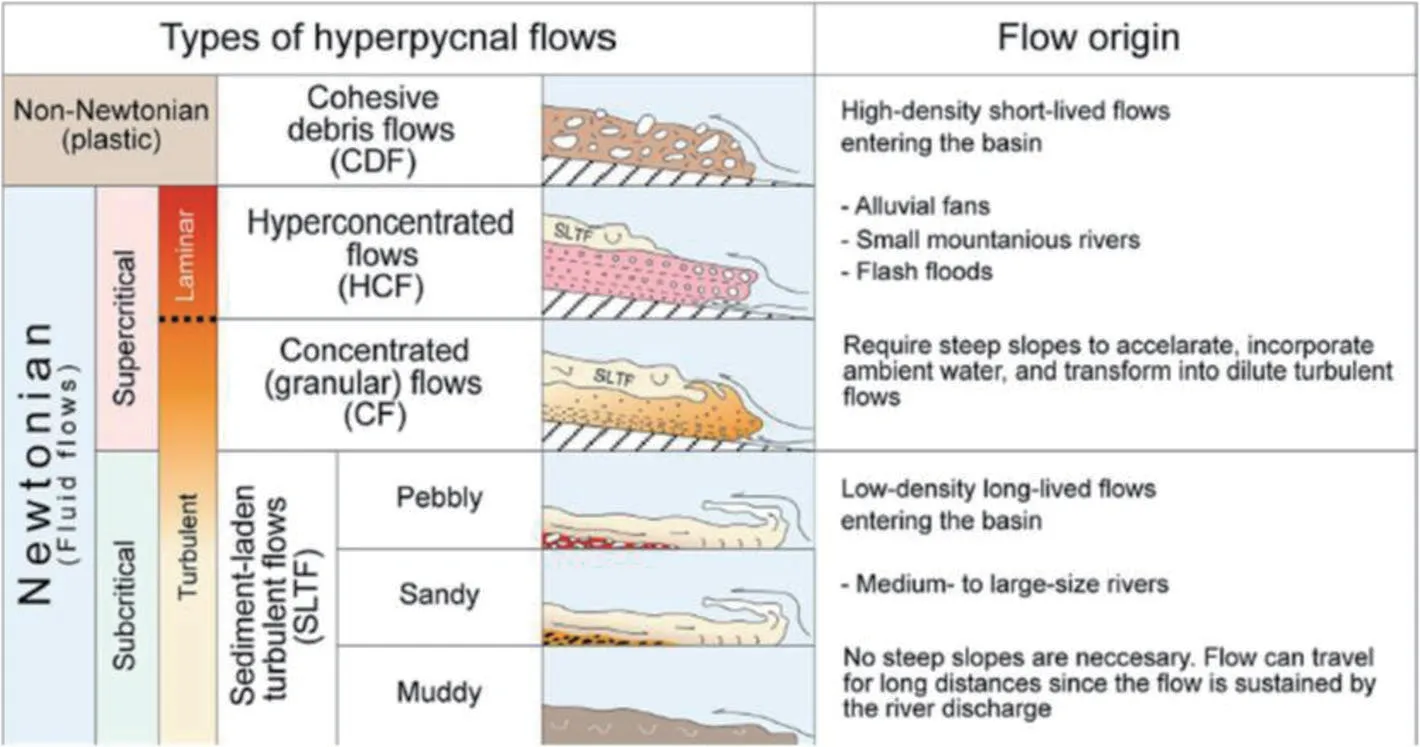
Fig. 7 Classification of debris flows and turbidity currents as “hyperpycnal flows” by Zavala (2020), causing confusion. Note that sediment-gravity flows were originally classified on the basis of sediment-support mechanisms by Middleton and Hampton (1973), whereas Zavala (2020) classifies types of sediment-gravity flows as “hyperpycnal flows” on the basis of their provenance (i.e., land derived). See other problems associated with hyperpycnal flows addressed by Shanmugam 2018b and 2019. References: Mutti(2009 and 2020).Figure from Zavala (2020).Open Access
Velocities in eddies that have detached from the Loop Current have been recorded as high as 200 cm·s-1at a depth of 100 m (Cooper et al. 1990).Current-velocity measurements, bottom photographs,high-resolution seismic records, and GLORIA sidescan sonar records indicate that the Loop Current influences the seafloor at least periodically in the Gulf of Mexico (Pequegnat 1972). Computed flow velocities of the Loop Current vary from nearly 100 cm·s-1at the sea surface to more than 25 cm·s-1at 500 m water depth (Nowlin Jr. and Hubert 1972). This high surface velocity suggests a wind-driven origin for these currents. Flow velocities measured using a current meter reach up to 19 cm·s-1at a depth of 3286 m (Pequegnat 1972). Kenyon et al. (2002)reported 25 cm·s-1current velocity measured 25 m above the seafloor. Such currents are capable of reworking fine-grained sand on the seafloor. Current ripples, composed of sand at a depth of 3091 m on the seafloor (Fig. 8), are the clear evidence of deep bottom-current activity in the Gulf of Mexico today(Pequegnat 1972). These current ripples are draped by thin layers of mud. If these mud drapes on sand ripples were preserved in the rock record, they would be termed “mud-offshoots” (Shanmugam et al. 1993).
4.2 Ewing Bank Block 826 Field: a case study
The Ewing Bank Block 826 Field is located nearly 100 km off the Louisiana coast in the northern Gulf of Mexico (Shanmugam et al. 1993). It contains hydrocarbon-producing clastic reservoir sands that have been interpreted as bottom-current reworked sands(Shanmugam et al. 1993). Cores from the Gulf of Mexico show a variety of traction structures that include horizontal rhythmic layers (Fig. 9), low-angle crosslaminae (Fig. 9b), ripple cross laminae, flaser bedding(Fig. 10), mud offshoots in ripples, eroded and preserved ripples, and inverse grading (Shanmugam et al. 1993).Most of the features are interpreted as the products of deposition by traction or combined traction and suspension. As with deposits of contour-following thermohaline currents, it is impossible to establish that a given sedimentary structure in the rock record was originated by wind-driven bottom currents,without establishing the paleo-water circulation pattern independently. Again, the general term “bottomcurrent reworked sands” is appropriate in many cases.
Sand layers with traction structures occur in discrete units (Fig. 11), but not as part of a vertical sequence of structures formed by a single process, such as the Bouma Sequence.Because traction structures are also observed in deposits of different bottom currents, caution must be exercised in classifying a deposit as a “contourite” based solely on traction structures without independent evidence for contour-following bottom currents in the area.This Ewing Bank case study was the basis for proposing the original hybrid flow depositional model(Fig.1).
5 The contourite problem
Contourites represent deposits of thermohaline-induced geostrophic contour currents (Hollister 1967). Recent contributions on contourites and bottom-current reworked sands (BCRS) were made by de Castro et al.(2020),de Weger et al.(2020),Hüneke et al.(2020),Hovikoski et al.(2020),Rodrigues et al.(2021),among others.I have discussed various problems associated with contourites elsewhere (Shanmugam 2016b; Shanmugam 2017).The following specific problems are worth noting.
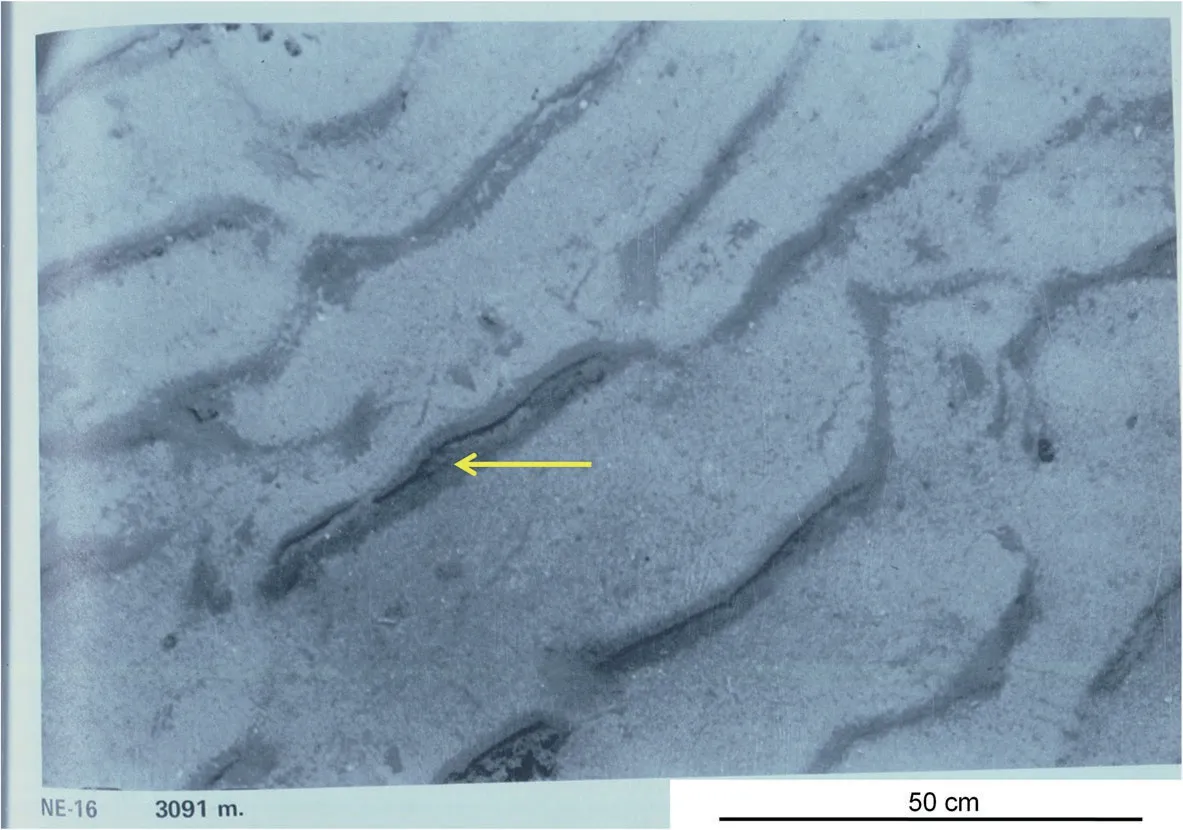
Fig. 8 Undersea photograph showing possible mud-draped (arrow) current ripples at 3091 m water depth in the Gulf of Mexico. Similar mud drapes may explain the origin of mud offshoots observed in the core. A current measuring nearly 18 cmˑs-1 was recorded on the day this photograph was taken. Current flow was from upper left to lower right. Bar scale is 50 cm. Alaminos Cruise 69-A-13, St. 35. Source: Photograph originally published by Pequegnat(1972). From Shanmugam (2012a), with permission from Elsevier
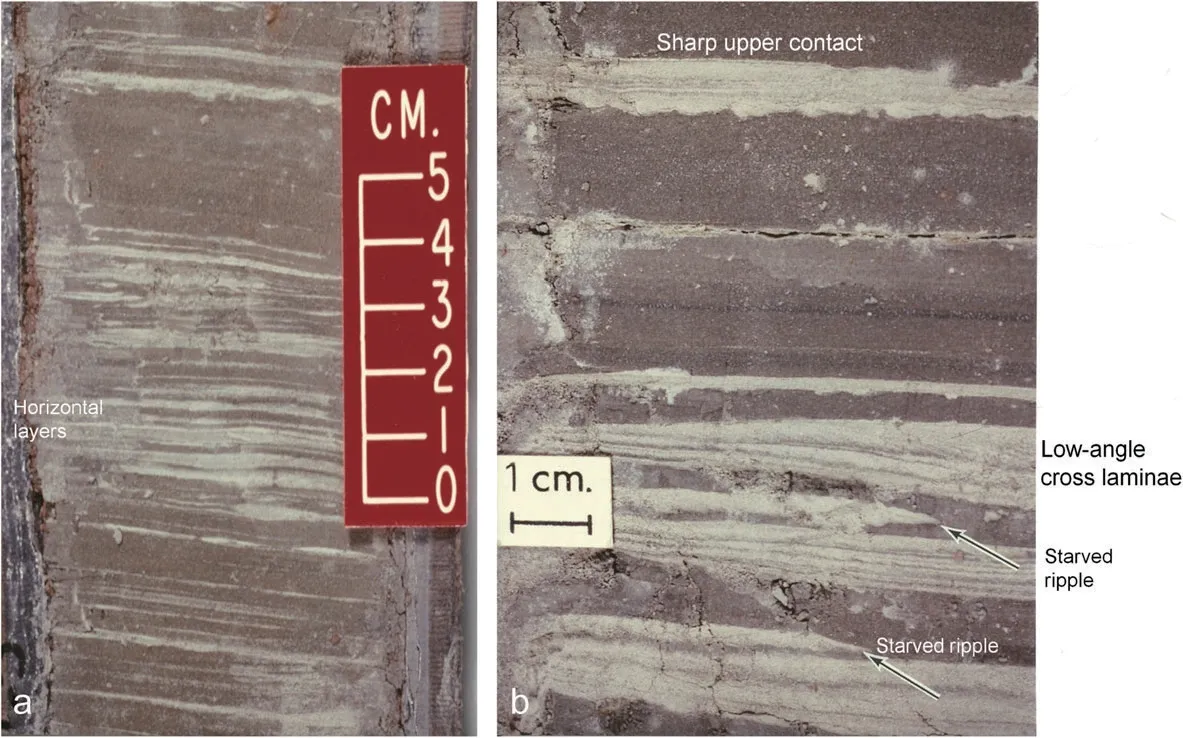
Fig. 9 a Core photograph showing rhythmic layers of sand and mud. Middle Pleistocene, Gulf of Mexico; b Core photograph showing discrete thin sand layers with sharp upper contact. Traction structures include horizontal laminae, low-angle cross-laminae, and starved ripples (arrows).Dip of cross-laminae to the right suggests current from left to right. Note rhythmic occurrence of sand and mud layers. Middle Pleistocene, Gulf of Mexico.Source:a- From Shanmugam (2012a).b-After Shanmugam et al.(1993),with permission from AAPG
· Historically, the contourite facies model of Gonthier et al. (1984) has been represented as follows.
1) Gonthier et al. (1984), their Fig. 12) originally published the model without five internal divisions of C1-C5 and without hiatus at the bottom of the sandy interval(C5)in the middle(Fig.12b).
2) Stow and Faugères (2008), their Fig. 13. 9)published the model with five internal divisions of C1-C5 and with hiatus at the bottom of the sandy interval (C5) in the middle (Fig. 12a). One wonders as to why it took 24 years for Stow and Faugères (2008) to recognize five internal divisions and hiatus, if these features have been an integral part of contourite facies since its emplacement?
3) Faugères and Mulder (2011), their Fig. 3.18)published the model without five internal divisions of C1-C5 and without hiatus at the bottom of the sandy interval in the middle (C3).
4) Rebesco et al. (2014), their Fig. 24) published the model with five internal divisions of C1-C5 and with hiatus at the bottom of the sandy interval in the middle (C3).
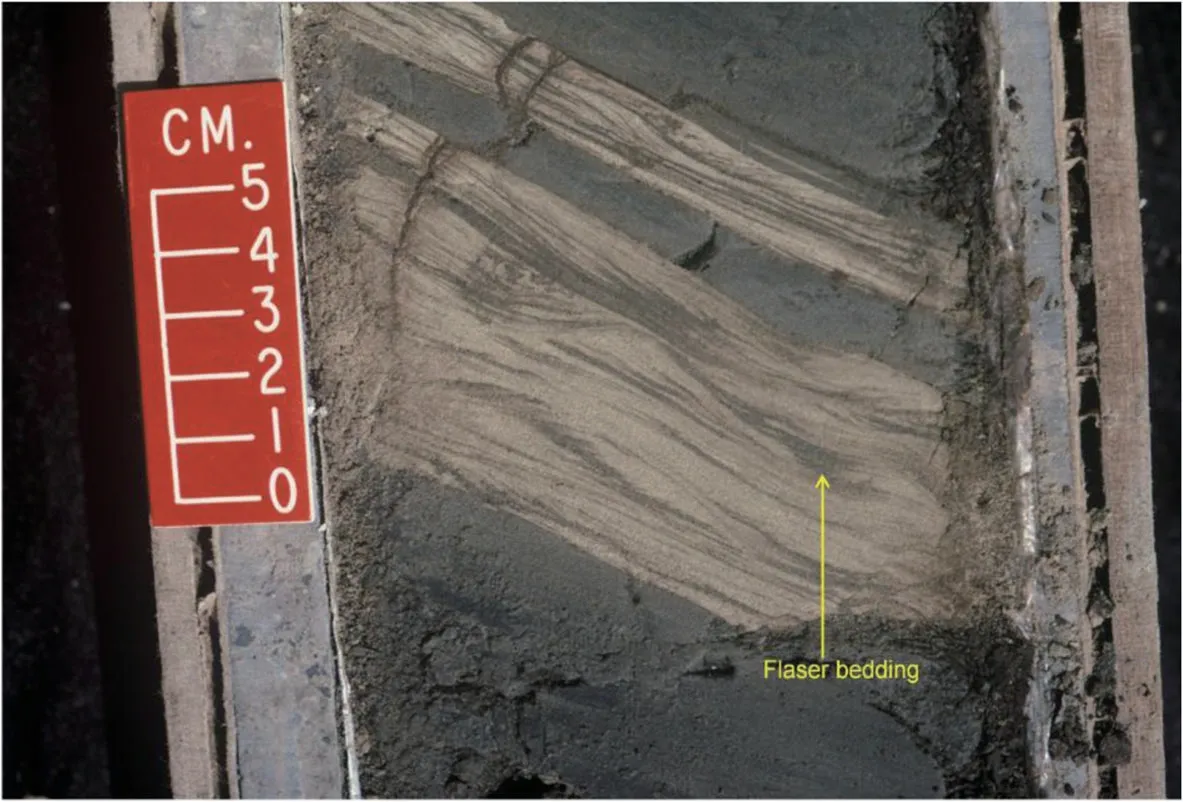
Fig. 10 Core photograph showing flaser bedding. Note the presence of mud in ripple troughs (arrow). Upper Pliocene, Ewing Bank Block 826,Gulf of Mexico.After Shanmugam et al.(1993),with permission from AAPG

Fig. 11 Summary of traction features interpreted as indicative of deep-water bottom-current reworking by all types of bottom currents. Each feature occurs randomly and should not be considered as part of a vertical facies model.After Shanmugam et al.(1993),with permission from AAPG
5) Most recently, Stow and Smillie (2020), their Fig. 13) published the model with five internal divisions of C1-C5 and without hiatus at the bottom of the sandy interval in the middle (C3).

Fig. 12 a Revised contourite facies model with five divisions (C1-C5) proposed by Stow and Faugères (2008); b Original contourite facies model by Gonthier et al. (1984). Note that the original authors of this model did not include the five internal divisions (Gonthier et al. 1984 or Faugères et al.(1984). The most recent version of this model by Faugères and Mulder (2011) contains neither the five internal divisions nor the hiatuses in the C3 division (red arrow inserted in this article). This figure was originally from Faugères et al. (1984), with permission from the Geological Society of America.Note that the ascending five divisions C1 to C5 in Fig.12a were inadvertently listed in descending order in Shanmugam(2021a,his Fig.8.17).

Fig. 13 Summary of facies showing lenticular laminae in sandy Facies 4. IODP 339, Gulf of Cadiz. From de Castro et al., (2020). Copyright Clearance Center’s RightsLink:Licensee:G.Shanmugam. License Number: 4987651006557.License Date:January 14,2021
The reason for such inconsistent and confusing portrayal of the same model has never been explained by the authors.Consequently,if the hiatus was truly present in the middle of the contourite facies model, then the contourite facies model is obsolete. This is because the model cannot function as a predictor, a requirement of a facies model (Walker 1992). The presence of hiatuses precludes application of the Walther’s Law for predicting facies (Middleton 1973).
· de Castro et al. (2020) reported BCRS in the Gulf of Cadiz. Although they reported starved ripples in the sandy intervals, but were unable to document with the empirical photographic evidence due to poor preservation of primary sedimentary structures in unconsolidated sediment intervals. It is important,however, to note that these authors were able to document wispy and lenticular laminae in their Facies 4 of sandy intervals (Fig. 13), indicating bottom-current reworking in a sand-starved system.
· Stow and Smillie (2020) proposed large-scale cross bedding in medium- to coarse-sands for “The sandy contourite family” (Fig. 14) based on the study of Brackenridge et al. (2018). However,Brackenridge et al. (2018) did not document large-scale cross bedding in contourite sands.Stow and Smillie (2020) may prove to be correct because the likelihood of developing large-scale cross bedding by bottom currents is much greater than by turbidity currents.
· Stow and Smillie (2020), their Fig. 13) proposed base-cut-out contourites and top-cut-out contourites (Fig. 15). These authors define these “cut-out”sequences from a pure descriptive point of view as they do not discuss the processes behind their formation. Walker (1965) originally applied this“cut-out” logic to the Bouma Sequence. This approach assumes that the entire sequence was present at the time of deposition, but portions were cut-out for any number of subjective viewpoints. If this were true, one could assume anything to arrive at a desired interpretation, such as turbidite, contourite,tidalite, or seismite! Process interpretations must be based on observations and not on assumptions. In practice, it is difficult to verify one’s assumptions without objective criteria.
· Lovell and Stow (1981, p. 349) conclude that“Contourite: a bed deposited or significantly reworked by a current that is persistent in time and space and flows along slope in relatively deep-water (certainly below wave base). The water may be fresh or salt; the cause of the current is not necessarily critical to the application of the term.” I have italicized the last phrase to emphasize the point that contourites can be produced by any kind of bottom current (Fig. 16), irrespective of their origin (i.e., thermohaline, wind,tide, or baroclinic). This confusion can be avoided by restricting the use of the term “contourite”exclusively to deposits of thermohaline contour currents (Hollister 1967).
6 The tidalite problem
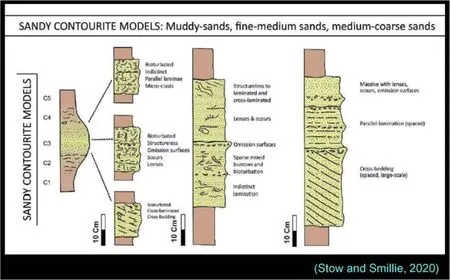
Fig.14 Sandy contourite facies models with large-scale cross bedding proposed by Stow and Smillie(2020).Open Access
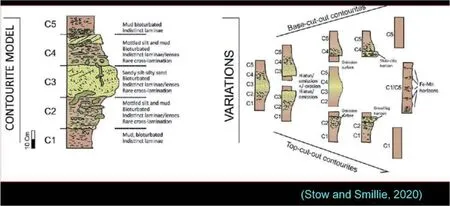
Fig.15 The cut-out logic applied to contourite facies model by Stow and Smillie(2020).Open Access
Tidalites are deposits of tidal currents (Klein 1971).Tidal currents operate both in shallow-water and deep-water environments (Klein 1975; Shepard et al.1979; Shanmugam 2003). Shepard et al. (1979) measured current velocities in 25 submarine canyons worldwide at water depths ranging from 46 to 4200 m by suspending current meters, usually 3 m above the sea bottom. Shepard et al. (1979) also documented systematically that up- and down-canyon currents closely correlated with timing of tides. These canyons include the Hydrographer, Hudson, Wilmington, and Congo (Zaire) in the Atlantic Ocean; and the Monterey, Hueneme, Redondo, La Jolla/Scripps, and Hawaii canyons in the Pacific Ocean. Maximum velocities of up- and down-canyon currents commonly ranged from 25 to 50 cm·s-1. Keller and Shepard(1978) reported velocities as high as 7075 cm·s-1, velocities sufficient to transport even coarse-grained sand, from the Hydrographer Canyon. In the Niger Delta area of West Africa, five modern submarine canyons (Avon, Mahin, Niger, Qua Iboe, and Calabar)have been recognized. In the Calabar River, the tidal range is 2.8 m and tidal flows with reversible currents are common (Allen 1965). In the Calabar Estuary,maximum ebb-current velocities range from 60 to 280 cm·s-1, and flood current velocities range from 30 to 150 cm·s-1. These velocities are strong enough to transport particles of sand and gravel size. The Calabar Estuary has a deep-water counterpart that cuts through sediments of the outer shelf and slope, forming the modern Calabar Submarine canyon. Thus, as they do in the Congo Canyon to the south, tidal currents are likely to operate in the Calabar and Qua Iboe Canyons.

Fig. 16 Four types of bottom currents and their depositional facies. The facies term “contourites” is appropriate only for deposits of thermohaline-driven geostrophic contour currents in deep-water environments, but not for deposits of other three types of bottom currents (i.e.,wind, tide, or baroclinic). Note that Lovell and Stow (1981) applied the term “contourites” broadly to deposits of all types of bottom currents.Source:From Shanmugam(2016b),with permission from Elsevier.References: Klein(1970 and 1971).
In an ancient submarine canyon recognized in the Edop Field, Nigeria, cores show well-developed double mud layers (DML), indicating tidal deposition (Fig, 17).DMLs are unique to shallow-water tidal environments and have been ascribed to alternating ebb and flood tidal currents with extreme time-velocity asymmetry in subtidal settings (Visser 1980). Double mud layers are sedimentary structures of tidalite origin which have been recognized in both shallow-water subtidal environments(Visser 1980) and in deep-water facies (Shanmugam 2003). In the Krishna-Godavari Basin, Bay of Bengal,cored intervals from canyon-fill facies exhibit both double mud layers and discrete ripple chains (Fig. 18).These discrete ripples were not considered as top- and base-cut out Bouma Sequence by Shanmugam et al.(2009). Such a pragmatic tidal interpretation, without the application of the Bouma Sequence, is consistent with regional setting.
7 The baroclinite problem
Baroclinites represent deposits of baroclinic currents induced by internal waves and tides (Shanmugam 2013a).Gill (1982) discussed the basic differences between barotropic (surface) waves that develop at the air-water interface and baroclinic (internal) waves that develop at the water-water interface (Fig. 19). Fluid parcels in the entire water column move together in the same direction and with the same velocity in a surface wave,whereas fluid parcels in shallow and deep layers of the water column move in opposite directions and with different velocities in an internal wave (Fig. 19). The surface displacement and interface displacement are the same for a surface wave, while the interface displacements are large for internal wave. Although the free surface movement associated with the baroclinic mode is only 1/400 of the interface move movement, this is still sufficient for baroclinic motions to be detectable by seasurface changes (Wunsch and Gill 1976).
7.1 Empirical data

Fig. 17 Core photograph showing double mud layers (DML), indicative of deposition by deep-marine tidal currents, in a submarine-canyon setting.Pliocene strata,Edop Field,offshore Nigeria.Source:From Shanmugam(2003), with permission from Elsevier. Copyright Clearance Center’s RightsLink: Licensee:G. Shanmugam.License Number:4987661039509.License Date:January 14, 2021

Fig. 18 a Sedimentological log showing alternation of sand (lithofacies 3) and mudstone (lithofacies 4) intervals with continuous presence of double mud layers(DML)and discrete ripple chains.Note muddy debrite facies(Lithofacies 2) near the bottom.Wentworth grain-size classes:C=clay; S=silt; VFS=very fine sand; FS=fine sand; MS=medium sand; b; Lithofacies 3 core photograph showing rhythmic bedding (rhythmites)and double mud layers (DML, arrows) in sand. N=neap (thin) bundle; S=spring (thick) bundle. Note that one could designate ripple chains as Tc, DML intervals as Tb and the massive sand unit (between scale divisions 2 and 4 cm) as Ta using the Bouma Sequence; however, Shanmugam et al.(2009)did not.Source:Core photograph from Shanmugam et al.(2009), with permission from SEPM
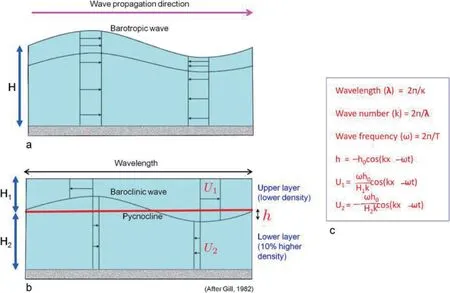
Fig. 19 a Top panel: barotropic (surface) wave showing the movement of fluid parcels in the entire water column (H) in the same direction with the same velocity (short horizontal arrows); b Bottom panel: baroclinic (internal) wave showing the fluid-parcel movement in upper (H1) and lower (H2) layers in opposite directions (short horizontal arrows) with different velocities (U1 and U2); c Explanation of symbols. Source: Modified after Gill(1982).After Shanmugam(2013a)AAPG
Apel (2002), Apel et al. (2006), and Jackson (2004) have published comprehensive accounts of internal waves and tides worldwide. A sedimentologic and oceanographic review is provided by Shanmugam (2013a). Internal waves are gravity waves that oscillate along oceanic pycnoclines. Internal tides are internal waves with a tidal frequency. Internal solitary waves (i.e., solitons), the most common type, are commonly generated near the shelf edge (100-200 m in bathymetry) and in the deep ocean over areas of seafloor irregularities, such as midocean ridges, seamounts, and guyots. Empirical data from 51 locations (Shanmugam 2013a) in the Atlantic,Pacific, Indian, Arctic, and Antarctic oceans reveal that internal solitary waves travel in packets, such as the one in the Andaman Sea (Fig. 20). Internal waves commonly exhibit (1) higher wave amplitudes (5-50 m) than surface waves (<2 m), (2) longer wavelengths (0.5-15 km)than surface waves (100 m), (3) longer wave periods (5-50 min) than surface waves (9-10 s), and (4) higher wave speeds (0.5-2 m· s-1) than surface waves (25 cm· s-1).Maximum speeds of 48 cm· s-1for baroclinic currents were measured on guyots.
7.2 Depositional framework
A preliminary depositional framework is proposed for continental slopes, submarine canyons, and guyots(Fig. 21a). To date, the only convincing photographic documentation of sedimentary bedforms, attributed to internal waves and internal tides, in modern deepmarine environments has been from seamounts and guyots in the Pacific Ocean (Menard 1952; Lonsdale et al. 1972). These photographs are the only empirical foundation for gaining insights into depositional processes (e.g., traction vs. suspension) associated with internal waves and internal tides. Photographic data show the occurrence of discrete ripple chains (Fig. 21b). However, core-based sedimentological studies of modern sediments emplaced by baroclinic currents on continental slopes, in submarine canyons, and on submarine guyots are lacking. There are no cogent sedimentologic or seismic criteria for distinguishing ancient baroclinites.
7.3 Academic discussions
There have been attempts to interpret ancient strata with traction structures as deposits of internal waves and internal tides (i.e. baroclinites) (Gao and Eriksson 1991; Gao et al. 1998; He et al. 2011; Pomar et al. 2012;Gao et al. 2013). However, these interpretations and related issues were the subjects of lively debates (He et al.2012; Pomar et al. 2013; Shanmugam 2012b, 2013b,2014a, 2014b; Gao et al. 2014; Dunham and Saller 2014).At present, our understanding of the origin of traction structures in deep-water environments is in a state of flux.
8 The Annot Sandstone: orthodoxy vs. empirical evidence
Bouma (1962) used the Annot Sandstone [Grès d’ Annot Formation (Eocene-Oligocene)], exposed in the Peira-Cava Area and vicinity of the French Maritime Alps(Fig. 22), for developing the first turbidite facies model.Later, he extended his study to Switzerland and other areas in Europe. Bouma (1962) documented his field observations in eight photographic plates, seven of which contain outcrop photographs from the Peira Cava type locality(Plates A,B,C,D,E,F,and H)and the eighth one contains outcrop photographs from Switzerland(Plate G).
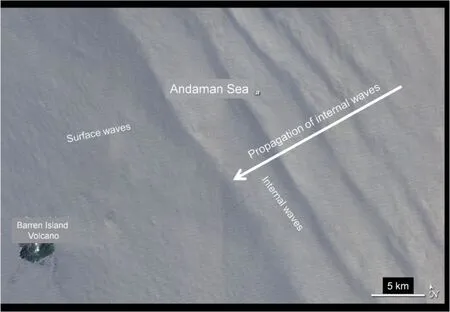
Fig. 20 Satellite image showing both surface waves (near horizontal faint waves, left) and internal waves (long diagonal waves, right) on the Indian Ocean near Andaman Islands. White arrow shows propagation of internal wave packet in a south-westerly direction. Large internal waves have a wavelength of 5 km. Note the active Barren Island Volcano emitting steam on the lower left of the image. This Advanced Land Imager(ALI) on the Earth Observing 1 satellite acquired the image on March 6, 2007. NASA Earth Observatory image created by Jesse Allen and Robert Simmon, using EO-1 ALI data provided courtesy of the NASA EO-1 team. Caption by Holli Riebeek. NASA Earth Observatory image credit, http://earthobservatory.nasa.gov/IOTD/view.php?id=44567. Accessed July 12,2011

Fig.21 a Conceptual oceanographic and sedimentologic framework showing deposition from baroclinic currents on continental slopes,in submarine canyons, and on guyots. On continental slopes and in submarine canyons, deposition occurs in three progressive stages: (1) incoming internal wave and tide stage, (2) shoaling transformation stage, and (3) sediment transport and deposition stage. Continental slopes and submarine canyons are considered to be environments with high potential for deposition from baroclinic currents. In the open ocean, baroclinic currents can rework sediments on flat tops of towering guyot terraces,without the need for three stages required for deposition on continental slopes.In this model,basin plains are considered unsuitable environments for deposition of baroclinic sands. Not to scale; b Cross-profile showing asymmetrical dunes and asymmetrical ripples(i.e.,ripple chains)observed from side-looking sonar and photographic evidence obtained from the terrace of the Horizon Guyot,Mid-Pacific Mountains.Bathymetry of bedforms:1630-1632 m.Dune heights(H)were estimated from the length of acoustic shadows.Source:a From Shanmugam(2013a),with permission from AAPG.b Redrawn from Lonsdale et al.(1972).After Shanmugam(2013a),AAPG
Although the Annot Sandstone appears to show normal grading, detailed description offers a different story (Shanmugam 2002). Simply put, the Bouma Sequence is an extremely diluted version that excludes all the important details from a process sedimentological point. The key features that contradict the conventional turbidite interpretation of the Annot Sandstone are:
· Basal contorted layers (Shanmugam 2002): The contorted intervals beneath the sandstone are interpreted to be a product of shearing and slumping produced by stress exerted by overriding mass flows. Large-scale shear structures have been reported in the Annot Sandstone in other areas as well (Clark and Stanbrook 2001).
· Basal inverse grading (Fig. 23c): A combined mechanism of dispersive pressure, matrix strength,hindered settling, and buoyant lift would explain the development of inverse grading. The inverse grading is attributed to a plastic debris-flow origin.
· Basal normal grading: This is a rare feature. Because these sandstone intervals are not only amalgamated but composed of complex internal features, no simple origin is meaningful.
· Lenticular layers (Shanmugam 2002): Lenticular layers with quartzose granules in sandstone may be interpreted as deposits of non-Newtonian flows with strength. The presence of planar fabric supports the laminar state of flow (Fisher 1971). By simply describing these sedimentary features without using the “Bouma” divisions, lenticular layers would be interpreted to be deposits of plastic laminar flows.
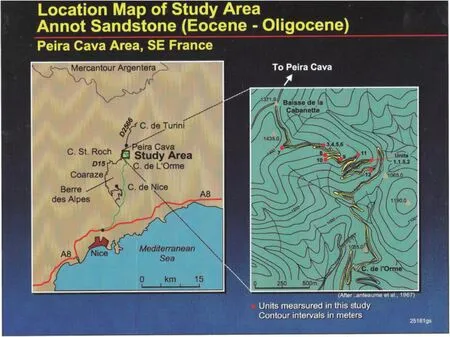
Fig. 22 Location map showing sites of 12 measured units of the Annot Sandstone (Eocene-Oligocene) along a road section, near Peira Cava area,French Maritime Alps, during a field study by Mobil Oil Company. Bouma (1962), p.93, his Fig. 23) used this road section, among others, in his Ph.D.study of the Annot Sandstone and other formations in developing the turbidite facies model.Unit 9 in this study corresponds to Bouma’s Layer No.1 in his measured section K (see Bouma 1962, Enclosures I in inside pocket of back book cover).An outcrop photograph of Layer No.1 is published by Bouma (1962, see his Plate H1). Each unit in this study represents a major sandstone body and closely related minor sandstone and mudstone beds.Map is simplified after Lanteaume et al.(1967).Figure from Shanmugam(2002).With permission from Elsevier.Copyright Clearance Center’s RightsLink:Licensee:G.Shanmugam.License Number:4987691025593 License Date:January 14,2021

Fig. 23 a Sedimentological log of amalgamated sandstone Unit 7 showing basal inverse grading overlain by an interval of complex normal grading with floating granules and mudstone clasts, parallel laminae, and lenticular layers. Note sudden increase in grain size at 5 m. Note conventional description using Bouma notations (Ta, Tb, and Tc); b Outcrop photograph of Unit 7 showing sheet-like geometry; c Outcrop photograph of Unit 7 showing basal inversely graded interval in coarse-to granule-grade sandstone;d Outcrop photograph of a pocket of clasts and matrix in the middle of the unit. Arrow shows stratigraphic position of photo; e Outcrop photograph of Unit 7 showing a floating mudstone clast in the middle of the unit.Annot Sandstone (Eocene-Oligocene), Peira Cava area, French Maritime Alps. SE France. Figures from Shanmugam (2002). With permission from Elsevier.Copyright Clearance Center’s RightsLink:Licensee:G.Shanmugam.License Number:4987691025593 License Date:January 14,2021

Fig. 24 a Sedimentological log of amalgamated sandstone Unit 8 showing basal inverse grading, floating armored mudstone balls, lenticular layers, and pockets of gravel. Note conventional description using Bouma notations (Ta); b mudstone clasts in fine-grained sandstone. Arrow shows stratigraphic position of photo. Annot Sandstone (Eocene-Oligocene), Peira Cava area, French Maritime Alps. SE France. Figures from Shanmugam (2002). Copyright Clearance Center’s RightsLink: Licensee: G. Shanmugam. License Number: 4987691025593 License Date: January 14,2021
· Pockets of gravel (Fig. 24): Unit 8 with pockets of gravel cannot be explained by a single waning turbidity current. The depositing flow must have had enough flow strength to support granules near its upper part. The pockets of gravels near the top of the bed reflect freezing of a plastic flow.
· Floating armored mudstone balls (Shanmugam 2002): Stanley et al. (1978) interpreted armored mudstone balls in the Annot Sandstone to be associated with the filling of canyons by mass flows.
· Floating mudstone clasts (Fig. 23e): In Unit 7,intervals of floating mudstone clasts are interpreted as deposits of plastic debris flows. A combination of dispersive pressure, matrix strength, hindered settling, and buoyant lift is proposed as the cause of floating clasts.
· Floating quartzose granules (Shanmugam 2002):Even a single floating quartzose granule in a quartzrich sandy matrix is of rheologic and hydrodynamic significance. In the Annot Sandstone, quartzose granules floating in a sandy matrix are evidence that the flow had strength and that settling of the grains is hindered. Because Unit 7 contains floating quartz granules and amalgamation surfaces, it has been interpreted to be deposits of multiple episodes of sandy debris flows and bottom currents.
· Double mud layers (DMLs, Fig. 25): There are no analogous divisions for DMLs in the Bouma Sequence. In the Annot Sandstone, DMLs have been interpreted to be deposits of deep-marine tidal currents(Shanmugam 2003).Hydrodynamically,turbidity currents are unsuitable to explain the DML.
· Sigmoidal cross-bedding (Fig. 26): There are no analogous divisions for sigmoidal cross-bedding in the Bouma Sequence. These bedforms, typical of tidal currents in estuarine environments (Terwindt 1981; Banerjee 1989; Shanmugam et al. 2000), can also be attributed to deep-marine tidal currents in submarine canyons (Shanmugam 2003).
Although the turbidite facies model advocates a simple origin by turbidity currents, details of the Annot Sandstone clearly reveal a complex origin by processes involving slumping, sandy debris flows, and tidal bottom currents. Deposits of true turbidity currents, with normal grading, are extremely rare. Our observations are nothing new. Stanley (1963, 1975)was one of the early researchers to recognize the importance of slumps, debris flows, grain flows, and liquefied flows in the origin of the Annot Sandstone,SE France. In a recent comprehensive study, Etienne et al. (2012, p. 3) have acknowledged the complex origin of the Annot Sandstone. The Annot Sandstone units are up to 1200 m thick (Inglis et al. 1981) and composed of siliciclastic deposits resulting from various types of gravity flows such as slumps, debris flows (Hampton 1972; Middleton and Hampton 1973), slurry flows (Lowe and Guy 2000), high-density turbidity currents (Kuenen 1966; Middleton 1967;Lowe 1982; Postma 1986) also defined as sandy debris flows (Shanmugam 1996, 2000a) and low-density turbidites (Bouma 1962; Middleton and Hampton 1973)i.e. classical turbidites.
The problem remains as to how one can explain deepwater units that show a partial Bouma Sequence composed of a basal massive division and an upper parallellaminated division. In areas in which both downslope sandy debris flows and alongslope-bottom currents operate concurrently, the reworking of the tops of sandy debris flows by bottom currents may be expected. Such a scenario could generate a basal massive sand division and an upper reworked division, mimicking a partial Bouma Sequence (Shanmugam 2006, 2012a). The reworking of deep-water sands by bottom currents has been suggested by other researchers as well (e.g., Stanley 1993; Ito 2002; de Castro et al. 2020; Hovikoski et al.2020; Fonnesu et al. 2020;Fuhrmann et al. 2020).

Fig. 26 a Sedimentological log of an amalgamated sandstone unit showing sigmoidal cross-bedding with tangential toeset. Note inverse grading below and lenticular layers above; b Outcrop photograph showing sigmoidal cross-bedding (top arrow) with tangential toeset in coarseto granule-grade sandstone. Note mud/mica-draped (dark colored) stratification. Note inversely graded gravel layer below (bottom arrow). Arrows show stratigraphic position of photo. Annot Sandstone (Eocene-Oligocene), Peira Cava area, French Maritime Alps. From Shanmugam (2002).Copyright Clearance Center’s RightsLink:Licensee:G.Shanmugam. License Number:4987691025593 License Date:January 14,2021
In summary, the most influential turbidite facies model (i.e., the Bouma Sequence) was acceptable in 1962 when our understanding of deep-water processes was limited. However, given the cumulative knowledge that we have acquired during the past 58 years, such as double mud layers (Fig. 17) and sigmoidal cross-bedding(Fig. 26) in the Annot Sandstone, the Bouma Sequence is obsolete at present (2021).Under this umbrella of new knowledge, the Bouma Sequence can no longer function as a genetic facies model for turbidity currents and their deposits. Although it was reasonable in 1962, at a time of limited knowledge on deep-water processes, to introduce a simplistic turbidite facies model, it is unreasonable to apply this model to the rock record at present(2021). Even 28 years ago, in questioning the very foundation of the “Bouma Sequence”, Middleton (1993, his p.90-91) stated in a cautionarynote: “It must be emphasized that gravity flows are a very complex class of flows,more complex for example than open-channel flows such as rivers(which might be considered to be merely one extreme end member of the gravity flow spectrum).No geologists would expect that rivers could deposit only a single type of sediment bed, characterized by a single suite of sedimentary structures and textures—yet many geologists have such a notion about turbidites.” Middleton's (1993)insightful skepticism about the “Bouma Sequence” has been and will always be relevant and true.
9 The hybridite problem
9.1 Etymology and genetic terms
The term “hybridite” refers to an amalgamated and reworked offspring deposit of two hydrodynamically different flow types, such as downslope sandy debris flows and alongslope contour currents (i.e., hybrid flows).However, some authors (e.g., Houghton et al. 2009; Fonnesu et al. 2015, 2016, 2018; Yang et al. 2018) equate hybrid flows (Fig. 27) with flow transformation in gravity flows (Fig. 28). This controversy necessitates the basic description of the term “hybrid” etymologically.
According to the Cambridge Dictionary, the term “hybrid” (Fig. 29)represents the hybrid offspring byproducts of two different plants, animals, or other entities(https://dictionary.cambridge.org/dictionary/learnerenglish/hybrid, accessed June 2, 2020). In animals, for example, a mule is the hybrid offspring of a male donkey and a female horse. By contrast, a debris flow often transforms downslope into a stratified flow with a lower debris-flow layer and an upper turbidity-current layer(Fig. 28), as documented by Norem et al. (1990). Our flume experiments (Fig. 30) also documented flow transformation from a debris flow into a downslope stratified lower debris-flow layer and an upper turbidity current layer (Fig. 31). In other words, the concept of “hybrid”begins with two different parent species yielding a single hybrid offspring, whereas the concept of “flow transformation” begins with a single parent flow that transforms downslope into two sediment-gravity flows. The other confusion is that hybrid flows are synonymously used for density-stratified high-density turbidity currents(HDTC) (Fig. 32b). Controversies surrounding HDTC were discussed by Shanmugam (1996).
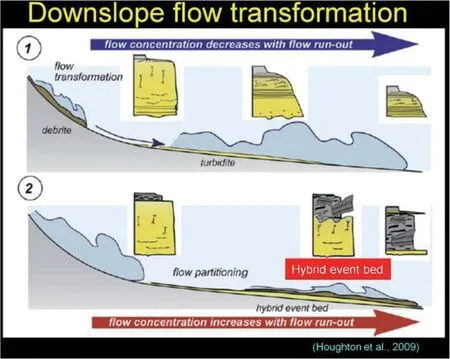
Fig. 27 Diagram showing “hybrid event beds” developed during flow transformation. Note that hybrid event beds do not follow the conventional etymological explanation of the term “hybrid”. From Houghton et al. (2009). Additional labels by G. Shanmugam. Copyright Clearance Center’s RightsLink:Licensee:G.Shanmugam. License Number: 4986790141728,License Date:January 12,2021
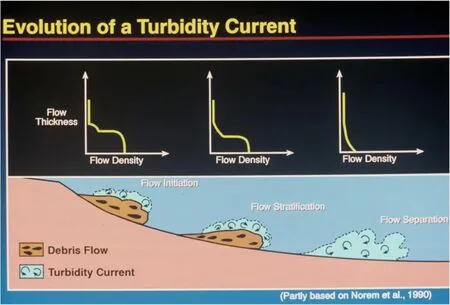
Fig. 28 Conceptual diagram showing downslope flow transformation of gravity flows. Note stratified flows with lower debris flow and upper turbidity current leading to downslope formation of a turbidity current. Original figure from Norem et al. (1990). Modified figure from Shanmugam et al. (1997). Elsevier. Copyright Clearance Center’s RightsLink: Licensee: G. Shanmugam. License Number: 4990281253589. License Date:January 15,2021
In maintaining this conceptual clarity, the continued misapplication of hybrid concept for flow transformation is misleading (Fig. 33). Although flow transformation is a real phenomenon, it cannot be recognized in the ancient sedimentary record with objective criteria (Shanmugam 2012a). In discussing the physics of debris flows,Iverson (1997) states, ‘When mass movement occurs, the sediment-water mixtures transform to a flowing, liquidlike state, but eventually they transform back to nearly rigid deposits.’ Although such transformations can occur during transport, evidence for such flow transformations cannot be inferred from the final deposit. We may never resolve this issue of flow transformation because it would be like attempting to establish the previous life history of a human being after reincarnation!

Fig. 29 Difference between the terms “hybrid” (Top) and “flow transformation” (Bottom). The term “hybrid” by definition represents two different parental species that yield a third hybrid offspring. By contrast, flow transformation begins with a single parental species that yields two downslope transformed species. Letters A, B, and C refer to different species or entities. From Shanmugam (2021a). Copyright Clearance Center’s RightsLink: Licensee: G. Shanmugam. License Number: 4986760519280. License Date: January 12, 2021 References: Fallgatter et al. (2017) and Talling(2013).

Fig. 30 Laboratory flume used in experiments of sandy debris flows at St. Anthony Falls Laboratory, University of Minnesota, Minneapolis. Photo by G.Shanmugam. See Shanmugam(2000a)
Based on experiments and field observations, the term“hybrid flows” is explained in this article to represent the intersection of two different processes, such as alongslope bottom currents (e.g., contour currents) intersecting with downslope sediment-gravity flows (e.g., sandy debris flows, turbidity currents, etc.) in deep-water environments (Fig. 34a). Such an interaction commonly results in bottom-current-reworked sands with traction structures (Shanmugam et al. 1993). Under such conditions, hybrid flows may generate partial “Bouma Sequence” (Fig. 34b), which could explain the upward transition from Ta to Tb, if one believes in the validity of the Bouma Sequence. Fonnesu et al. (2020) and Fuhrmann et al. (2020) have discussed the concept of hybrid flows using examples from Mozambique.
10 Discussion

Fig. 31 Side view of flume tank showing sandy debris flows with well-developed turbulent clouds (i.e., turbidity currents) on top of sandy debris flows. This flow transformation occurred downslope from the entry point (i.e., flume head tank) where debris-flow slurry was introduced.Compare with Fig.32b for“high-density turbidity currents”(HDTC)of Postma et al.(1988)

Fig. 32 a Plot of sediment concentration for different flow types. Note that a typical turbidity current can exist only in sediment concentration less than 9% by volume (Bagnold 1962). Note overlap in sediment concentration among low-density, turbidity currents, high-density turbidity currents, and hyperconcentrated flows or debris flows; Reference: Pierson and Costa (1987). b Experimental stratified flows with a basal laminarinertia flow and an upper (turbulent) turbidity current that have been termed as “high-density turbidity currents” (HDTC) by Postma et al. (1988).Compare with our experimental generation of stratified flows with basal sandy debris-flow layer and an upper turbidity-current layer (Fig. 31).HDTC are considered as sandy debris flows by Shanmugam (1996). Note clasts near the top of sandy debris flows along the rheological interface.Source: a Modified after Shanmugam 1996), SEPM. b From Postma et al. (1988). Elsevier. Copyright Clearance Center’s RightsLink: Licensee: G.Shanmugam. License Number: 4986780407199.License Date:January 12,2021
According to Bouma (1962), traction structures are an integral part of the turbidite facies model, which has become known as the “Bouma Sequence”. In the 1960s, it was reasonable to attribute traction structures uniquely to turbidites. However, during the past 60 years, it has become obvious that deposits of contour currents, winddriven currents, tidal currents and baroclinic currents also develop traction structures. More importantly, it became clear that intersection of alongslope bottom currents with downslope sediment-gravity flows (i.e., hybrid flows) characteristically develop traction structures that may mimic the “Bouma Sequence”. Thus, there is a problem as to the significance of traction structures in distinguishing individual deep-water facies, such as contourites, tidalites, hybridites, etc..
Shepard et al. (1979) documented 25,000 h of velocity measurements of mostly tidal currents from over 150 stations located in 25 submarine canyons around the world. The study by Shepard et al. (1979) has never been matched by any other studies on velocity measurements of modern turbidity currents in submarine canyons, including by the most recent study on the Monterey Canyon (Maier et al. 2019). The previous 12 case studies of modern turbidity currents that were published during a period of 56 years (1952-2008) (e.g., Heezen and Ewing 1952; Inman et al. 1976; Hay et al. 1982; Normark 1989; Parsons et al. 2003; Xu et al. 2004, among others)were also unconvincing (see explanations by Shanmugam 2012a). This extreme rarity of velocity measurements of modern turbidity currents is truly mystifying given the fact that thousands of ancient strata were interpreted routinely as turbidites in the sedimentary record (Fig. 35).
Empirical data on turbidity currents and on tidal currents gathered from modern deep-water settings, when compared to their ancient interpreted counterparts(Fig.35),defy the doctrine of uniformitarianism(Fig.36).Clearly, the driving force behind most turbidite interpretations has been the Bouma Sequence and related groupthink, not empirical data and pragmatism.

Fig. 33 Difference between genuine hybrid flows as used in this study (left) and flow transformation as used by other authors (right). From Shanmugam(2020)
11 A solution
Despite the recognition that various bottom currents do form traction structures in deep-water environments (Hollister 1967; Lonsdale et al. 1972; Klein 1975; Shanmugam et al. 1993), there are no solutions to the problem of distinguishing traction structures formed by one type vs. the other (e.g., thermohalinedriven vs. wind-driven current). Even recent coring of sandy intervals in the Gulf of Cadiz with active bottom currents offers no practical solutions. For example, Brackenridge et al. (2018) focused on modern sandy contourites. However, the recovery of unconsolidated sands, particularly when sandy intervals are coarse-grained and very-well sorted, offer no straightforward results as in muddy sediments. This is because the high-porosity of these well-sorted sands made them prone to undergo drilling-related liquefaction, which tends to destroy any kind of the primary fabric of sedimentary structures. Nevertheless, de Castro et al. (2020) documented wispy and lenticular laminae associated with bottom-current reworked sands (BCRS) in a sand-starved system. Such excruciatingly detailed observations are needed immediately.If more such studies are forthcoming for sandy intervals, we might be able to solve this problem of traction structures.
A suggested solution to interpreting the origin of traction structures is composed of two parts. The first part is to interpret traction structures in the sedimentary record pragmatically on the basis of criteria developed from empirical field and experimental evidence, without any built-in bias using genetic facies models, such as the“Bouma Sequence”. The second part is to develop objective criteria for distinguishing traction structures formed by a particular bottom current, such as, contour current, tidal current, baroclinic current, amid aforementioned difficulties. This is a formidable task for which there are no shortcuts. This arduous task begins immediately with the doctrine of uniformitarianism(Fig. 36)as the underpinning in developing criteria.Until reliable criteria are developed to distinguish traction structures of each type of bottom currents, a general term “BCRS” (i.e., bottom-current reworked sands) is appropriate for deposits of all four kinds of bottom currents (Fig. 16).
12 Conclussions
· During the past 60 years, the Bouma Sequence has been the most influential facies model for interpreting deep-water sediments as turbidites.
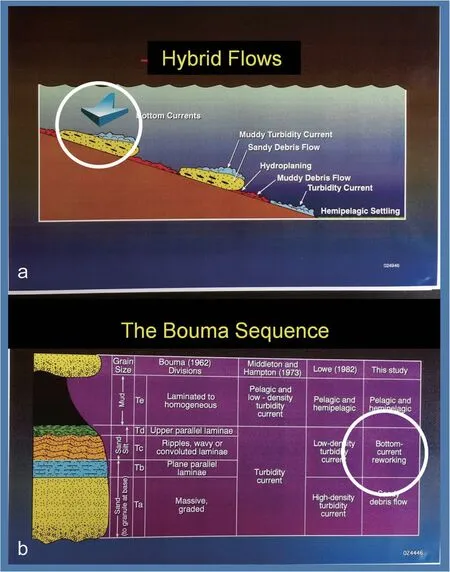
Fig. 34 a Conceptual model of hybrid flows showing reworking the tops of downslope sandy debris flows by alongslope bottom currents. Such complex deposits would generate a sandy unit with a basal massive division and upper reworked divisions with traction structures (parallel or ripple laminae), mimicking the “Bouma Sequence.”; b The turbidite facies model (i.e., the Bouma Sequence) showing Ta, Tb, Tc, Td, and Te divisions. Conventional interpretation is that the entire sequence is a product of a turbidity current (Bouma 1962; Walker 1965; Middleton and Hampton 1973). White circles show location of bottom-current reworking on the seafloor (a) and corresponding interval in the depositional record (b). This may explain the upward transition of Ta to Tb, as discussed by Leclair and Arnott (2005). Source: a From Shanmugam (2006), with permission from Elsevier.b From Shanmugam et al. (1997),with permission from Elsevier
· The orthodoxy is that traction structures are an integral part of the Bouma Sequence and that cutout logic can be used to interpret discrete ripple chains as turbidites.
· The problem is that discrete ripple chains can also be formed by various bottom currents, such as winddriven currents,contour currents,tidal currents,baroclinic currents, and hybrid flows. As a consequence,bottom-current reworked sands (BCRS) are routinely misinterpreted as turbidites by using the cut-out logic.
· After describing over 10 km of cores and outcrops worldwide, I have learned that the more the number of case studies I have examined, the more the empirical evidence I have obtained in support of bottom-current origins of traction structures.
· Although it was reasonable to introduce a simplistic“Bouma Sequence” in 1962, at a time of limited knowledge on deep-water processes, it is obsolete now in 2021 to apply this model to the rock record amid a wealth of new knowledge on deep-water contour currents, tidal currents, baroclinic currents, and hybrid flows at present(2021).
· In popular classifications,genetic facies“turbidites”(Fig.6), “hyperpycnites” (Fig. 7), and “contourites” (Fig. 16)no longer represent a deposit of a specific process.
· Double mud layers and sigmoidal cross beddings are viable criteria for distinguishing deposits of deep-marine tidal bottom currents.However,no such unique traction structures exist for deposits of other three types of bottom currents(i.e.,thermohaline,wind,and baroclinic).

Fig. 35 Comparison of number of direct observations on deep-water tidal and turbidity currents in modern settings with number of interpreted deep-water tidalites and turbidites in the ancient sedimentary record. Importantly, Shepard et al. (1979) documented 25,000 h of velocity measurements of mostly tidal currents from 25 submarine canyons around the world. But no such robust dataset on modern turbidity currents exists. In explaining the rarity of turbidity currents in modern oceans, sequence stratigraphers could use the notion that turbidity currents occur preferentially during periods of sea-level lowstands (Damuth and Fairbridge 1970; Shanmugam and Moiola 1982, 1988; Vail et al. 1991). However,such notions are obsolete (Shanmugam 2007). References: Dykstra (2012), Heezen et al. (1964), and Mutti and Ricci Lucchi (1972). Figure from Shanmugam (2021a). Elsevier. Copyright Clearance Center’s RightsLink: Licensee: G. Shanmugam. License Number: 4986770931833 License Date:January 12, 2021

Fig. 36 Diagram illustrating the doctrine of uniformitarianism. The outer red circle represents critical knowledge sources of modern systems. The inner black circle represents the past (i.e., the ancient rock record). A comprehensive knowledge of modern systems is imperative in interpreting(i.e., vertical blue arrow) the ancient rock record.Note the prevailing disconnection between modern and ancient systems in terms of observation in modern environments and interpretation of ancient record (Fig. 35). The reason for this disconnection is our failure to apply uniormitarianism in developing criteria for distinguishing traction structures formed by different bottom currents. From Shanmugam (2021a). Copyright Clearance Center’s RightsLink:Licensee:G.Shanmugam. License Number: 4986760519280.License Date:January 12,2021
· A general solution is to stop applying genetic facies models for interpreting traction structures in the rock record and to start developing objective criteria based on uniformitarianism coupled with common sense. Until such reliable criteria are developed to distinguish traction structures of each type of bottom currents, a general term “BCRS” (i.e.,bottom-current reworked sands) is appropriate for deposits of all four kinds of bottom currents.
· With the uttermost diligence and the patience, we might be able to resolve these problems during the next five decades by 2070!
· Amid many unresolved problems, deep-water system still remains a frontier domain for future research.
Abbreviations
AAPG: American Association of Petroleum Geologists; BCRS: Bottom-current reworked sands; GSA: Geological Society of America; HDTC: High-density turbidity currents; IIT: Indian Institute of Technology; JOPG: Journal of Palaeogeography; JSR: Journal of Sedimentary Research; Km: Kilometer;m: Meter; MA: Massachusetts; MIT: Massachusetts Institute of Technology;MPG: Marine and Petroleum Geology; MTD: Mass-transport deposits; N: Neap tide; NASA: National Aeronautics and Space Administration; NNW: Northnorthwest; S: Spring tide; SAFL: St. Anthony Falls Laboratory; SSE: Southsoutheast; US: United States; USA: United States of America; USGS: United States Geological Survey; WHOI: Woods Hole Oceanographic Institute
Acknowledgements
This paper is based on my Keynote lecture given at the “JoP Zoom 2020 Global Conference on Deep-Water Systems” on October 17, 2020, Beijing,China. I thank Editor Dr. Yuan Wang for inviting me to present the lecture at the JoP Conference as well as for her helpful review comments. I also thank Prof. F.J. Hernández-Molina and Dr. S. de Castro, both of Royal Holloway, University of London, who helped me with research material from IODP Expedition 339, Gulf of Cadiz. I am grateful to three journal reviewers, Prof. Santanu Banerjee, IIT Bombay (India), Dr. S. de Castro, Royal Holloway, University of London (UK), and Prof. You-Bin He, Yangtze University, Wuhan (China), for their critical and helpful comments. As always, I am thankful to my wife Jean Shanmugam for her general comments.
Author’s contributions
The author read and approved the final manuscript.
Funding
This project did not receive any funding.
Availability of data and materials
Data sharing is not applicable to this article asno datasets were generated or analyzed during the current study.
Competing interests
The author declares that he has no competing interests.
Received: 2 December 2020 Accepted: 26 January 2021

 Journal of Palaeogeography2021年2期
- Journal of Palaeogeography的其它文章
- Late Tremadocian(Early Ordovician)reefs on the Yangtze Platform,South China,and their geobiological implications:a synthesis
- Diversified calcimicrobes in dendrolites of the Zhangxia Formation,Miaolingian Series(Middle Cambrian)of the North China craton
- A record of deglaciation-related shifting of the proximal zone of a sandur—a case study from the Gwda sandur,NW Poland(MIS 2)
- Shoreline evolution and modern beach sand composition along a coastal stretch of the Tyrrhenian Sea,southern Italy
- Characteristics and evolution of inertinite abundance and atmospheric pO2 during China’s coal-forming periods
- Eocene to Oligocene nannofossils stratigraphy and environmental conditions in Izeh Province,Zagros Basin,East Tethys
