Quantitative structure-plasticity relationship in metallic glass:A machine learning study*
Yicheng Wu(吴义成), Bin Xu(徐斌), Yitao Sun(孙奕韬), and Pengfei Guan(管鹏飞),†
1Beijing Computational Science Research Center,Beijing 100193,China
2Institutes of Physics,Chinese Academy of Sciences,Beijing 100190,China
Keywords: metallic glass,structure,plasticity,machine learning
1. Introduction
Metallic glasses(MGs)exhibit excellent mechanical and physical properties, which are potential for structural and functional applications.[1–3]However, catastrophic failures can take place in MGs in an unpredictable way due to the disordered structure,[4]which severely hinders the wide applications of MGs. The plastic response to external mechanical loads in crystalline solids has already been well understood,and the fundamental units of plastic deformation are structure defects,such as dislocations. MGs,however,lack long-range order and as a result it is difficult to predict where failure will occur. Therefore, understanding the structural origin of plasticity in MGs has always been a hot topic in the community of materials science. To understand the mechanism of plasticity,several promising models have been developed in the past decades, such as the free volume model,[5]the shear transformation zone (STZ) model[6,7]and the flow unit model.[8]These models assumed that the plasticity in MGs may originate from some pre-existing structural defects. Nevertheless,the precise definitions of these defects still remain elusive.
In recent years, a lot of efforts have been made to find effective structural parameters as the indicators of plasticity in model MGs. General structural indicators include local geometrical unfavored motifs (GUMs),[9]local five-fold symmetry,[10]participation fraction from lowfrequency vibrational modes,[11]flexibility volume,[12]vibrational mean-squared displacement,[13]two-body excess entropy,[13]machine-learned quench-in softness,[14]structural flexibility,[15]and so on. These indicators have been useful to fully characterize the structural heterogeneity at the atomic level and partially capture the plastic rearrangements in MGs.However,there still lacks a standard methodology to quantify the correlation between the local structural signatures characterized from the configuration prior to deformation and the subsequent plastic events in realistic MGs until now,although efforts to achieve this goal have been made in several 2D models of amorphous solids.[16,17]
Recent work has stated that such a simple short-range order parameter as local five-fold symmetry (LFFS) is not a sound structural fingerprint for plasticity of glasses, because the spatial autocorrelation length of LFFS is only 1.2 ˚A,much shorter than the common spatial correlation length that is approximately 2.2 ˚A.[13]It is also demonstrated that only if a structural descriptor is defined involving atoms beyond the short-range order(SRO)does it reproduce the feature of common spatial correlation length in glass. Very recently, a pioneering work revealed that augmenting the SRO structural features by the medium-range order (MRO) features greatly enhances the ability to predict plastic events.[14]However,the local density and the short-range order may be short to capture plastic activity.[16]Therefore, it is necessary to evaluate the influence of the MRO features on plasticity.
Machine learning (ML) has recently been shown to be a promising way to analyze the correlation between structure and property in glasses and supercooled liquids.[14,15,18–22]Cubuk et al. firstly used radial density and bond orientation as structural information to classify atoms that prone to rearrangement from stable ones,via ML,on L-J model glasses.[18]Subsequently, they defined a machine-learned structural parameter,“softness”,which is well correlated with dynamics in various disordered systems.[19–22]Wang et al. reliably identify plastic sites in several MG systems by using interstice distribution as structural representation combined with ML.[14]Most recently, Fan et al. employed the local pair distribution function as structural fingerprints and flexibility volume as the supervisory signal to establish “structural flexibility”, which is strongly correlated to properties of CuZr metallic glasses under different conditions.[15]
In this work,to reveal the reliability of local structural indicators for predicting plastic events,we use the ML method to quantify the strength of the correlation between the plasticity and these structural features computed from the configuration prior to deformation in a simulated Cu50Zr50metallic glass.We find that different kinds of structural indicators have various predictive ability, and among all cases, indicators related to participation fraction obtained from the quasi-localized soft vibrational modes have the best correlation with the plasticity. In addition,we also assess the influence of coarse graining measurement and MRO features on the correlation. Coarse graining measurement has different effects on the predictive ability of each indicator. However, when extended to MRO,almost all structural indicators improve the predictive power,indicating that the MRO could be important to predict plasticity in MGs.
2. Methodology
2.1. Atomic model of metallic glass
Molecular dynamics(MD)simulation was carried out using the LAMMPS package.[23]A prototypical metallic glass model system Cu50Zr50with the embedded atom method(EAM) potential,[24]was selected for its superior glassforming ability and simple constituents. To prepare the glass sample, periodic boundary condition was maintained in three directions,a system with 4000 atoms was first equilibrated at 1200 K for 10 ns and then quenched to 1 K with a cooling rate of 1010K/s, during which the external pressure was adjusted to zero within the isothermal-isobaric ensemble (NPT). The temperature was kept at a constant through the Nose–Hoove thermostat.[25]Finally,a static relaxation via a conjugate gradient method was applied to bring the system to mechanical equilibrium at T =0.
2.2. Structural indicators
To systematically investigate the quantitative correlation between structural descriptors and plasticity in MGs,we consider 13 structural parameters including coordination number(CN),atomic volume(Vol),local five-fold symmetry(f5),local configurational anisotropy(|u|),two-body excess entropy(S2), atomic inherent structure energy (EIS), atomic pressure (σm), atomic Von-Mises stress (συ), atomic bulk modulus (B), atomic shear modulus (G), participation fraction of the low-frequency vibrational modes (PF), vibrational meansquared displacement (vMSD) and flexibility volume (υflex).The definitions of the above indicators are shown in the Supplementary Material. These structural indicators can be divided into three classes. Class 1 includes CN,Vol, f5,|u|and S2. These structural indicators are all defined by merely analyzing the local geometry of atomic environment,and thereby they are purely structural parameters. Class 2 covers EIS,σm,συ,B and G,which are obtained by calculating the interaction of the particle with its neighbors. Therefore, both the information of interaction potential and the position of particles are needed. Class 3 contains PF,vMSD and υflex,which are based on the measurement of physical quantities,PF is defined from analysis of the soft vibrational modes,[11]calculating vMSD and υflexis required to probe the information of vibrational properties.[12,13]
2.3. Plastic event locations
The deformation mechanisms in glassy systems are determined by the complicated interplay between thermal activation and external loading.[26]To eliminate the temperatureinduced thermal fluctuation,the glass is deformed via athermal quastistatic shear (AQS). We applied a series of deformation steps, Δγ =10−5, to move the atom positions affinely. After each deformation increment, the system is relaxed to its mechanical equilibrium with conjugate gradient method. Plastic instabilities associated with particle rearrangements correspond to the instantaneous drops in the stress-strain curve.The shear transformation induced by the plastic event can be calculated by comparing the configurations from just before with just after the instability. As shown in Fig. 1, a plastic event occurs at γ, to identify the atoms that have undertaken shear transformation,we calculate the D2minof atom i as[7]

where ε is the maximum local elastic strain tensor. We define the plastic activity locations as the positions of 5 atoms that have the largest. Due to the nature of disorder in MGs,there is no sharp boundary to identify the positions of plastic events. Therefore, it is hard to choose the exact threshold to classify the plastic atoms from non-plastic atoms. We also test different thresholds as the largest 10, 20 and 50 atoms, and it shows that the threshold does not affect our results qualitatively.
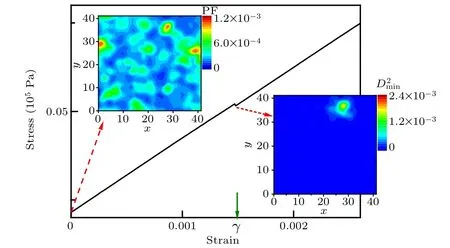
Fig. 1. The instantaneous fragment of the AQS stress-strain curve, in which the stress drop indicates the occurrence of a plastic event. The contour maps of initial and deformed configurations denote the participation fraction(PF)field and field in the slice,respectively. The slice is 3.8 ˚A thick, which corresponds to the first trough of the pair distribution function of the system.
For disordered systems, it is difficult to precisely define the location of plastic rearrangements especially when system approaches the steady state where the plastic events become increasingly ramified.[27]However,the plastic rearrangements occurring at elastic regime are overwhelmingly localized and their locations can be defined more unambiguously, which is confirmed by the extreme localization of D2minat a plastic event given in Fig. 1. It is shown that the average strain at the first plasticity is a good indicator for material stability/ductility.[17]In addition, focusing on the first plasticity allows us to avoid the complexity that the initial structure has different influences on plasticity at different strains.Therefore,in the present work we mainly investigate the correlation between the structural indicators characterized prior to deformation and the first instability.
2.4. Machine learning
Recently, Sun et al. employed the ML method to find that models developed from different input descriptors have different abilities to predict the glass forming ability (GFA),and they concluded that there is a deep and important link between the liquidus temperature and the GFA.[28]Inspired by the above work,we can also quantify the predictive ability of indicators by feeding each individual feature set to train an ML model and then evaluating the model prediction efficiency. If the ML model based on a particular indicator can effectively classify plastic atoms from non-plastic ones,this indicator will be viewed as a proper structural parameter to predict plasticity.
The support vector machine(SVM)method[29]is one of the most popular and powerful ML techniques for data classification. It solves the classification problem by constructing a hyperplane to best classify data points from different categories. Therefore, we use support vector machine (SVM)method with linear kernel as our ML algorithm to quantitatively assess the predictive capability of structural indicators. The regularization parameter in the SVM method is set as C =1. In order to build a proper database for SVM,we prepared and sheared 200 independent samples. However,based on our definition of plastic atoms,the non-plastic atoms(3995×200 = 799000 atoms) vastly outnumber the plastic atoms(5×200=1000 atoms). To create a balanced dataset,we randomly undersample the non-plastic atoms so that the plastic atoms and non-plastic atoms have equal numbers in our dataset. Then,we perform 5-fold cross-validation(CV)on the sampled dataset and calculate the average area under the receiver operating characteristic curve (AUC-ROC) on the test set as the scoring metric. The test set score is almost equal to the training set score when we use 1000 plastic and 1000 nonplastic atoms to construct our dataset. This indicates that there is no underfitting or overfitting and this dataset is enough for training and testing.
The ROC curve evaluates the tradeoff between true positive rate against false positive rate as a function of chosen threshold.[30]In this work, the AUC-ROC score can be interpreted as the probability that a true positive atom (plastic) is assigned a higher probability to rearrange than a true negative counterpart (non-plastic). The AUC-ROC value of 0.5 indicates a random chance level,and the value of 1.0 denotes perfect classification. The higher the AUC-ROC, the better the model. The previous studies have shown that the AUC-ROC is an effective scoring metric in evaluating a classifier to identify stress or thermal-activated β relaxation events in metallic glasses.[14,31]
3. Results and discussion
3.1. Individual structural indicator
To measure the degree of correlation between the plastic activity and the different local structural parameters, we employ the same datasets and CV splits, and feed each individual structural indicator as input feature to train a corresponding ML model, the AUC-ROC is used as the score to estimate the structural descriptor’s predictive ability for each training. Here, we use 13 local structural features as mentioned above,and the predictive power for each structural parameter is shown in Fig. 2. The result shows that the model prediction accuracies differ largely for different input descriptors. Among all structural indicators, f5, PF,vMSD and υflexhave better predictive capability than others. Moreover, we notice that PF served as the most superior descriptor in predicting plasticity events. The ROC curve of the ML model fitted from PF can be seen in Fig.S1. This observation corroborates the previous understanding that the low-frequency excitations correlate strongly with the location of plasticity of a system upon external mechanical loading,[11,32]and it is also in excellent agreement with the result that the highly localized rearrangements occurring at the plastic instability originate from the region with large PF in the undeformed configuration as shown in Fig. 1. The vMSD is calculated from dynamically probing the vibrational degree of freedom, thus reflecting the curvature of the local minimum of the potential energy landscape(PEL).[13]The local vMSD is similar to the local Debye–Waller factor used to probe dynamic heterogeneity of glass-forming liquids.[33–35]Therefore, it makes sense that vMSD can serve as a good structural signature of plasticity. Surprisingly, the υflexcomprising both static atomic volume and dynamic information via vMSD, scores similarly to vMSD.It indicates that for υflex,the vMSD part dominates the predictive power for plasticity, which is well consistent with the observation that vMSD and υflexhave similar correlation with activation energy underlying plastic rearrangements.[13]A majority of structural indicators from class 1 preform badly,as colored in red in Fig. 2, with one important exception:the local five-fold symmetry, f5. It even performs as well as structural descriptors defined by more complicated methods such as vMSD and υflex. The indicator f5highlights the fivefold bonds of Voronoi polyhedron. It is demonstrated that in metallic glasses, plastic rearrangements have a high propensity to be initiated in regions containing more geometrically unfavored motifs (GUMs)[9,11]or lower degree of local fivefold symmetry.[10]This result underlines the important role of the particular short-range order in influencing the initiation of plasticity.
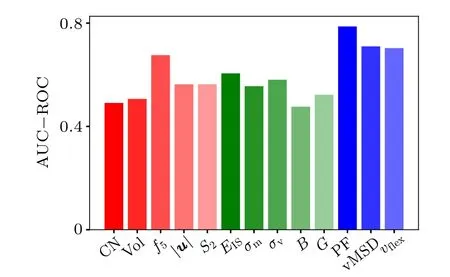
Fig.2. Prediction accuracy of various structural indictors. Indicators from classes 1, 2, 3 are colored in red, green and blue, respectively. It shows that participation fraction(PF)scores highest at predicting plasticity.
3.2. The coarse graining effects
Several studies demonstrated that a spatial coarse graining of initial structural indicators over a characteristic length yields better correlation with dynamics than bare structural fields.[36,37]Therefore,it is necessary to investigate the effect of coarse graining on the predictive ability of different indicators. The coarse graining of structural parameter X for particle i is calculated by averaging over all particles within a length L:

In this work, we use three forms of coarse graining cores as P(x) = 1, P(x) = exp[−x/L] and P(x) = exp[−(x/L)2],L=3.8 ˚A,corresponding to the position of the first trough of radial distribution function of the system. Figure 3 shows the predictive power for these three kinds of procedure of coarse graining compared with the bare structural parameters. The method of coarse graining greatly influences the predictive efficiency of almost all structural descriptors. Overall, the different ways of coarse graining have the same effect on results.After coarse graining,the predictive ability increases for most structural quantities from class 1, except for atomic volume.This can be rationalized by the finding that these structural fields behave sharp local fluctuation, therefore, it is necessary to smooth the structural field by coarse graining to predict the loci of a plastic instability. On the other hand, the prediction scores of the coarse graining of those indicators as PF, vMSD and vflexfrom class 3 decrease. A direct consequence is the extreme heterogeneity of these structural descriptors. For the first instability, the plastic rearrangements are overwhelmingly localized, the coarse graining measurement of local structure undermines the structural heterogeneity of the system, thus cannot well predict the heterogeneous plastic response of atoms. This result is reminiscent of the observation that the localized fast β process of glassy liquids is controlled by the instantaneous order parameter field locally rather than the coarse-grained one.[36]

Fig.3. Comparison of prediction accuracy between bare structural indicators and the corresponding three kinds of coarse-grained ones.
3.3. The medium range features
Although MRO has long been considered to be essential to influence glass properties,[38,39]however, the degree of order in the medium range is difficult to decipher. Following the method proposed in the recent work of Wang et al.,[14]we can extend SRO feature (bare structural feature) to MRO by calculating statistics(mean, min, max, and std)across neighbors of the central atom. The SRO and MRO features are then concatenated as a representation of the structural characteristics around each atom. This allows for accessing the structural features of the second neighbor,which provides more information to encode the structural heterogeneity and is crucial to determine the dynamics of glassy systems. After this procedure,each atom is represented by 5 structural features,but it is difficult to establish correlation between multi-structures and plasticity by traditional methods. However, the SVM is efficient to process the multidimensional features. As shown in Fig.4,when augmented by MRO features, most SRO features have greatly improved the predictive power. Surprisingly, the prediction score of PF augmented by the MRO increases,which is totally different from PF with the coarse graining procedure.As a whole, indictors augmented by the MRO perform better than coarse grained ones. This evidences that the structure defined over the medium range could be more important in determining properties of MGs, as discussed in previous studies.[13,40]
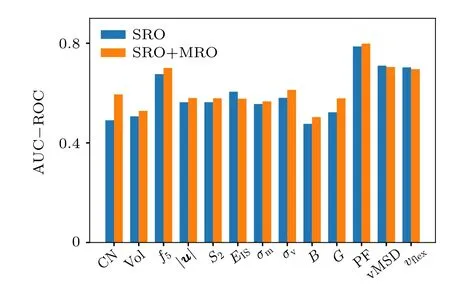
Fig.4. Comparison of prediction accuracy between bare structural indicators(SRO)and the SRO augmented by the MRO(SRO+MRO).
3.4. Pair of structural indicators
One might ask whether prediction accuracy improves if we use a pair of structural descriptors. To uncover this conjecture,we set the combination of any two descriptors as input structural features,thus obtaining 78 pairs.As we can see from Fig.5(a),among all kinds of pairs,the input features containing PF perform much better. It is mostly due to the excellent predictive power of PF. The SVM method processes data in a complex way that we are not able to understand the results directly, especially when dealing with multidimensional data sets. Here,we only stress that the combination of vMSD and PF together yield the best SVM model. To illustrate the effect of the combination of structural indicators on the prediction,we calculate the difference of prediction score between the pair and the indicator performing better among the pair. As shown in Fig.5(b),for most pairs of structural descriptors,the score has a negligible increase or remains no change. The fact that the prediction score does not improve much implies that each structural descriptor of the combination is highly correlated so that little information is added even though both parameters are considered. This is an example of a classic problem that arises in ML when there are physical correlations in the set of input features.
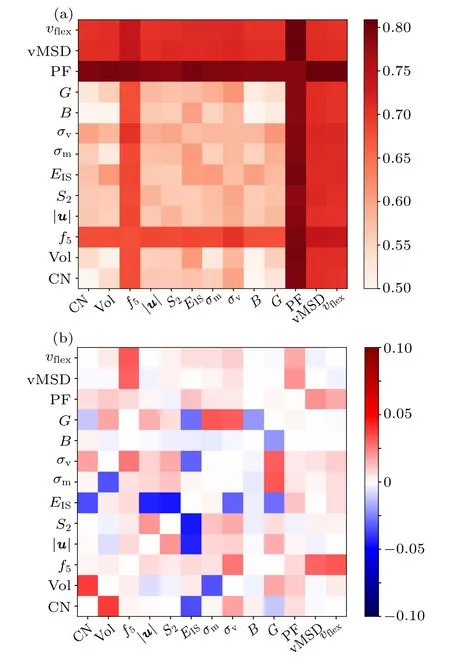
Fig.5. (a)Prediction accuracy of the combination of any two structural indicators. It shows that the combination of participation fraction(PF)and vibrational mean-squared displacement (vMSD) scores highest at predicting plasticity. (b)The difference of prediction score between the pair and the indicator performing better among the pair.
3.5. Linking softness to plasticity
After evaluating the influence of different methods on the prediction score of various indicators, we can conclude that for all cases considered, PF or PF involved quantity outperforms all other kinds of indicators. Moreover,the best score is achieved by the combination of PF and vMSD (detailed data of the highest prediction scores for each procedure is list in Table S1). As depicted in Fig.6(a),the local structure around a central atom is embedded into a two-dimensional feature space(combination of PF and vMSD), a hyperplane (SVM model)that separates plastic atoms from non-plastic ones can be established. Therefore, we can define a new structural quantity called “softness”, by calculating the distance of atom’s position in the structural feature space to the hyperplane. The larger the softness S, the more likely an atom to be plastic.As the combination of PF and vMSD highly predicts plasticity,the corresponding softness will strongly correlate with the plastic rearrangements.To investigate the underlying softnessplasticity correlation, we further show the spatial extent of softness andby quantifying the normalized spatial correlation function
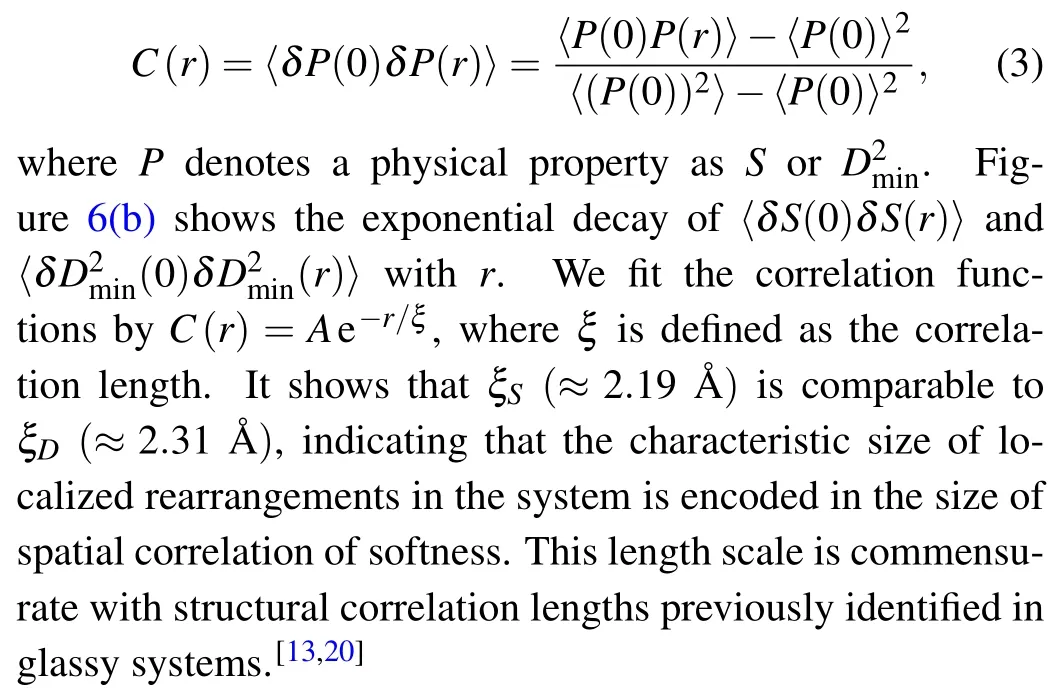
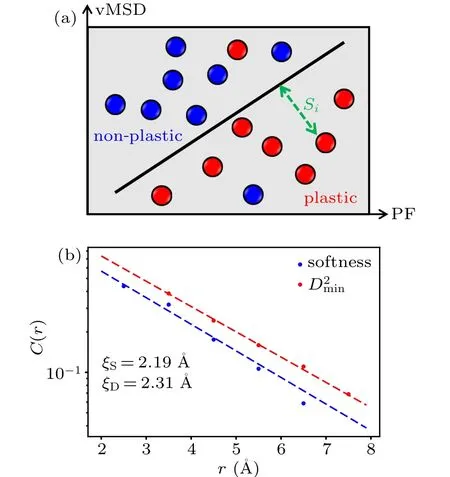
Fig. 6. (a) A schematic showing how the local structure of an atom is represented by PF and vMSD. We can find a hyperplane separating plastic atoms from non-plastic ones by SVM. Once the hyperplane is established, we define the softness S as the distance of atom embedded into two-dimensional feature space to the hyperplane. (b)The spatial correlation functions for softness (red) and rearrangements (blue).The dashed lines are fits to Ae−r/ξS with ξS ≈2.19 ˚A for softness and Ae−r/ξD with ξD ≈2.31 ˚A for rearrangements.
4. Conclusion
Previous studies have demonstrated that initial configuration has a substantial impact on where and how a glassy material fails under shear.[14,16,17]In this work, we use the machine learning method to study how the structural indicators evaluated before deformation, correlate with the plastic rearrangements that occur at the first plastic instability. We find that structural indicators containing information of participation fraction give more predictive ability for plasticity.In addition,coarse graining measurement has different influences on prediction of structural indicators. When extended to MRO,however, most structural parameters improve the prediction.Moreover,the highest prediction score can be achieved by the combination of PF and vMSD.Our results stated above illustrate that plastic rearrangements in MGs are deeply encoded in the structure. This work makes an important step to quantitatively compare different features of local structure based on their ability to predict plastic activity.
Acknowledgements
Insightful discussions with the members of Beijing Metallic Glass Club are highly acknowledged. We also acknowledge the computational support from Beijing Computational Science Research Center(CSRC).
- Chinese Physics B的其它文章
- Process modeling gas atomization of close-coupled ring-hole nozzle for 316L stainless steel powder production*
- A 532 nm molecular iodine optical frequency standard based on modulation transfer spectroscopy*
- High-throughput identification of one-dimensional atomic wires and first principles calculations of their electronic states*
- Effect of tellurium(Te4+)irradiation on microstructure and associated irradiation-induced hardening*
- Effect of helium concentration on irradiation damage of Fe-ion irradiated SIMP steel at 300 °C and 450 °C*
- Optical spectroscopy study of damage evolution in 6H-SiC by H+2 implantation*

