Three-dimensional spatial multi-point uniform light focusing through scattering media based on feedback wavefront shaping∗
Fan Yang(杨帆), Yang Zhao(赵杨), Chengchao Xiang(向成超), Qi Feng(冯祺), and Yingchun Ding(丁迎春)
College of Mathematics and Physics,Beijing University of Chemical Technology,Beijing 100029,China
Keywords: wavefront shaping,speckle correlation,3D spatial focusing,multi-point focusing
1. Introduction
Wavefront shaping realizes focusing and imaging through the scattering medium by controlling the amplitude and phase of the wavefront of the incident light. This technology has the ability of depth imaging with micron or sub-micron resolution, which makes it stand out from a variety of focusing and imaging technologies through scattering media. It may hold the key to future depth imaging technology.[1]Wavefront shaping was first demonstrated in experiment by Vellekoop and Mosk in 2007 and has been rapidly developed and applied.[2]At present,there are mainly three types of mature optical focusing technologies based on wavefront shaping,including optical phase conjugation,[3–8]transmission matrix measurement,[9–14]and feedback-based optimization.[15–20]The feedback-based wavefront shaping experimental device is simple and flexible. It uses intelligent algorithms for iterative optimization to increase the intensity of the target position as the number of iterations increases, and has high a signalto-noise ratio in the entire optimization process, so it is more suitable for 3D spatial focusing than the other two methods.
Over the years, great attention has been paid to the focusing and imaging of light through scattering media based on wavefront shaping. This is because it has important applications in many fields,such as biomedical imaging,[1]optical manipulation,[21]optogenetics,[22]optical communication,[23]and cryptography.[24]Many studies have been made on the realization of focusing and imaging on a single plane and achieved great results.In contrast,there are still few studies on realizing 3D spatial focusing through scattering media. In the fields of optical manipulation[21]and optogenetics,[22]3D spatial focusing is able to achieve spatial movement of the focal point and spatial multi-point focusing,so it has broader application prospects than two-dimensional(2D)spatial focusing.
In the past few years,people have tried to achieve 3D spatial focusing.The memory effect can be utilized to scan the 3D space with a focal point through the scattering media.[25]The research of Xiaodong Tao et al.and Qian Zhao et al.expanded the moving range of the focal point in 3D space.[26,27]However, in the process of moving the focal point, the intensity reduced constantly,which is not conducive to practical applications. So Vinh Tran et al. proposed a method to implement feedback wavefront shaping with optical memory effect and optical 4f system to move the focal point in 3D space behind scattering media. It can quickly move the focal point formed by genetic algorithm (GA) in memory effect regions. When the focal point moves to the edge of memory effect regions,GA is used to optimize again.[28]This method realizes the rapid movement of the focal point while ensuring the intensity of the focal point. For the research of 3D spatial multi-point focusing,the current main method is to superimpose multiple optimal masks.[26,28]However, this method cannot guarantee the enhancement and uniformity of the focal points at the same time. And the more the number of focal points,the more optimal masks are needed,which greatly increase the optimization time.
For the above reasons, in this paper, we realize multipoint uniform focusing in 3D space based on feedback wavefront shaping only by loading the optimal mask once. First,in order to experimentally measure the light field intensity of different focal planes,we add an electric moving stage(EMS)to the feedback wavefront shaping system and adopt a set of automatic optimization control scheme with less time consumption. Subsequently, we use the non-dominated sorting genetic algorithm suitable for 3D spatial focusing (S-NSGA)as the feedback wavefront shaping algorithm for global multiobjective optimization. In the end,we prove the excellent performance of the system in terms of uniform focusing in 3D space through experimental research.
2. The principle of 3D spatial multi-point focusing
The 3D spatial multi-point focusing refers to the optimization of wavefront shaping to simultaneously form focal points at designated positions on different focal planes perpendicular to the optical axis direction. The number of focal planes is the most intuitive difference between 2D spatial multi-point focusing and 3D spatial multi-point focusing. The former has only one focal plane perpendicular to the optical axis direction(Fig.1(a)),while the latter has two or more focal planes perpendicular to the optical axis direction(Fig.1(b)).
The main experimental difficulty of focusing in 3D space compared with focusing in 2D space is the way to collect light intensity information simultaneously on different focal planes in the optimization process. This means that the camera needs to detect the output light fields of different focal planes corresponding to the same mask.In fact,in our definition of 3D spatial multi-point focusing,it can be found that the focal planes and optical axes of different output light fields are perpendicular to each other. This feature is a simplified treatment of the difficult points of the 3D spatial multi-point focusing experiment. The advantage of this is that it not only realizes the classification of different focal points in the 3D space,but also facilitates the detection and acquisition of the camera. Since the camera can only detect a certain focal plane perpendicular to the optical axis at a time, in order to detect different focal planes, we need to use an EMS to control the focus position of the objective lens in the experiment so that the camera can collect light intensity information from different focal planes.
According to the research of Goodman et al.,the speckle field exists cross-correlation within a certain axial range.[29]Therefore, for the different focal planes of the 3D spatial multi-point focusing,there is a parameter ∆z corresponding to the correlation length of the speckle field spatial domain. ∆z represents the minimum distance between the speckle fields of the two spatial focal planes that are uncorrelated. When the actual distance between the two spatial focal planes is less than ∆z,the speckle fields on these two planes are related. The focal points of the two planes affect each other. The correlation length of the speckle field in the axial direction can be obtained by calculating the cross-correlation function of the speckle intensity at different depths. We select two points on the optical axis that are z and z+∆z away from the scattering medium,and their cross-correlation function is


where µA(∆z)is the normalized correlation coefficient of the speckle field,and λ is the incident light wavelength. The relative length ∆z of speckle in axial direction can be approximately calculated by the full width at half maximum(FWHM)of the correlation function shown in Eq.(2)

For 3D spatial focusing,suppose there are N focal planes(N ≥2). We have two optimization objectives: the intensity and the uniformity of the focal points. We use the multiobjective optimization algorithm S-NSGA to optimize the two objectives. The difference between the algorithm we used and the one in Ref.[20]is mainly in the discriminant. We develop the discriminant to make it suitable for 3D spatial multi-point focusing,such as Eqs.(4)and(5):
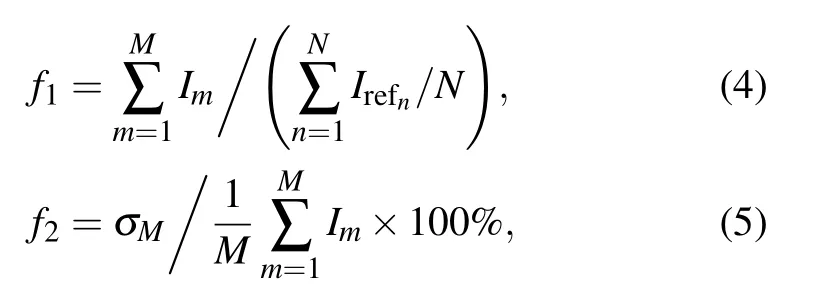

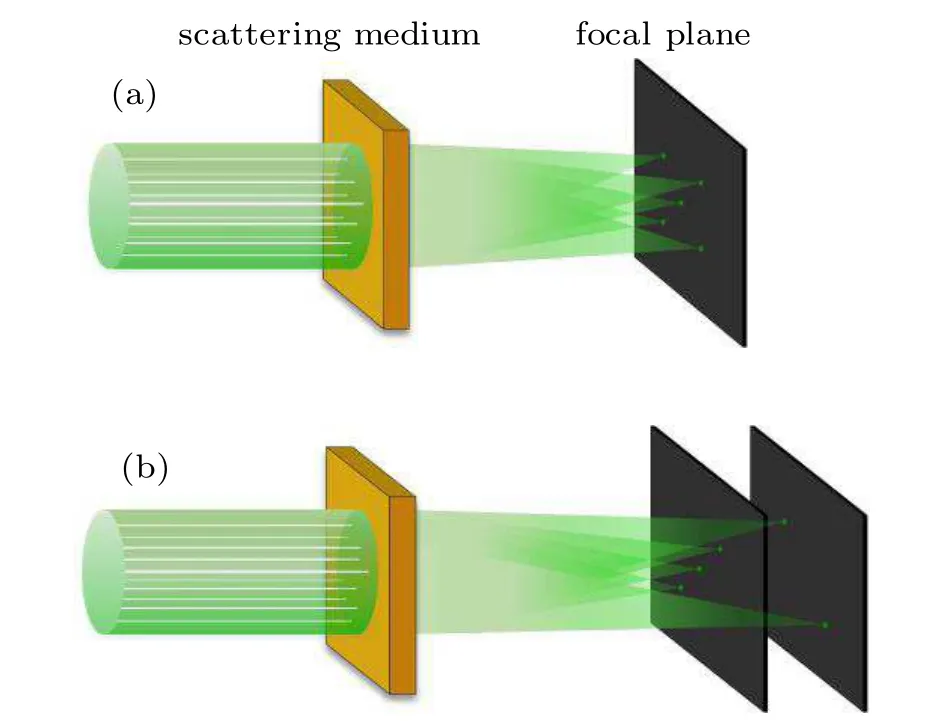
Fig.1.(a)2D spatial multi-point focusing and(b)3D spatial multi-point focusing.
3. Automatic control system for 3D spatial multi-point focusing
Our 3D spatial multi-point focusing experimental setup is shown in Fig.2. An incident laser beam(532 nm,30 mW)is expanded through the objective lens OL1 (25×, NA=0.4),and the central part of the expanded beam passes through an aperture and a linear polarizer and then covers the entire mask area of the digital micromirror device (DMD) (TI,DLP6500FYE). The reflected light of the DMD is expanded through the lenses L1(f =175 mm)and L2(f =50.8 mm),and the small hole is used as a spatial filter to eliminate the unnecessary diffraction orders generated by the DMD. After passing through OL2(Plan 10×,NA=0.25),a scattering sample (Edmund ground glass diffuser, 120 grit, 1.6 mm thickness), and OL3 (Plan 20×, NA=0.4), the output light is finally collected by a 12-bit charge coupled device(CCD)(AVT,Manta G-031B)with 656×492 pixels. The focal plane of OL3 is located on the back of the sample, and this plane is the actual position of the multi-point focusing. In order to achieve 3D spatial multi-point focusing,the OL3 is fixed on the EMS through a support rod, and the initial focal plane of OL3(the red dotted line is the initial focal plane captured by the CCD camera) is about 1 cm away from the scattering medium S.The EMS is controlled by the PC to move a certain distance back and forth along the optical axis, and the focal plane of OL3 will also move a corresponding distance accordingly,so the CCD can collect the output light field intensity of different focal planes. Note that all components in the blue dotted line need to be covered with a black box to avoid interference from ambient light. The data acquisition card(DAQ)(NI USB-6009) is controlled by the PC to ensure the timing synchronization of DMD and CCD.In terms of software, except the CCD is controlled by LabVIEW,the rest are performed on MATLAB, including the control of the electric displacement platform, the control of the trigger signal of the data acquisition card, the display of the mask on the DMD, and the realization of S-NSGA.
We combine the control program of the displacement platform with the algorithm program of feedback wavefront shaping optimization to realize the automatic control of the system.Since the single movement time(0.3 s)of the platform is about 6 times of the display time(0.05 s),it is beneficial to shorten the total measurement time to reduce the number of movement of the platform than to reduce the number of display.
Our experimental plan is to first collect the output light field intensity of the NP masks at a certain focal plane in the optimization process of each generation,and then move EMS to measure the output light field intensity of the NP masks at the next focal plane. The process is repeated until the output of the mask for all focal planes is measured. An important basis for the feasibility of this scheme is that the NP masks in each generation of S-NSGA are parallel and do not interfere with each other, so we can perform unified measurements on each focal plane. In this paper, the initial population size of S-NSGA is NP=20, and the optimization of each generation requires 20 mask measurements at each focal plane. Suppose the number of focal planes is N(N ≥2). Each mask in this optimized control scheme needs to go through N times of screen display, N times of image reading and calculation processing, but the mobile displacement platform corresponding to NP masks only needs N times movements. Finally, the total time consumed for the NP mask measurement is(0.05+0.04)×20×N+0.3×(N −1)=2.1×N −0.3(s).When N=2 and 3,the total measurement times of this scheme are 3.9 s and 6 s,and the corresponding optimized speeds are 5.1 Hz and 3.3 Hz.
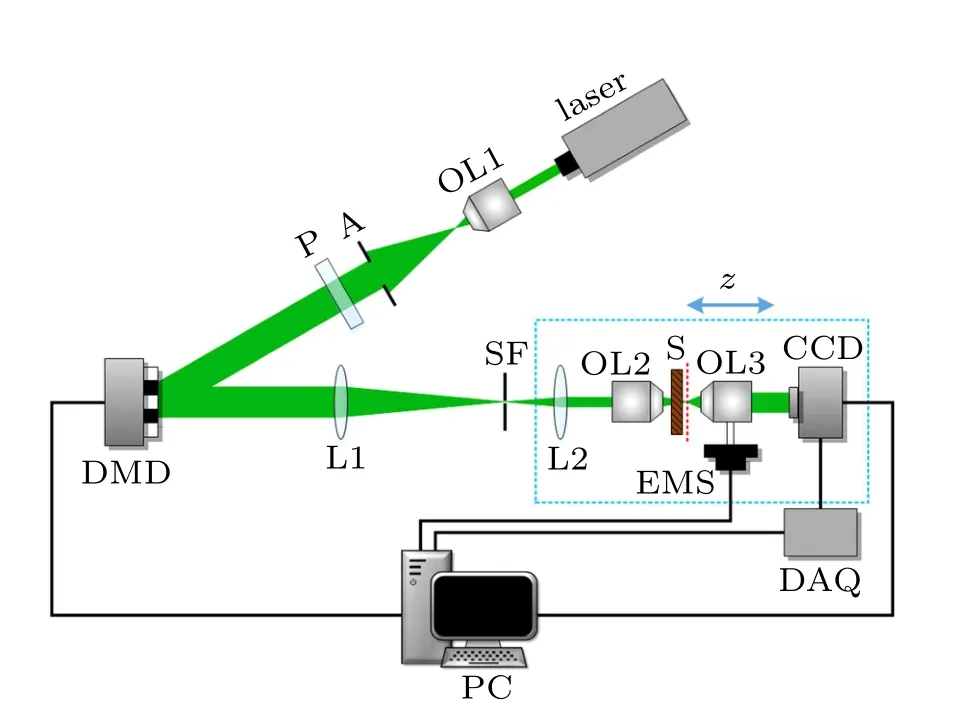
Fig.2. Experimental setup diagram of 3D spatial multi-point focusing.OL1,OL2,OL3: objective lenses;A:aperture;P:linear polarizer;L1,L2: lenses;SF:spatial filter;S:scattering sample.
4. Results and analysis
4.1. Measurement of correlation length of the spatial focal planes
We estimate the relative length at the initial focal plane(0 mm) according to Eq. (3). The initial focal plane is 1 cm away from the ground glass, and the illumination area on the back surface of the scattering medium is a circle with a diameter of about 1.5 mm. Therefore, the correlation length is calculated to be 0.17 mm. Since there may be errors in the estimation,we also measure the correlation length through experiments.First,we achieve single-point focusing at the initial focal plane (0 mm) based on S-NSGA, and then control the EMS traveling at a constant speed from −0.3 mm to 0.3 mm(the negative direction is close to the ground glass, and the positive direction is close to the camera). Single step length is 0.005 mm,and the output light field is recorded by the camera at each step, and a total of 121 images are collected. Finally,the average light intensity of the 3×3 area at the central focal point of each picture is counted and plots as the relationship between the intensity of the focal point and the displacement distance (Fig.3(a)). It can be seen from the figure that the experimental curve (EC) is in good agreement with the theoretical curve(TC).The double arrow line segment in the figure is the full width at half maximum(FWHM)of the curve,and the length is 0.14 mm, which is not only the axial size of the focal point, but also the relative length in the optical axis direction. Figures 4(b)–4(f)present the local output light fields at different focal planes during the measurement process(the 100×100 pixel area with the focal point as the center).
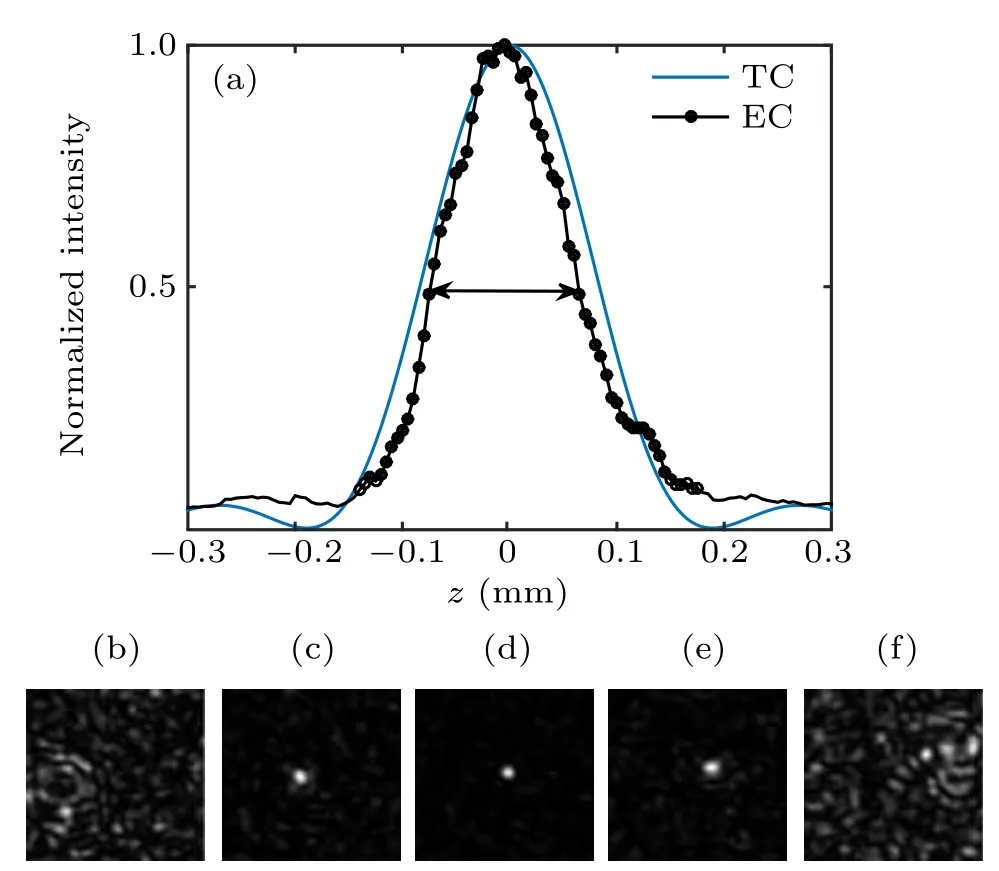
Fig.3. Measurement of correlation length in optical axis direction.(a) Diagram between the intensity of focal point and the displacement distance. (b)–(f) Diagrams at the displacement distance of −0.3 mm,−0.07 mm,0 mm,0.07 mm,and 0.3 mm,respectively.
4.2. Influences of speckle correlation on 3D spatial multipoint focusing
We conduct comparative analysis through two-point focusing experiments on two focal planes. The two sets of comparative experiments are optimized under the same parameter configuration(NP=20,NG=100,NS=3600,H=80). The only difference is that the two focal planes of the first group are separated by 0.05 mm(two focal planes are cross-correlated),and the two focal planes of the second group are 0.5 mm apart(two focal planes are not related). The target positions of the two focal points are respectively set on the left side of the first focal plane and the right side of the second focal plane.
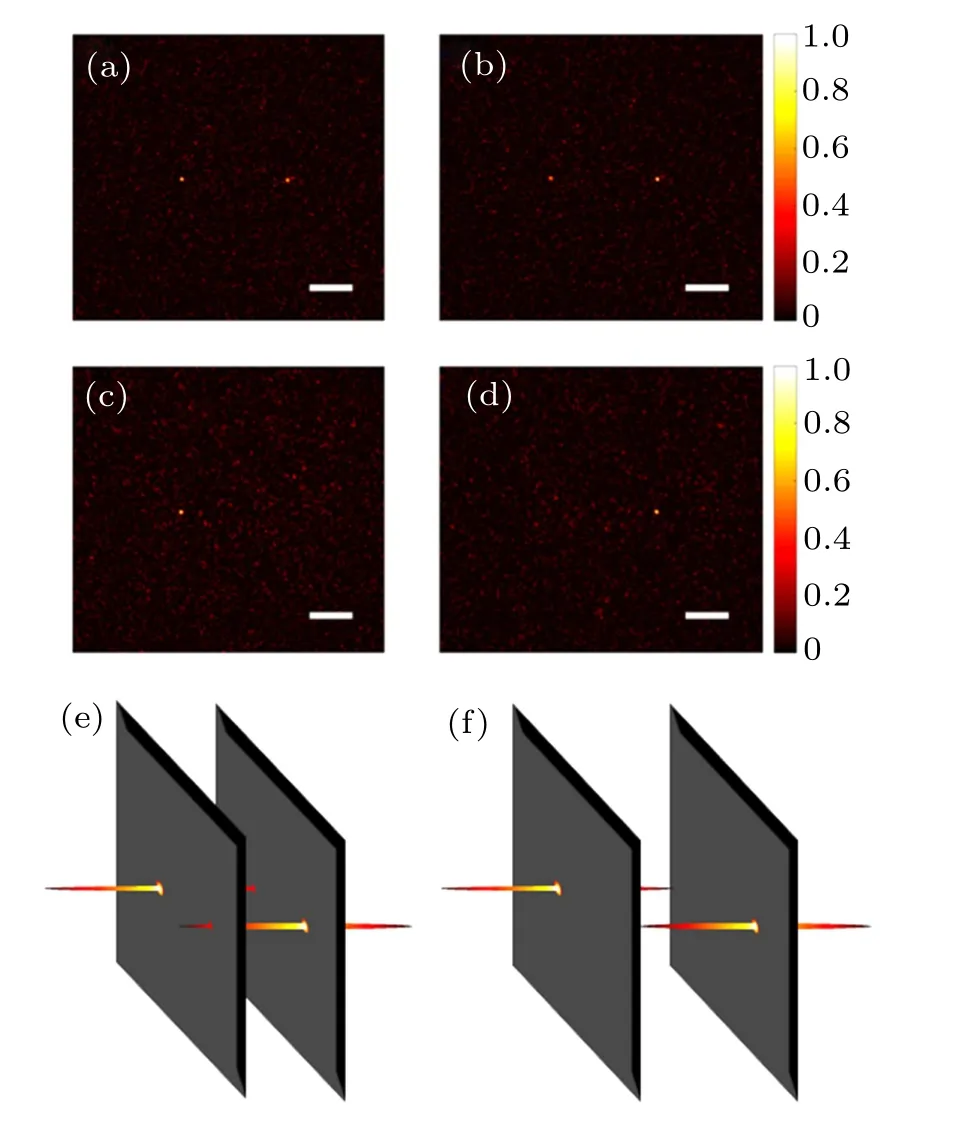
Fig.4. Influences of speckle correlation on 3D spatial focusing. (a)and(b)The experimental results of two-point focusing on two focal planes 0.05 mm apart. (c) and (d) The experimental results of two-point focusing on two focal planes 0.5 mm apart. (e)and(f)The 3D schematic diagram of the two sets of experiments. Scale bar: 500µm.
Figures 4(a)and 4(b)are the results of the first set of experiments. Since the distance between the two focal planes is less than the correlation length,the focal points on the two focal planes will interfere with each other. The relatively weak focal point on the right in Fig.4(a)comes from the influence of the right focal point in Fig.4(b), and the relatively weak focal point on the left in Fig.4(b)also comes from the left focal point in Fig.4(a),so the two focal planes are all presented as two-point focusing. Figures 4(c) and 4(d) are the results of the second set of experiments. Two unrelated focal planes show a good expected optimization effect,that is,the two focal points only exist at the target position of the corresponding focal plane. The total enhancement of the first set of experiments is 101, and the coefficient of variation is 3.79%. The total enhancement of the second set of experiments is 113,and the coefficient of variation is 2.08%. In order to facilitate the analysis,we draw the diagram of two groups of experimental results in three-dimensional space (Figs. 4(e) and 4(f)). We should note that these two sets of experiments both achieve two-point uniform focusing in 3D space, but the results of the first experiment are slightly worse than those of the second. This is because in the first set of experiments,each focal point appears on the two focal planes, resulting in a stronger background intensity, so the enhancement decreases. At the same time, experimental noise increases with the increase of the background intensity,so the uniformity of the focal points decreases.
4.3. Effects of different axial distances on 3D spatial multipoint focusing and the optimal control of S-NSGA on different focal points
We conduct 6 groups of two-point focusing experiments in two focal planes (the focal point of each focal plane is located in the center of the picture),the first focal plane in each group is at 0 mm, and the other focal plane is at −5 mm,−2 mm, −0.5 mm, 0.5 mm, 2 mm, and 5 mm, respectively.The initial parameter configuration of these 6 groups of experiments is the same(NP=20,NG=100,NS=3600,H=80),and the experimental results(the pixel area centered on the focal point)are presented in order in Fig.5.
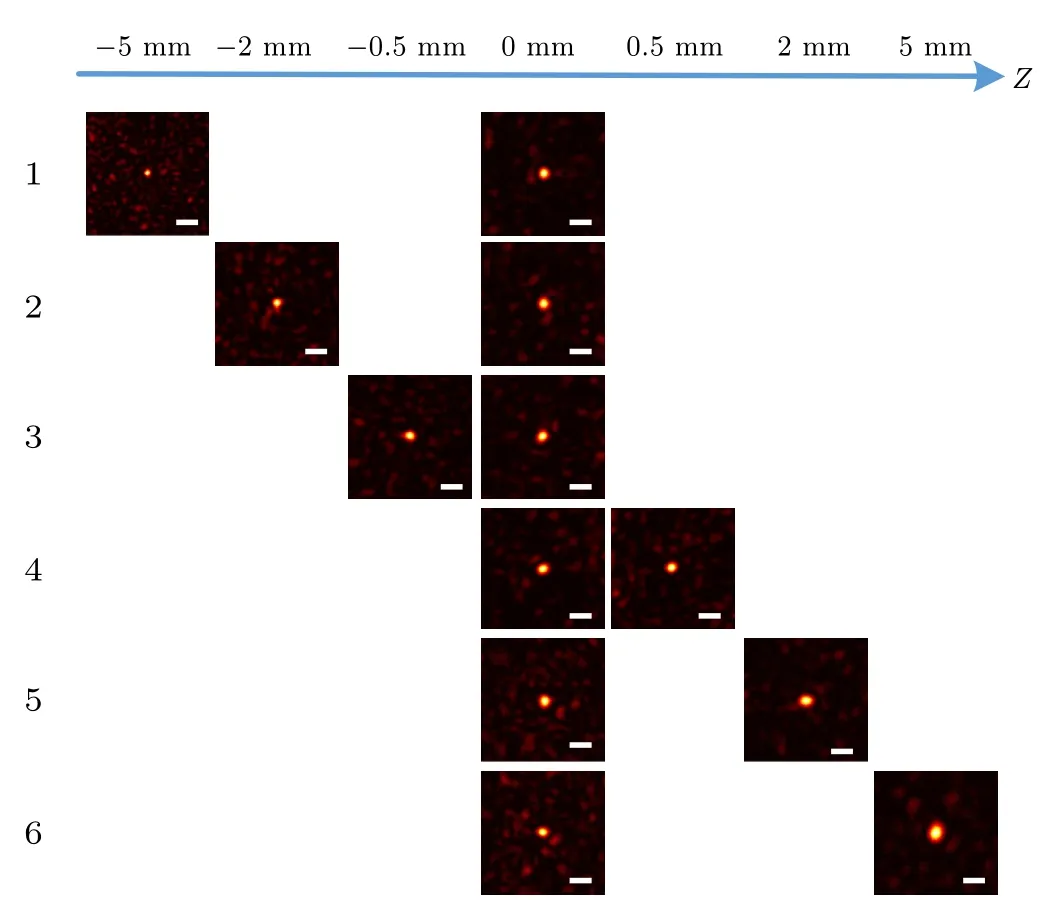
Fig.5. Comparison of 6 groups of 3D spatial two-point focusing experimental results with different axial distances. Scale bar: 100µm.
From the figure we can find two main differences among the 6 groups of experimental results. One is that the sizes of the two focal points in each set of experiments vary with the axial distance. The specific performance is as follows: When the position of the second focal plane moves in the negative direction(from the third group to the first group),its focal point size gradually decreases as the distance increases. When it moves along the positive direction(from group 4 to group 6),the focal point gradually becomes large. The other is that the background field noise of the two focal planes in each set of experiments becomes serious as the axial distance increases.This can also be obtained from the optimization results of the enhancement and coefficient of variation of S-NSGA.For example,the total enhancement of the third and fourth groups is about 90, and the coefficient of variation is within 1%, while the total enhancement of the first and sixth groups is reduced to about 60,and the coefficient of variation is greater than 5%.
Next, we explain these two differences by research of speckle field. Existing studies have shown that[2,30]the minimum size of the wavefront shaping focal point is approximately equal to the average size of the initial speckle,and the theoretical equation of average size (diameter) of the initial speckle in the plane perpendicular to the optical axis is[29]

where λ is the wavelength of the incident light,d is the diameter of the incident light on the surface of the ground glass,and L is the distance from the front surface of the ground glass to the focal plane. When λ and d are constant values, the average size of speckles increases as L increases. We measure the initial speckle pattern of these positions before optimization(Fig.6).It can be seen intuitively that the average size of these speckles is consistent with the change law of the focal point size in Fig.5,and it is consistent with Eq.(6).
In addition, the reason of the second phenomenon can also be obtained from Fig.6. Compared with the speckle pattern at 0 mm,the speckle particles in the negative direction are smaller and denser,so the average intensity of the background field is higher.On the contrary,the speckle particles in the positive direction are larger and sparser, so the average intensity of the background field is smaller. In the initial optimization process of S-NSGA, the greater difference in the average intensity of the background field of the two focal planes means the higher noise level,which slows down the evolution speed of the enhancement and the coefficient of variation, and ultimately leads to the decrease of optimization effect under the same number of measurements.
In order to overcome the influence of these two points and obtain the same focusing effect at different focal planes, two possible improvement measures are as follows: One is to calculate the proportional relationship between the average size of the initial speckles of the two focal planes, and increase the focal area of the smaller focal point appropriately during the calculation of the fitness value of S-NSGA.The large focal point is formed by the combination of several small focal points, so that the two focal points can maintain similar size even if they are in the focal plane with a large axial distance. The other is to determine the compensation amount of camera exposure according to the relationship between the initial background average intensity of different focal planes,and then uses the program to dynamically control the camera exposure during the optimization process. The background average intensities of different focal planes are close,so that it can greatly suppress the influence of noise caused by the difference in background field intensity and improve the final optimization effect.

Fig.6. Initial speckle pattern from −5 mm to 5 mm on the focal planes. Scale bar: 100µm.
4.4. The comprehensive performance of focusing optimization based on more focal points of S-NSGA in the case of two focal planes and three focal planes
We complete two sets of 3D spatial focusing experiments with more focal points on two focal planes(Fig.7). The first group is 5-point focusing (NP=20, NG=400, NS=3600,H =350), two focal points on the first plane, and three focal points on the second plane. The second group is 10-point focusing(NP=20,NG=600,NS=3600,H=500),each plane contains five focal points. Since the axial distance of the focal planes of the two experiments is 2 mm, the size of the focal points on the two focal planes is the same,and the difference in the average intensity of the background field has little effect.Therefore,both sets of experiments obtain good optimization results. Their total enhancements are 232 and 325, and the coefficients of variation are 2.29%and 2.45%,respectively.
For the case of three focal planes, we also conduct two sets of experiments(Fig.8). The first group is 3-point focusing(NP=20, NG=200, NS=3600, H =160). Each focal point is located at three different positions on the top,middle,and bottom of the three focal planes. Their total enhancement is 155 and the coefficient of variation is 2.61%. The second group is 9-point focusing (NP=20, NG=400, NS=3600,H =350). Each focal plane contains 3 focal points. Their total enhancement is 207 and the coefficient of variation is 8.87%. Obviously, the background field noise of the focal plane of the second group of experiments is higher than that of the first group, resulting in that the overall focusing effect is much worse than that of the first group. The main reason is that the total enhancement of 207 is still too low for 9-point focusing,the average enhancement is only 23,and the average enhancement of the first group is 52.
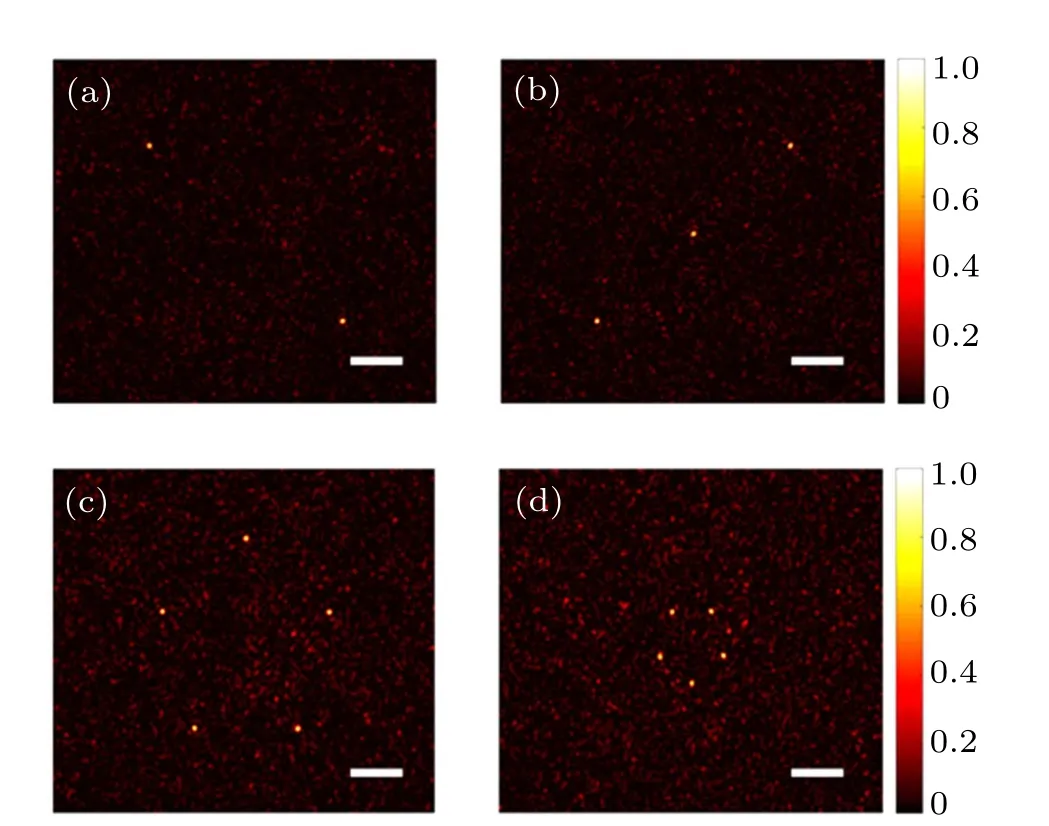
Fig.7.Experimental results of multi-point focusing on two focal planes.(a)and(b)Uniform intensity focusing of 5-point after optimization. (c)and(d)Uniform intensity focusing of 10-point after optimization.Scale bar: 500µm.
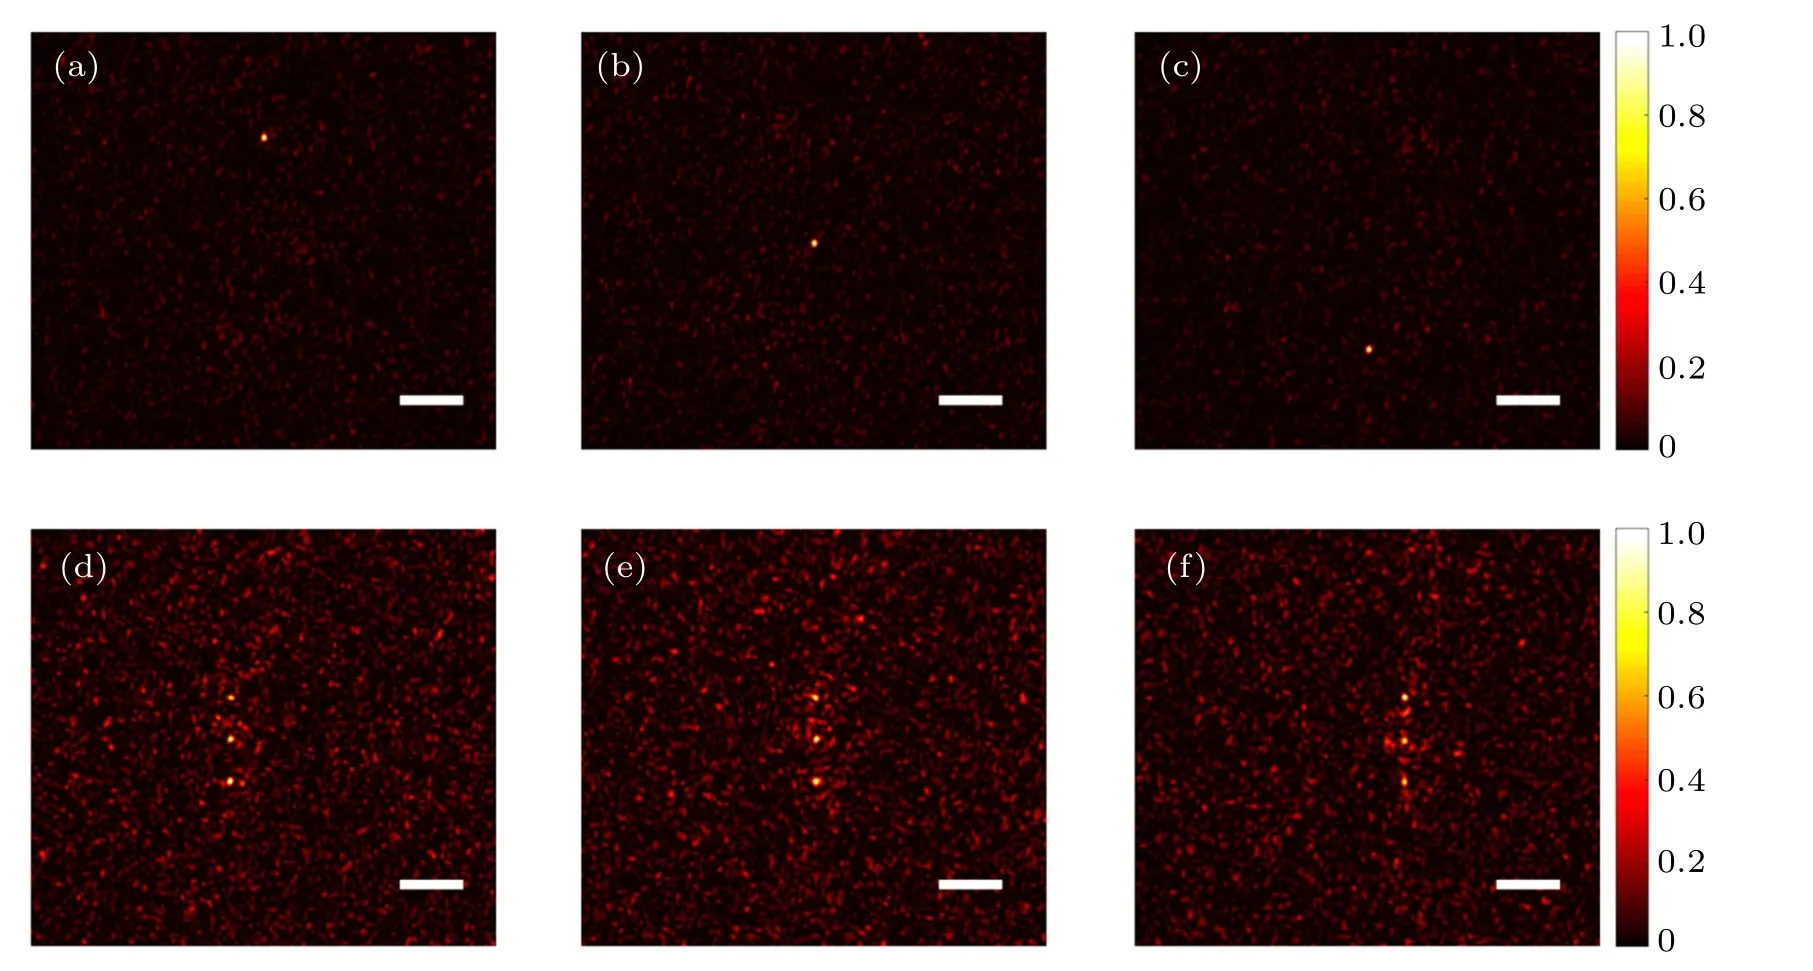
Fig.8. Experimental results of multi-point focusing on three focal planes. (a)–(c) Uniform intensity focusing of 3-point after optimization.(d)–(f)Uniform intensity focusing of 9-point after optimization. Scale bar: 500µm.
In particular,we need to emphasize that after optimizing by S-NSGA,we only need to load the optimal mask on DMD once to realize the simultaneous multi-point uniform focusing in 3D space. Although increasing the number of measurements can further increase the enhancement and improve the effect of the 3D spatial multi-point focusing optimization, it takes more time. The actual optimization measurement time of the three focal planes is at least three times of the single focal plane. The total time for optimization of the second set of experiments under the current parameter configuration is 47 minutes. Limited by the optimization speed of the current system,we do not continue to conduct 3D spatial multi-point focusing experiments with more focal planes and more points based on S-NSGA,but they are still feasible in theory.
5. Conclusion
We have achieved multi-point uniform focusing in 3D space through the scattering media. First, compared with the existing optimal mask stacking method, our method only needs to obtain the optimal mask once. It reduces the number of optimizations required and saves optimization time. Then,our research proves that the multi-objective optimization algorithm has a great application prospect in 3D spatial focusing.Additionally, according to the experimental results, we analyze the influence of speckle correlation and distance between focal planes on focusing. In the end, our method shows its powerful potential in the case of more focal planes and more focal points. Although our research currently has some limitations, especially slow optimization speed. We believe that with the deepening of research,these limitations will be overcome,and with the improvement of multi-point focusing light control ability, our research will surely be practically applied in the fields of optical manipulation and optogenetics.
- Chinese Physics B的其它文章
- Speeding up generation of photon Fock state in a superconducting circuit via counterdiabatic driving∗
- Micro-scale photon source in a hybrid cQED system∗
- Quantum plasmon enhanced nonlinear wave mixing in graphene nanoflakes∗
- Restricted Boltzmann machine: Recent advances and mean-field theory*
- Nodal superconducting gap in LiFeP revealed by NMR:Contrast with LiFeAs*
- Origin of itinerant ferromagnetism in two-dimensional Fe3GeTe2∗

