Calculation of left ventricular diastolic time constant (Tau)in dogs with aortic regurgitation using continuous-wave Doppler spectra
Chun-ZhiFAN, JingSUN, Hai-NingZHENG, Chao-YangWEN,✉
1.Department of Ultrasound, Peking University International Hospital, Beijing, China; 2.Department of Ultrasound,Beijing Chao-Yang Hospital, Capital Medical University, Beijing, China; 3.Cardiovascular Department, Shannxi Province Crops Hospital of Chinese People’s Armed Police Forces, Xi’an, China
*The authors contributed equally to this manuscript
ABSTRACT
OBJECTIVE To investigate a new noninvasive method for calculating left ventricular diastolic time constant (Tau) through a continuous-wave aortic regurgitation Doppler spectrum.
METHODS According to ultrasound guidance, twenty-four animal models (beagles) of aortic regurgitation and acute ischemic left ventricular diastolic dysfunction were created. The left ventricular diastolic function was manipulated with dobutamine or esmolol and fifty-nine hemodynamic stages were achieved. Raw audio signals of the continuous-wave Doppler spectra were collected, and new aortic regurgitation Doppler spectra were built after reprocessing by a personal computer. The updating time of the spectral line was 0.3 ms. The new Doppler spectra contour line was automated using MATLAB (MATrix LABoratory, Math-Works, Natick, MA, USA), and two time intervals, (t2-t1) and (t3-t1) were measured on the ascending branch of the aortic regurgitation Doppler spectrum. Then, the two time intervals were substituted into Bai’s equations, and Doppler-derived Tau (Tau-D)was resolved and compared with catheter-derived Tau (Tau-c).
RESULTS There is no significant difference between Tau-D and Tau-c (45.95 ± 16.90 ms and 46.81 ± 17.31 ms, respectively; P >0.05). Correlation analysis between Tau-c and Tau-D suggested a strong positive relationship (r = 0.97, P = 0.000). A Bland-Altman plot of Tau-c and Tau-D revealed fair agreement.
CONCLUSIONS This new calculation method is simple, convenient, and shows a strong positive relationship and fair agreement with the catheter method.
The active relaxation process of the left ventricle can be compromised in some diseases, such as hypertension, ischemic heart disease, diabetes mellitus, and hypertrophied cardiomyopathy.[1,2]Although left cardiac systolic function may be normal, patients can still experience dyspnea, pulmonary edema, and heart failure owing to increased left atrial pressure and pulmonary venous hypertension caused by increased left ventricular end diastolic pressure.[3,4]Left ventricular diastolic heart failure is different from left ventricular systolic heart failure[5]in that it tends to occur earlier (i.e., it can occur alone).
In 1976, Weiss,et al.[6]found that shortly after aortic valve closure, the left ventricular pressure could be plotted and fitted to an exponential function, which is characterized by the concept of the left ventricular diastolic time constant (Tau):

where Pm is the left ventricular pressure when t =0; e is the natural logarithmic base, which is 2.71828...;t is the time from -dP/dt max, shortly after aortic closure; T is Tau; and B is a constant. This equation is also called Weiss’ equation. As it is based on an assumption that in diastole, the left ventricular pressure falls all the way to zero, or the end diastolic pressure is zero, Weiss’ equation is a zero-asymptote model. For a certain cardiac cycle, the Pm is also a constant. To simplify, Weiss’ equation can also be expressed as:

Later, Langer,et al.[7]proved that considering the true end left ventricular pressure will render the calculation more accurate. The above equation should be modified as:

where C is another constant, representing the end left ventricular diastolic pressure. This is the nonzero asymptote model. However, Weiss’ equation is more popular in published works because it is easier to compute. The derivative of Weiss’ equation is expressed by:
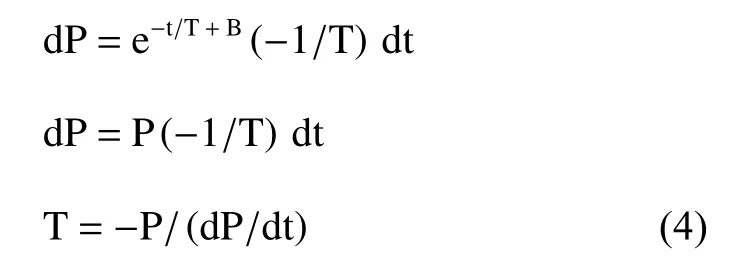
Both P and dP/dt can be measured in the catheter lab, so Tau can also be accurately measured in the catheter lab. Tau is a well-established index to describe left ventricular diastolic function.[8-10]However, the measurement is expensive and invasive,and therefore, it is not widely accepted for use in the daily clinic for diagnosis.
Tau can be measured within the isovolumic diastolic period, when both the aortic valve and mitral valve are closed. Obviously, only three approaches are available to calculate Tau: (1) placing a catheter into the left ventricle, with a high-fidelity pressure sensor mounted to the catheter tip; (2) mitral regurgitation; and (3) aortic regurgitation. The first approach is an invasive method, and the second and the third approaches are noninvasive Doppler methods.
Several researchers[2,8,11]have tried the noninvasive Doppler method with mitral regurgitation,which brought us closer to the measurement of Tau in daily clinic.
In 1995, Yamamoto,et al.[12]published a formula to calculate Tau using a continuous wave Doppler aortic regurgitation curve. This is a new approach to measure Tau. However, the formula was developed on the basis of four assumptions, which makes it difficult to maintain the integrity of the theory.
Bai,et al.[1]published an equation group to calculate Tau in patients with aortic regurgitation. This equation group was deduced on the basis of only Weiss’ equation, simplified Bernoulli’s equation,and universal mathematical laws:

This is a logarithmic equation group. There are two unknowns: Tau and aortic diastolic pressure (ADP).Both (t2-t1) and (t3-t1) are time periods that can be measured on the ascending branch of the continuouswave aortic regurgitation spectrum. Graphic software designed to resolve the equation group was developed and is accessible free of cost at http://sourceforge.net/projects/tauformula/.
Here is a summary of the derivation process of the above logarithmic equation group. In the echo examination for aortic regurgitation, the left ventricular pressure, P can be expressed as:

where ΔP is the pressure gradient between the aorta and left ventricle. Substituting Weiss’ equation (2)and the simplified Bernoulli’s equation, P = 4v2, into equation (7) leads to the following equation:

A natural logarithmic transformation on both sides of the above equation results in the expression:

Three points, (t1, 1 m/s), (t2, 2 m/s), and (t3,3 m/s), were chosen on the ascending limb of the aortic regurgitation continuous-wave Doppler velocity curve (Figure 1) and were each substituted into equation (10), resulting in the following three equations:
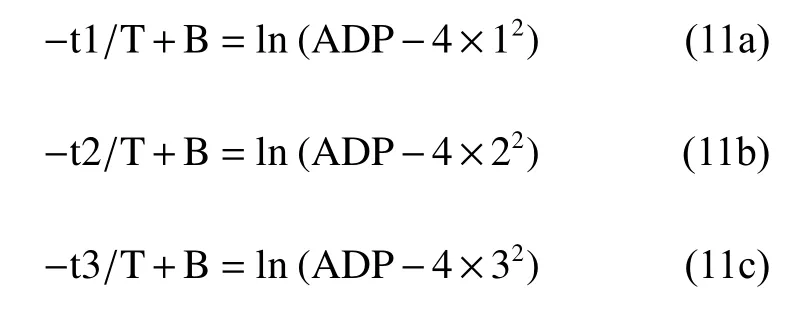

Figure 1 Schematic description of the aortic regurgitation spectrum. Refer to Calculation of left ventricular relaxation time constant-Tau in patients with aortic regurgitation by continuouswave Doppler. Open Cardiovasc Med J 2008; 2: 28-30. AVC: aortic valves closure; AVO: aortic valves opening; MVC: mitral valves closure; MVO: mitral valves opening.
From the difference comparison of equations (11a)and (11b), we can find:

or

similarly,

This study aimed to verify this logarithmic equation group by creating a canine model of acute aortic regurgitation. We collected continuous-wave aortic regurgitation spectra to calculate Tau with the above equations under different scenarios of diastolic dysfunction. In addition, Tau was calculated using the gold standard catheter method to verify the Doppler-derived Tau (Tau-D).
METHODS
Animal Preparation
The animal experiment complies with the Animal Research: Reporting of In Vivo Experiments (ARRIVE)guidelines and was carried out in accordance with the National Institutes of Health Guide for the Care and Use of Laboratory Animals (NIH Publications No.8023, revised 1978). Twenty-four healthy adult beagles from the Experimental Animals Center,Chinese PLA General Hospital (8 females, 16 males;body weight: 10-16 kg; age: 2.5-3.9 years) were used in this study. Surgery was performed after a one-week period of adaptation. After the food and water fast of 12 to 24 h, the beagles were injected with 3% sodium pentobarbital (i.e., 30 mg/kg), and then scoline (i.e., 2 mg/kg) and diazepam (10 mg).The dogs were fixed onto the operation table following successful anesthesia and ventilated with a SERIES7200 respirator (Zhongnong TongChuang Biotechnology Co. Ltd., Beijing, China) through intubated trachea. A lead II electrocardiogram (ECG)was connected to a data acquisition and analysis system (ML866 Powerlab4, AD instruments, Sydney,Australia). An intravenous line was maintained on the right upper extremity.
Preparation of the Beagle"s Aortic Regurgitation Model
The left common carotid artery was isolated and punched by a trocar. With the help of ultrasound(Mindray DC-7 color Doppler echocardiography,phased-array cardiac probe, 2.5 MHz; Mindray Medical International Limited, Shenzhen, China), a guide wire was introduced into the ascending aorta,and then, an artery sheath catheter was placed just above the aortic valves.[13,14]The guiding wire was removed, and a homemade φ1.4-mm steel wire with a sharp end was introduced. Again, with the help of ultrasound, the sharp end of the steel wire was placed into one of the Valsalva sinuses. Pushing the steel wire, the aortic valve was punched through.[15]Upon withdrawal of the steel wire to the ascending aorta, mild-to-moderate aortic regurgitation was documented by color Doppler echocardiography.[16]Following complete withdrawal of the steel wire from the artery sheath catheter, the distal end of the artery sheath catheter was positioned in the ascending aorta. The artery sheath catheter was connected to a pressure transducer (Judkins, Schneider Electric S.A., Rueil-Malmaison, France) and in turn connected to the data acquisition and analysis system. The thoracic cage was opened in the middle, and the heart was exposed. The pericardium was cut open and sutured to stabilize the heart. A micromanometer-tipped catheter (SPR-320 Millar Mikro-tip,Millar Instruments, Houston, TX, USA) was inserted into the left ventricle through the apical area and then connected to the data acquisition and analysis system. The data acquisition and analysis system can display and record the digital left ventricular pressure curve, dP/dt curve, and lead II ECG signals(Figure 2).
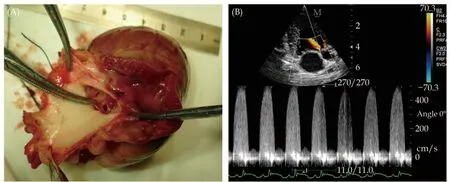
Figure 2 Creation of the aortic regurgitation model guided by ultrasound. (A): A puncture is clearly seen on the aortic valve; and(B): continuous-wave Doppler aortic regurgitation spectra.
Preparation of the Beagle"s Acute Left Ventricular Diastolic Dysfunction Model
We prepared this model in accordance with previous reports[17-20]but with some modifications. According to previous reports,[20,21]two approaches for the development of the acute ischemic left ventricular diastolic dysfunction model exist: (1) ligation of the coronary artery, and (2) microsphere administration through a catheter. We added 100 mg melamine formaldehyde microspheres (average diameter = 51.7 μm; Huake Microscience Science and Technology Ltd, Wuhan, China) to 50 mL of dextran 40 isotonic sodium chloride solution, which was well mixed in an ultrasonic oscillator. The coronary microvascular diameter was less than 200 μm,and the average capillary diameter was 7 μm. According to ultrasound guidance, the front end of the artery sheath catheter was moved into another Valsalva sinus with a coronary opening. Next, the microsphere solution was injected into the Valsalva sinus (Figure 3), 2 mL per injection, repeated every 10 min. The total number of injections was about 4 to 8, until the left ventricular end-diastolic pressure(LVEDP; the beginning of the ECG QRS complex represents the same time point at which the LVEDP is on the left ventricular pressure curve) increased to more than 5 mmHg,[21,22]indicating that the acute ischemic left ventricular diastolic dysfunction model is successful.

Figure 3 Creation of the acute ischemic left ventricular model guided by ultrasound. (A): The parasternal short axis view shows the front end of the artery sheath catheter moving into the left Valsalva sinus; and (B): guided by ultrasound, the microsphere solution was injected into the Valsalva sinus. Next, the acute ischemic left ventricular diastolic dysfunction is induced by the injection.
Preparation of Different Hemodynamics Models in the Beagles
After successful creation of the acute left ventricular diastolic dysfunction model, the dog was closely observed for 20 min to ensure absence of apparent unstable hemodynamics. Different hemodynamics were achieved with either dobutamine hydrochloride (Huayi Pharmaceutical Group Ltd.,Yuwi, China; 4 mg dissolved in 100 mL normal saline) or esmolol hydrochloride (Qilu Pharmaceutical Ltd., Jinan, China; 4 mg dissolved in 100 mL normal saline).[11,12]Fifty-nine different hemodynamic states were achieved in twenty-four dogs.
Doppler Echocardiography
The phased-array probe was positioned at the apical area to get an apical 5-chamber view. Guided by the color Doppler images, 3 to 6 heart beats of continuous-wave aortic regurgitation Doppler spectra were saved at suspended end-expiration. At the same time, raw continuous-wave Doppler spectra audio signals were also saved with the help of the Mindray engineers. The data acquisition and analysis system simultaneously documented the corresponding left ventricular pressure curve, dP/dt curve, and ECG signals.
Offline Reprocessing of the Aortic Regurgitation Sonogram Using Raw Continuous-wave Doppler Audio Signals
The continuous-wave Doppler sonogram used in commercial ultrasound machines is composed of about 800 Doppler spectral lines in one display frame, with one Doppler spectral line calculated using fast Fourier transform with 64 to 256 audio samples. Usually, consecutive spectral lines use overlapped Doppler audio samples, which means only parts of the audio samples are updated in a new spectrum calculation. For a phased-array probe with a 2-MHz center frequency, given the regurgitation maximal velocity falls into the range of 5 m/s and the default sonogram sweeping time is set to 4 to 6 ms, there are about 52 to 78 audio samples updated for every spectral line calculation. The sonogram sweeping time is the time interval between the two adjacent spectral lines.
To improve the temporal resolution of the sonogram and thus accurately calculate the Tau, we collaborated with the engineers from Mindray Medical International Limited to acquire the raw Doppler audio signals from the DC-7 ultrasound system,which we used to recompute the sonogram via a personal computer. This helped us to calculate the spectral line with updated arbitrary samples. In our experiment, four audio samples were updated for every spectral line calculation; using the aforementioned condition, the sonogram sweeping time was reduced to 0.3 ms, more than a 10-fold decrease compared to traditional continuous-wave sonogram sweeping. This allowed for improved accuracy in the calculation of the Tau.
Doppler-derived Tau
The new aortic regurgitation Doppler spectrum was analyzed with the help of MATLAB R2009.This software can automatically recognize the border line of the spectrum and, using certain fitting methods, present a smooth silhouette line. At the same time, it can also automatically measure the time intervals of (t2-t1) and (t3-t1) on the ascending branch of the aortic regurgitation spectrum.Substituting both time intervals into the aforementioned Tau software, Tau can be calculated.
Catheter-derived Tau
This Tau was calculated as follows: Tau =P/(-dP/dt). Both P and (-dP/dt) can be measured on the P curve and dP/dt curve. To make it easier,we measured -dP/dt max and the corresponding P(Figures 4 & 5).
Statistical Analysis
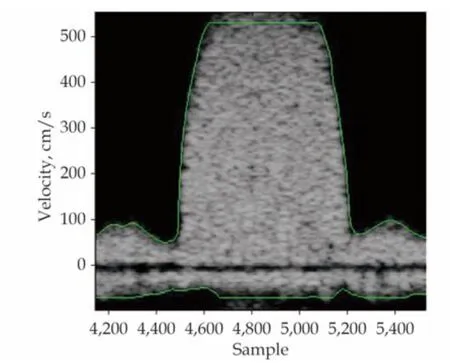
Figure 4 The aortic regurgitation spectrum and the automatic silhouette line with an updated time of 0.3 ms after processing.
Statistical analysis of correlation and regression was performed on catheter-derived Tau (Tau-c) and Tau-D with the help of SPSS 13.0 (IBM Corporation,Armonk, NY, USA; formerly SPSS Inc., Chicago,IL). At-test was applied for the comparison of two paired samples. All statistical tests were two-sided andP-value < 0.05 was considered statistically significant. The difference between the Tau-c and Tau-D was analyzed using the Bland-Altman plot.

Figure 5 Curves displayed on the data acquisition and analysis system. From the top: LV pressure curve, ECG, and LV dP/dt curve.ECG: electrocardiogram; LV: left ventricular.
RESULTS
All twenty-four beagles survived the aortic regurgitation model (twenty-two beagles had mild-tomoderate aortic regurgitation and two beagles had moderate aortic regurgitation. The severity of regurgitation is based on the jet area in the left ventricle). Twelve beagles had ruptures on the noncoronary cusp, eight beagles on the right coronary cusp, and four beagles on the left coronary cusp.Two beagles died of ventricular fibrillation during the preparation of acute ischemic left ventricular diastolic dysfunction, both with mild-to-moderate aortic regurgitation. Fifty-nine hemodynamic stages were achieved with the help of either dobutamine or esmolol. For every hemodynamic stage, Tau was calculated on the basis of the measurements made on three consecutive heart beats and averaged. Both Tau-D and Tau-c were calculated, followed by statistical analysis.
Correlation and Regression Analysis of Tau-c and Tau-D
Both Tau-c and Tau-D were close to a normal distribution, with homogeneity of variances. For the correlation tests,P= 0.000 (statistically significant).The two were well correlated, with a correlation coefficient ofr= 0.97. The regression equation was y = 1.4 + 0.95x (Figures 5 & 6).
t-test of Comparison Between Paired Tau-c and Tau-D
Tau-c ranged from 15.76 to 76.88 ms, whereas Tau-D ranged from 16.68 to 80.18 ms. Tests revealed normal distribution, with homogeneity of variances.Thet-test of the above paired samples was used,with statistical significance set atP< 0.05. Tau-c was 46.81 ± 17.31 ms, whereas Tau-D was 45.95 ±16.90 ms (P= 0.096). The difference was not statistically significant.
Difference Between Tau-c and Tau-D Analyzed by Bland-Altman Plot
The average of the differences in fifty-nine paired Tau-c and Tau-D values was d = 0.855 ms. The standard derivation was Sd = 3.880 ms, resulting in a consistency border line of d ± 1.96 Sd = 0.855 ±1.96 × 3.880 ms (i.e., -6.750 to 8.460 ms). As shown in Figure 7, only 1.7% (1/59) of the dots fell outside the 95% consistency border line, indicating that the two measurement methods shared good consistency (Figure 7).

Figure 6 Correlation and regression analysis of Tau-c and Tau-D.The horizontal coordinate is the Tau-c, and the vertical coordinate is the Tau-D. The regression equation was y = 1.4 + 0.95x. Tau-c:catheter-derived Tau; Tau-D: Doppler-derived Tau.
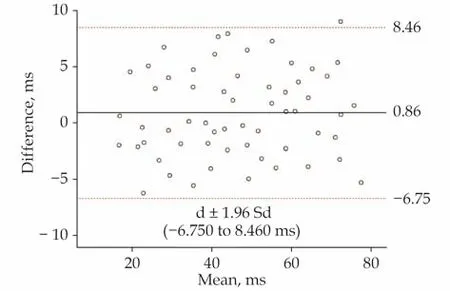
Figure 7 Bland-Altman agreement analysis. The horizontal coordinate is the average of Tau-c and Tau-D, and the vertical coordinate is the difference between Tau-c and Tau-D. The solid line is the average difference between Tau-c and Tau-D (0.855 ms).The dotted line is d ± 1.96 Sd (-6.750 to 8.460 ms). Tau-c: catheterderived Tau; Tau-D: Doppler-derived Tau.
DISCUSSION
In this study, we used the logarithmic equation group to calculate Tau-D on the basis of fifty-nine continuous-wave aortic regurgitation spectra of different hemodynamic stages and compared Tau-D and Tau-c values. The results indicated a good correlation and consistency between Tau-c and Tau-D.
There are four stages in left ventricular diastole:the isovolumic diastolic period, the rapid filling period, diastasis, and atrial contraction. In the first two periods, the most important factor of left ventricular diastole is active ventricular relaxation,which is an energy-consuming process.[4,23]For the last two periods, left ventricular compliance or rigidity is more important. It is well established that the left ventricular diastolic time constant, Tau, is the best index to describe left ventricular diastolic function. As Tau is measured during the isovolumic diastolic period, when both the aortic valve and mitral valve are closed, it is less affected by both preload and afterload.
Compared with Yamamoto,et al.’s[17]noninvasive measurement of Tau by continuous-wave aortic regurgitation Doppler spectra, this method has some advantages: (1) simplicity. We needed to measure only two time intervals, (t2-t1) and (t3-t1),from the ascending branch of the aortic regurgitation spectrum and substitute those two numbers into the equation group; (2) accuracy. The logarithmic equation group was deduced using only Weiss’ equation, the simplified Bernoulli’s equation,and universal mathematical laws; none of Yamamoto’s four assumptions were needed. The integrity of Weiss’ theory was maintained; and (3) Tau can be measured even in mild or trace aortic regurgitation. Initially, three integral points, (t1, 1 m/s),(t2, 2 m/s) and (t3, 3 m/s), were chosen simply because we wanted to make the calculation easier. To make all three points available, the spectrum needs to be sufficiently clear, which means the presence of at least mild-to-moderate aortic regurgitation. Using computer software, we were able to choose any three points on the ascending branch of the aortic regurgitation spectrum. That is, theoretically, only a portion of the aortic regurgitation spectrum is required for us to proceed. This greatly increased the candidate population. However, if all three points are chosen on the small portion of the regurgitation spectrum, accurate measurement becomes more difficult.
We chose the left carotid artery as the entrance site to provide a shorter distance to the heart compared with the femoral artery entrance. The ultrasound conveniently displayed the aortic valves and the relevant structures in a real-time manner, which was extremely helpful in targeting the injury.Moreover, the ultrasound was useful in the observation and/or evaluation of regurgitation and its severity, making the maneuver simple and repeatable. Furthermore, the ultrasound-guided method to develop the acute ischemic left ventricular diastolic dysfunction resulted in a higher success rate and no radiation contamination.
In this study, microspheres (average diameter =51.7 μm) were administered repeatedly to the left coronary sinus. The microspheres completely blocked the distal ends of the coronary arterioles and caused extensive micro infarction; after repetitive microsphere administration, the animals had increased LVEDP and longer Tau-c; these variations suggest the successful creation of the left ventricular diastolic dysfunction model.
LIMITATIONS
There are also some mentionable limitations associated with this method. Firstly, only candidates with aortic regurgitation can be used to calculate Tau, which is the same for Yamamoto’s method.Secondly, accurate measurement of the two time intervals is required. With currently available commercial echo machines, it is difficult to achieve measurement of the two time intervals that is accurate enough to feed the logarithmic equation group.However, with current advances in computer technologies, we believe the problem of accurate measurement could be resolved in the near future. Last but not least, we used an acute aortic regurgitation model. On the basis of this study, the method is not guaranteed to be applicable to a chronic setting. Future studies of further applications of this method are necessary to prove it thoroughly.
In this study, great effort was made to measure the two time intervals accurately. This required close collaboration between the echocardiographers and engineers. In the future, this logarithmic equation group may be integrated into the echo machine, and all the posttreatment work performed in this study will be automatically executed by the machine. We can imagine that future engineers will be able to assign a soft button for Tau calculation in aortic regurgitation patients. Once the aortic regurgitation spectrum is collected, the scanner will hit this button and the Tau will be provided immediately.
CONCLUSIONS
From this study, we draw the following conclusions: (1) Tau can be noninvasively measured in an echo lab in beagles with aortic regurgitation through continuous-wave Doppler spectra; (2) the logarithmic equation group can be based on Weiss’equation, Bernoulli’s equation, and universal mathematical laws; and (3) accurate measurement can be achieved with the help of echo engineers, which suggests a gap still exists between the bench and bed.
In a word, there is a clinical call for more accurate measurement. We believe that in addition to facilitating the calculation of Tau, more accurate measurement will help us better understand more detailed changes that have been previously overlooked. With the rapid development of computer technology, it is possible that this clinical call is a harbinger of a great progress in echocardiography and beyond.
ACKNOWLEDGMENTS
This study was supported by the National Natural Science Foundation of China (No.81771833), and the Beijing Natural Science Foundation (No.7172209).All authors had no conflicts of interest to disclose.The authors sincerely appreciate the tremendous help from Mindray Medical International Limited,especially Dr. Yong-Qiang DONG. Without this collaboration, our clinicians would not have been able to achieve the accurate measurement of the Doppler spectrum. At the same time, a lot of thanks to Michael Chen (Telus Mobility, Canada) for his development of the equation group resolving software, which is very helpful.
 Journal of Geriatric Cardiology2021年4期
- Journal of Geriatric Cardiology的其它文章
- Usefulness of the Japanese version of Rapid Dementia Screening Test for mild cognitive impairment in older patients with cardiovascular disease: a cross-sectional study
- Real world effectiveness of PCSK-9 inhibitors combined with statins versus statins-based therapy among patients with very high risk of atherosclerotic cardiovascular disease in China (RWE-PCSK study)
- sDR5-Fc inhibits macrophage M1 polarization by blocking the glycolysis
- Uric acid is associated with cardiac death in patients with hypertrophic obstructive cardiomyopathy
- Catheter ablation for atrial fibrillation in heart failure: untying the Gordian knot
- Late-chronic cardiotoxicity and heart failure caused by ibrutinib:a case report and literature review
