PVC Formulation of Anastrepha suspensa Pheromones Suitable for Field Studies
Dniel Kuzmich, Zchry A. Kwgoe, Spencer S. Wlse,,*
a San Joaquin Valley Agricultural Sciences Center, Agricultural Research Service, United States Department of Agriculture, Parlier, CA 93648, USA
b Agricultural and Environmental Chemistry Graduate Group, University of California, Davis, CA 95616, USA
Keywords:Anastrepha Anastrephin Epianastrephin PVC lure Controlled release
ABSTRACT Tephritid flies threaten the production of fruits around the world. In the Americas, populations of the genus Anastrepha are monitored with trapping networks as part of pest management programs. Here,we report the formulation of male Anastrepha suspensa (Loew) pheromones, (±)-anastrephin and (±)-epianastrephin, into a poly(vinyl chloride) (PVC) polymer-based lure ready for trap deployment. The PVC polymer disks(100 mg)contain 10%by weight of(±)-epianastrephin and(±)-anastrephin in a naturally occurring 7:3 diastereomeric ratio,respectively.Emission of the pheromones from the disks into an airstream was evaluated as a function of the abiotic environmental parameters, absolute humidity and temperature. Kinetic data supports a diffusion-controlled mechanism of release from the matrix with first-order rate constants that decreased about ten-fold as the temperature was lowered from 30 to 15 °C. As such, the emission of volatile pheromones from the disks is suitable to last for several weeks in the field. This kinetic approach, which can be easily extended to the diffusion-controlled release of other attractants from polymeric matrices,yields laboratory predictions of the potential for environmental loss prior to conducting field bioassays.
1. Introduction
Across the Americas, pest management efforts are required to minimize the potential for fruit to host Anastrepha sp. (Diptera:Tephritidae).Within the United States alone,host fruits are valued at more than 7 billion USD annually [1,2]. Anastrepha populations in commercial production areas are monitored using trapping networks, which ultimately guide a variety of control efforts:integrated pest management (IPM) strategies, insecticidal sprays,quarantine regulations, and the sterile insect technique (SIT).Within Florida and the Greater Antilles, the Caribbean fruit fly,Anastrepha suspensa (A. suspensa), is a species of concern and the male pheromones are of IPM interest due to their role in the natural aggregation strategy [3-5].
Male A. suspensa produce the volatile pheromones (R,S,S)-(-)-and (S,R,R)-(+)-anastrephin and (S,S,S)-(-)- and (R,R,R)-(+)-epianastrephin, which are attractive to males and females in short-range bioassays [5-14]. Yet, a lure for A. suspensa involving these pheromones remains elusive due, at least in part, to insufficient availability of test material.Although several elegant syntheses have been reported[4,15-25],most do not yeild sufficient mass to conduct formulation studies,let alone replicated field trials[26].A recent synthesis provides relatively convenient access to gramscale quantities of (±)-anastrephin (1) and (±)-epianastrephin (2)[27].In an attempt to design a trapping system that exploits these pheromones, effort was initiated to formulate a conventional poly(vinyl chloride) (PVC) polymer-based lure [28-30]. The present study reports the kinetics associated with the release of 1 and 2 from the PVC matrix as a function of temperature and absolute humidity—a critical first step toward field deployment and trapping efficiency studies.
2. Methods and materials
2.1. Chemicals
PVC (low-molecular weight, 524 980), dibutyl phthalate (DBP),dioctyl phthalate (DOP), anhydrous tetrahydrofuran (THF;inhibitor-free), and 10% palladium (Pd) on carbon (C) were purchased from Aldrich Chemical Co., Inc. (USA). Analytical grade methyl tert-butyl ether (MTBE) was purchased from Fisher Scientific (USA). Polymer disks were formed in porcelain wells (CoorsTMmulti-well plate;Sigma-Aldrich,USA).Synthetic 1 and 2 were prepared in-house (United States Department of Agriculture (USDA))with greater than 99% purity, as verified by gas chromatography(GC) and electron impact mass spectrometry (GC-EIMS). Catalytic hydrogenation (101 kPa) of 1 using 10% Pd/C in ethyl acetate yielded 3, as an internal standard (IS) for quantitative analysis(Fig. 1) [3,27].
2.2. Formulation
PVC-pheromone disks were formulated to afford 10%by weight of total pheromone, 2 and 1 (7:3 ratio). In a conical vial, PVC(251.5 mg), DBP (125.6 mg), DOP (127.5 mg), 2 (38.5 mg), and 1(16.5 mg) were dissolved in THF (1.665 g). The mixture was blended with a spatula,and then the vial was capped and warmed at 40°C.After 20 min,the mixture was blended again as described above,and then about 400 mg was pipetted into respective porcelain wells. The THF was allowed to evaporate by warming the porcelain plate at 40°C for 15 min and then leaving it at room temperature overnight, affording three PVC-pheromone disks with a mass of(110.4±0.8)mg(mean±standard deviation,¯x ± s).Note that THF evaporation above 40 °C caused bubbles to form in the polymer resin, while evaporation at room temperature resulted in cloudy disks, presumably due to evaporative cooling.
2.3. Collections of volatile pheromone
The volatile collection system reported by Walse et al. [5] was modified; 1/4 inch (1 inch = 25.4 mm) diameter Teflon tubing was used for all plumbing, and all connections were made using standard Swagelok fittings, unless otherwise noted. A compressor pushed air (413 kPa) into a 15.2 m3environmental chamber with programmable temperature and through an activated carbon filter(Westates Vocarb 48C;Siemens Industry,Inc.,USA)connected serially to a metering valve. Airflow was then directed into a 226.2 L chamber,pressurized to about 14 kPa,which housed a tunable terrarium humidifier (Zoo Med®, USA) set to maintain an absolute humidity, Ca-H2O, of (0.5846 ± 0.0096) mmol·L-1in the air exiting the chamber at all temperatures studied (vide infra). Air exiting the chamber was directed into a manifold (Model VCS-ADS-6AFM6C; Analytical Research Systems®(ARS), USA), which metered the flow of four parallel airstreams to 100 mL·min-1.Three ‘‘sampling” volatile collection chambers (VCCs; 10 inch × 2 inch diameter), and a fourth VCC containing only a HOBO®logger(model #UX100-003; USA) to record temperature and humidity at 5 min intervals, were connected to the respective airstreams.A formulated disk(about 19 mm in diameter and 0.15 mm in thickness)was fixed to the internal glass surface of a Petri dish(30 mm in diameter and 5 mm in depth) with one face exposed. A diskcontaining dish was then introduced into each of the three ‘‘sampling” VCCs. Pheromones released from the disk were captured on an ARS glass-tube (11.5 cm long and 4 mm internal diameter(id) volatile collector trap (VCT) containing 50 mg Super-Q adsorbent(AlltechTMAssociates,USA),which was inserted into the outlet terminal of the VCC.

Fig. 1. Pheromone structures and GC-EIMS total ion chromatogram showing the relative retention of 1 and 2 to IS 3.
The pheromone emitted from the PVC disks was quantified using GC-EIMS over temporal intervals at the temperatures explored in this study—that is, the temperatures pertinent to the endemic range of A. suspensa, the Greater Antilles and Florida:(33.2 ± 0.1), (26.7 ± 0.3), (20.7 ± 0.3), and (15.1 ± 0.4) °C. To prepare a sample for GC-EIMS analysis, a VCT was removed (and replaced if necessary), flushed with MTBE (8 mL) into a 10 mL volumetric glass vial (slow-blow Kuderna-Danish) containing 1 mL of IS 3 in MTBE (16.1 ng·μL-1). The eluant was reduced to 1 mL via passive concentration in a fume hood, and transferred with a pipette to a 2 mL glass GC vial. Vials were clamp-sealed with 9 mm diameter Teflon-lined caps in preparation for GC-EIMS analysis. The collection efficiencies of 1 and 2 were greater than 98% over the range 5000-0.5 ng, as reported in Walse et al. [5]. In general, the concentration of emitted pheromone was quantified initially, [1 and/or 2]t=0or [1 and/or 2]0,and at approximately daily intervals thereafter, [1 and/or 2],where t is time, t = 1 d, 2 d, 3 d, etc.
2.4. Gas chromatography-electron impact mass spectrometry
In general, 1, 2, and IS 3 were identified based on chromatographic, spectrometric, and spectroscopic agreement with the published literature. GC retention time (tR) and/or mass spectrometry were used for chemical verification, and the IS 3-normalized integral of peak area, referenced relative to linear least-squares analysis of a six-point plot of calibrant versus detector response, was used to determine concentration in the volatile collection studies. Detector response and retention indices were determined each day in calibration studies involving serial dilutions of 1 in known volumes of MTBE (i.e., calibration standards).
A 7890A gas chromatograph and a 5973 N quadrupole mass spectrometer (Agilent Technologies, USA) was operated with electron impact ionization (70 eV). Cool on-column injections (1 μL)were conducted at 143 °C with helium (He) carrier gas(1.0 mL·min-1). The oven program was isothermal at 140 °C for 1 min, heated at 4 °C·min-1to 150 °C, isothermal for 70 min,heated at 30 °C·min-1to 230 °C, and then isothermal for 2 min.GlasSeal connectors (Supelco®, USA) were used to fuse four columns in series: a deactivated column (long (L) = 8 cm,id=0.53 mm;Agilent Technologies,USA)onto which the injection was deposited; a deactivated retention-gap column (L = 2 m,id = 0.25 mm; Agilent Technologies, USA); a DB-1701 analytical column (L = 60 m, id = 0.25 mm, film thickness (df) = 0.25 μm;J&W Santa Clara, USA); and, finally, a deactivated column(L = 1.5 m, id = 0.25 mm; Agilent Technologies, USA) that was directed into the detector. Transfer-line, source, and quadrapole temperatures were respectively 280, 230, and 150 °C. Analyte tR(n = 10) were as follows: 1: (60.26 ± 0.02) min; 2: (62.98 ± 0.01)min; and IS 3: (71.06 ± 0.03) min (Fig. 1).
Full scan spectra from 50 to 600 mass-to-charge ratio (m/z)with±0.3 m/z resolution were acquired at 0.34 s per scan for qualitative verification, data are shown as m/z (% relative intensity):1: 194 (3), 179 (33), 151 (14), 135 (33), 108 (61), 81 (100); 2:194 (2), 179 (23), 151 (11), 135 (24), 108 (54), 81 (100); and 3:196 (0.8), 181 (72), 153 (71), 137 (12), 110 (61), 83 (100). Ions noted in italics were extracted from the total ion chromatogram(TIC) for quantification.
3. Results
3.1. Rate of pheromone release
At each temporal interval of time (t), gaseous (g) pheromone loss from a solid (s) disk was quantified as described above using GC-EIMS. Pheromone loss over the experimental time course was expressed by the differential rate equation:

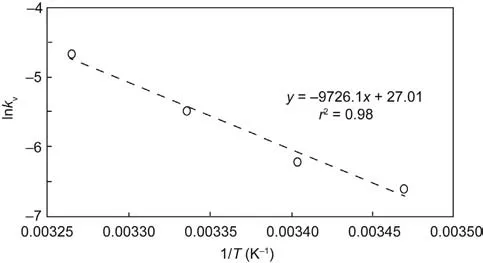
Experimental data support the kinetic model, a first-order kinetic approximation of pheromone loss; least-squares analyses of ln([1 and/or 2]t/[1 and/or 2]0) for triplicate trials plotted versus time yielded a linear composite regression with a slope of -kv. At(33.2 ± 0.1), (26.7 ± 0.3), (20.7 ± 0.3), and (15.1 ± 0.4) °C, kvhad respective values of 9.51 × 10⁻³, 4.14 × 10⁻³, 1.57 × 10⁻³, and 1.34 × 10⁻³d-1(Fig. 2). Half-lives (t1/2), calculated respectively from ln(2)/kv, were approximately 73, 167, 352, and 519 d.
Release rate increased with temperature (T), empirically approximated by the Arrhenius equation:

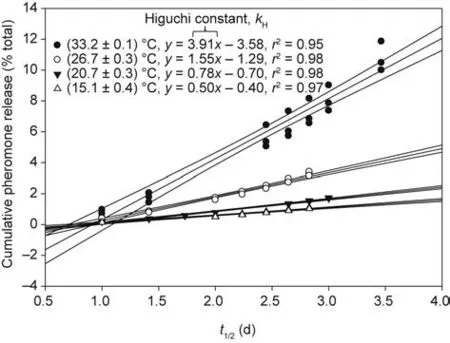
where Q is the cumulative loss of chemical(as a fractional percentage of the total (%)) at time t (d), and kHis the Higuchi constant(d-1). Providing further evidence to support a diffusion-controlled mechanism of release from the PVC-pheromone disks, leastsquares analyses of the cumulative loss of 1 and/or 2 for triplicate trials plotted versus t1/2yielded a composite linear regression with a slope of kHand a correlation coefficient of r2≥0.95;respectively,0.95, 0.98, 0.98, and 0.97 for (33.2 ± 0.1), (26.7 ± 0.3), (20.7 ± 0.3),and(15.1±0.4)°C(Fig.4).To our knowledge,this is the first application of Higuchi modeling to pheromone release from a‘‘thin-film”polymer matrix.

Fig. 2. Results support a first-order loss of 1 and/or 2 from the PVC-pheromone disks, as a least-squares analyses of the data yielded a line with a slope of -kv, the observable rate constant of volatilization from the PVC disks,which increased with temperature (95% confidence intervals (CI) shown).
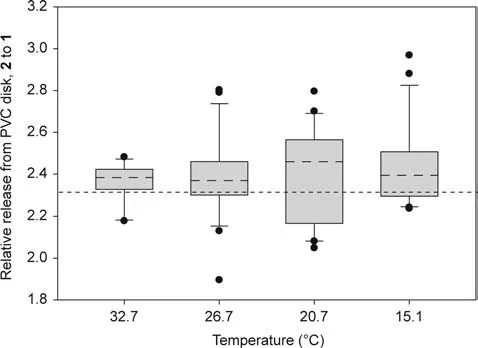
It is critical to note that the relative loss of 2 to 1 from the PVC disks remained constant at approximately 2.3 to 1, the naturally occurring diastereomeric ratio, across all temperatures (Fig. 5). A single-factor analysis of variance (ANOVA) was not significant(F3,76= 0.72, P = 0.74), indicating that the overall mean ratio of 2 to 1, 2.39 ± 0.18, could be used to describe the ratio observed for a respective temperature at the 95% confidence interval (CI) [33].This finding provides additional evidence to support the kinetic and mechanistic models described above.
4. Discussion
At present,trapping systems for key pests from the genus Anastrepha, including A. suspensa, rely on food-based lures that exhibit poor selectivity and are costly from an operational perspective[1,2,34]. In an attempt to design a trapping system that exploits known volatile pheromones of A. suspensa, a PVC polymer-based lure was formulated in a disk containing 10% by mass of 1 and 2 in a 3:7 diastereomeric ratio. The release rate of pheromone increased with temperature, with no change in the formulated ratio of 1 to 2. The results indicate that across the temperature range over a period of several weeks, <10 ng of 1 and 2 will be released from each disk per hour—a finding that is consistent with the emission rates of1and2from a‘‘calling”male A.suspensa[5,6].

Fig.3. The relationship between the observable rate constant of volatilization,-kv,and temperature was empirically estimated.

Fig. 4. This Higuchi plot across temperatures showing linearity from least-squares analysis (95% CI shown), as evidenced by respective correlation coefficients (all r2 ≥0.95), provides further evidence to support a Fickian diffusion-controlled mechanism of volatile release from the PVC-pheromone disks.

Fig. 5. Box-and-whiskers plot showing the median (- - -) release of 2 to 1 from PVC-pheromone disks as a function of temperature, relative to the 1st through 3rd quartiles (gray rectangles), outliers (·), and the ratio of formulation, about 2.3 to 1(-), which matches the naturally occurring diastereomeric ratio of the volatile pheromones [5,6].
The relationship between molecular diffusivity, viscosity (μ),and temperature (T) can be generalized by the Stokes-Einstein equation:

where DES/ASis the translational diffusion coefficient (cm2·s-1) of1and2, kBis the Boltzmann constant (1.38 × 10⁻²³kg·m2·s-2·K-1),and r is the hydrodynamic radius of ‘‘spherical”1and2(about 0.45 nm) [35]. Preliminary studies indicated that a change in relative humidity did not change the mass of the polymeric disk or, in turn, μ. This finding contrasts with the use of humectant-based matrices to emit1and2at rates that are directly proportional to humidity levels [5]. Accordingly, when considering polymeric matrices—or, at least, the PVC used in this study—the diffusioncontrolled release will directly vary with T.The influence of geometry on rates of diffusion is well-established [36], so the kinetic models used above to describe polymeric disks can be extended to other geometries, such as cylindrical ‘‘plugs” and spheres, with a longer history of use in trapping systems.
Future work will report on integrating the PVC-pheromone disk(and/or plugs) into potential Anastrepha trapping systems for field deployment, as well as capture efficiency studies associated with such efforts. From a broader perspective, this work provides a kinetic framework for predicting Fickian diffusional release of insect attractants from polymeric matrices as a function of environmental conditions,and particularly temperature,making it possible to initiate field bioassays with a chemical understanding and/or expectation of lure longevity.
Acknowledgments
This research was funded by the USDA-Agricultural Research Service and the Cooperative Research and Development Agreement(#58-3K95-4-1665) with Betterworld Manufacturing (Fresno,USA).
Compliance with ethics guidelines
Daniel Kuzmich, Zachary A. Kawagoe, and Spencer S. Walse declare that they have no conflict of interest or financial conflicts to disclose.
Chemical Characterization
1: IR (neat) 2942, 2871, 1780, 1016 cm-1;1H NMR (300 MHz,Chloroform-d) δ: 5.68 (dd, J = 17.6, 10.6 Hz, 1H), 5.00 (d,J = 1.5 Hz, 1H), 4.95 (dd, J = 4.7, 0.8 Hz, 1H), 2.38 (dd, J = 16.4,14.8 Hz, 1H), 2.24 (dd, J = 16.4, 6.4 Hz, 1H), 2.10 (dd, J = 14.8,6.4 Hz, 1H), 2.01 (dd, J = 7.9, 3.0 Hz, 1H), 1.84 (ddd, J = 8.2, 6.2,3.9 Hz, 1H), 1.73-1.59 (m, 2H), 1.59-1.43 (m, 2H), 1.38 (s, 3H),and 1.06 (s, 3H).13C NMR (75 MHz, CDCl3) δ: 176.12, 147.76,111.59, 86.03, 53.43, 38.46, 37.90, 37.02, 29.46, 20.90, 20.43, and 16.37.
2: IR (neat) 2942, 2868, 1770, 1029 cm-1;1H NMR (300 MHz,CDCl3) δ: 5.89 (ddd, J = 17.4, 11.2, 0.9 Hz, 1H), 5.19-5.03 (m, 2H),2.65-2.30 (m, 3H), 2.16-1.94 (m, 3H), 1.31 (dd, J = 13.1, 5.3, 1H),1.26 (s, 3H), and 1.04 (s, 3H).13C NMR (75 MHz, CDCl3) δ:176.14, 139.98, 112.94, 86.34, 55.51, 38.62, 37.19, 36.07, 30.35,29.01, 20.38, and 20.21.
3:1H NMR (300 MHz, CDCl3) δ: 2.49 (dd, J = 16.3, 14.9 Hz,1H),2.31(dd,J=16.3,6.5 Hz,1H),2.15-1.90(m,2H),1.85-1.69(m,2H),1.68-1.40 (m, 3H), 1.36 (s, 3H), 1.33-1.24 (m, 1H), 1.19-0.97 (m,1H), 0.91 (s, 3H), and 0.85 (t, J = 7.5 Hz, 3H).13C NMR (75 MHz,CDCl3) δ: 176.62, 86.57, 56.81, 37.68, 36.36, 35.68, 29.40, 27.64,24.44, 21.08, 20.53, and 9.05.
- Engineering的其它文章
- Preparation and Characterization of High-Strength Geopolymer Based on BH-1 Lunar Soil Simulant with Low Alkali Content
- Handheld Ultrasound Advances Diagnosis
- Nuclear Energy Seeks Revival with Advanced Fuel Options
- Mars Helicopter Exceeds Expectations
- Toward Systemic Thinking in Managing Environmental Risks
- The Experimental Advanced Superconducting Tokamak

