Co-Estimation of State of Charge and Capacity for Lithium-Ion Batteries with Multi-Stage Model Fusion Method
Rui Xiong*, Ju Wng Weixing Shen, Jinpeng Tin, Ho Mu
a Department of Vehicle Engineering, School of Mechanical Engineering, Beijing Institute of Technology, Beijing 100081, China
b Faculty of Science, Engineering and Technology, Swinburne University of Technology, Hawthorn, VIC 3122, Australia
Keywords:State of charge Capacity estimation Model fusion Proportional–integral–differential observer Hardware-in-the-loop
ABSTRACT Lithium-ion batteries (LIBs) have emerged as the preferred energy storage systems for various types of electric transports, including electric vehicles, electric boats, electric trains, and electric airplanes. The energy management of LIBs in electric transports for all-climate and long-life operation requires the accurate estimation of state of charge (SOC) and capacity in real-time. This study proposes a multistage model fusion algorithm to co-estimate SOC and capacity.Firstly,based on the assumption of a normal distribution,the mean and variance of the residual error from the model at different ageing levels are used to calculate the weight for the establishment of a fusion model with stable parameters.Secondly,a differential error gain with forward-looking ability is introduced into a proportional–integral observer(PIO) to accelerate convergence speed. Thirdly, a fusion algorithm is developed by combining a multistage model and proportional–integral–differential observer (PIDO) to co-estimate SOC and capacity under a complex application environment. Fourthly, the convergence and anti-noise performance of the fusion algorithm are discussed.Finally,the hardware-in-the-loop platform is set up to verify the performance of the fusion algorithm.The validation results of different aged LIBs over a wide range of temperature show that the presented fusion algorithm can realize a high-accuracy estimation of SOC and capacity with the relative errors within 2% and 3.3%, respectively.
1. Introduction
With growing concerns over energy shortage and air pollution,the world’s top automotive countries have successively announced the plans to ban fuel vehicles,which leads to inevitable electrification of transports worldwide[1]. Lithium-ion batteries(LIBs)have become the common on-board energy storage systems for electric vehicles,electric boats,electric trains,and electric airplanes due to their long lifetime,high energy density,and low cost[2,3].In these electrified transports, battery management systems (BMSs) play a critical role in the safe operation of LIBs.The key function of these BMSs is to provide an accurate estimation of state of charge(SOC)and capacity in real-time. Since LIBs are the complicated chemical systems, there is the coupling effect between battery SOC and capacity [4]. Furthermore, there is significant influence of ageing and a wide range of temperature on LIBs in electrified transports.These issues make co-estimation of SOC and capacity difficult.
1.1. Literature review
The existing SOC estimation methods are mainly classified into three groups [5] as shown in Fig. 1(a). They are basic methods,model-based methods, and data-driven estimation methods. Basic methods include the looking-up table and Ampere–hour integral methods. The looking-up table method requires high accuracy of voltage measurement and long rest time [6], which is not suitable for real-time use. The Ampere–hour integral method is applied to calibrate SOC once the initial SOC and true capacity of LIBs are known, which requires highly accurate current sensors [7].Model-based methods are developed based on electrochemical models (EMs), equivalent circuit models (ECMs), and fractional order models(FOMs)[8].In these methods,observers are designed to estimate SOC in real-time with high accuracy and strong robustness [9], which include the Luenberger observer [10], the sliding mode observer [11], the H infinity observer [12], the unscented particle filter [13], and the proportional–integral observer (PIO)[9].According to Ref.[14],the PIO has higher accuracy of SOC estimation than the other observers,but it has slower convergence and overshoot. Data-driven estimation methods for SOC apply blackbox models. They require a large amount of training data. Since these methods heavily rely on training data, they are prone to over-fitting [15]. The data-model fusion method is one of the data-driven estimation methods, which combines the online data training and model fitting to estimate SOC [4]. It has a certain limitation when it is applied in aged batteries operating over a wide range of temperature.
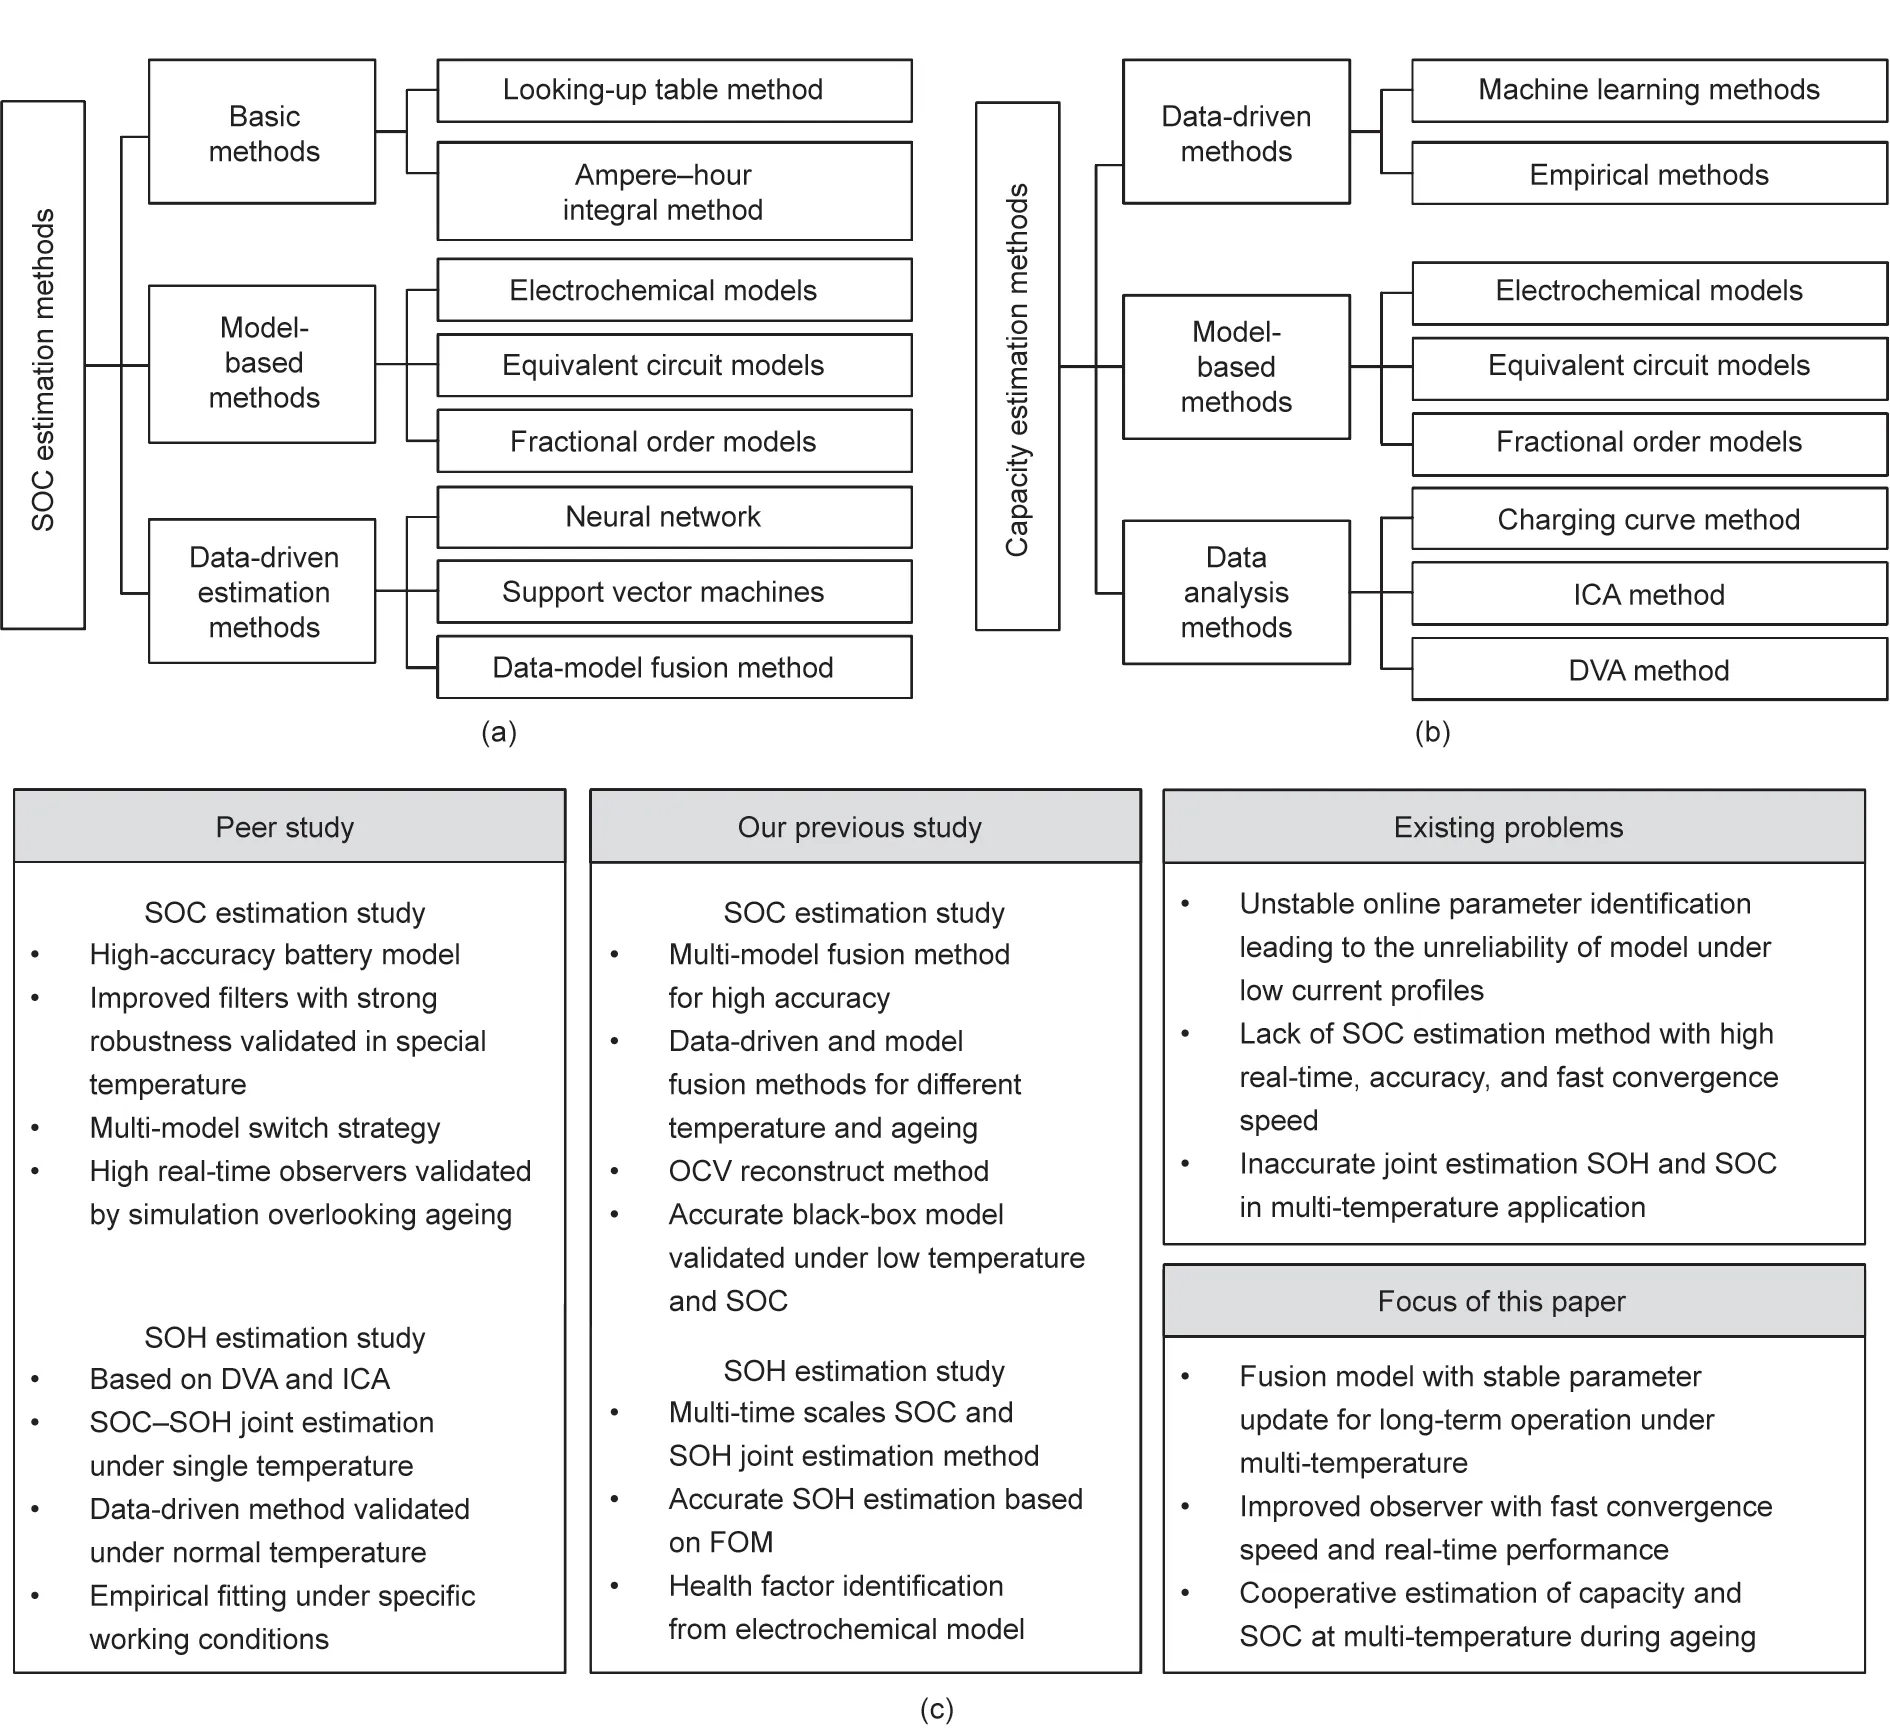
Fig. 1. Overview of SOC and capacity estimation methods: (a) main category of SOC estimation methods, (b) main category of capacity estimation methods, and (c) the problems of the existing SOC and capacity estimation methods and the focus of this paper.ICA:incremental capacity analysis;DVA:differential voltage analysis;SOH:state of health; OCV: open-circuit voltage; FOM: fractional order model.
Battery capacity is strongly related to the estimation of state of health (SOH), remaining life, and SOC. The existing capacity estimation methods are mainly divided into three categories as shown in Fig. 1(b), namely data-driven methods, model-based methods,and data analysis methods [16]. Data analysis methods include charging curve method [2], incremental capacity analysis (ICA)method [17], and differential voltage analysis (DVA) method [18].They highly depend on constant-current charge/discharge profiles which can rarely be used in practical applications. Model-based methods commonly use EMs [19], ECMs [5], and FOMs [20] to determine capacity,which have the closed-loop feedback to ensure estimation accuracy. Generally, when batteries are operating over a certain range of temperature, these methods exhibit high accuracy.However,when batteries are operating over a wide range of temperature,the accuracy of these methods starts to deteriorate.The data-driven methods mainly include machine learning methods [21] and empirical methods [22]. These methods require a large amount of training data to ensure stable and accurate estimation results.
1.2. Motivations and original contributions
The existing studies on SOC and capacity estimation have achieved their goals, such as short-term operation (i.e. ignoring battery ageing)and the specific temperature ranges.Fig.1(c)summarizes the problems of the existing SOC and capacity estimation methods. To solve these problems, the following efforts have been made:①To achieve stable model parameters through online identification during low current conditions, the mean and variance of the residual error from a multi-stage model are extracted to calculate the probability density function (PDF) based on the assumption of a normal distribution, which is then used to determine the fusion weights for the establishment of a fusion model. The parameters of the fusion model can be updated in real-time for a wide range of current profiles. ②A differential error gain with a forward-looking ability is introduced into a PIO/proportional–integral–differential observer(PIDO)to accelerate the convergence speed. ③A new algorithm is proposed to combine a fusion model and PIDO to achieve accurate co-estimation of SOC and capacity for aged batteries operating over a wide range of temperature.Hardware-in-the-loop (HIL) validation results show that the proposed algorithm achieves a good trade-off between estimation accuracy and real-time performance.
1.3. Paper organization
The remaining part of the paper is organized as follows:Section 2 introduces experiments, battery model, and the fusion model. The PIDO design and multi-stage fusion method are elaborated in Section 3. Section 4 demonstrates validation results and the corresponding discussions, followed by HIL validation results.Conclusions are drawn in the final section.
2. Battery model and fusion
2.1. Battery test
A battery experimental platform is established to collect data for the establishment of battery model and the verification of the proposed algorithm. The platform includes a BT2000 tester and a thermal chamber [23]. The BT2000 (Arbin Instruments, USA) is used to charge/discharge batteries and is controlled by a host computer. It has high voltage and current measurement accuracy(0.02%–0.05% full-scale range). The thermal chamber is used to ensure the tested batteries working at a constant temperature. In this study, the LIBs with the capacity of 25 A are tested, whose lower and upper cut-off voltages are 2.8 and 4.2 V, respectively.The battery tests include ageing cycle tests and characterization tests at different temperatures. The ageing cycle test is conducted repeatedly by charging and discharging the batteries at 12.5 A to accelerate battery ageing [24]. The characterization test is conducted periodically, which includes a static capacity test, an open-circuit voltage(OCV)test,a hybrid pulse power characteristic(HPPC)test [25], and a loading profile test. The static capacity test is used to determine battery capacity to indicate ageing levels in terms of SOH. The OCV test is used to obtain the OCV–SOC curve which plays a vital role in the SOC estimation method. The HPPC test is used to identify the model parameters. The loading profile tests are used to validate the estimation algorithm. After 600 ageing cycles, the capacity of the tested batteries has decayed below 80% which is defined as the end of life for LIBs in electric transports.
2.2. Battery model
To balance the real-time performance and estimation accuracy,an ECM with a resistor–capacitor (RC) network is adopted to simulate battery dynamic behaviors [26]. The discrete governing formula can be expressed as [27]
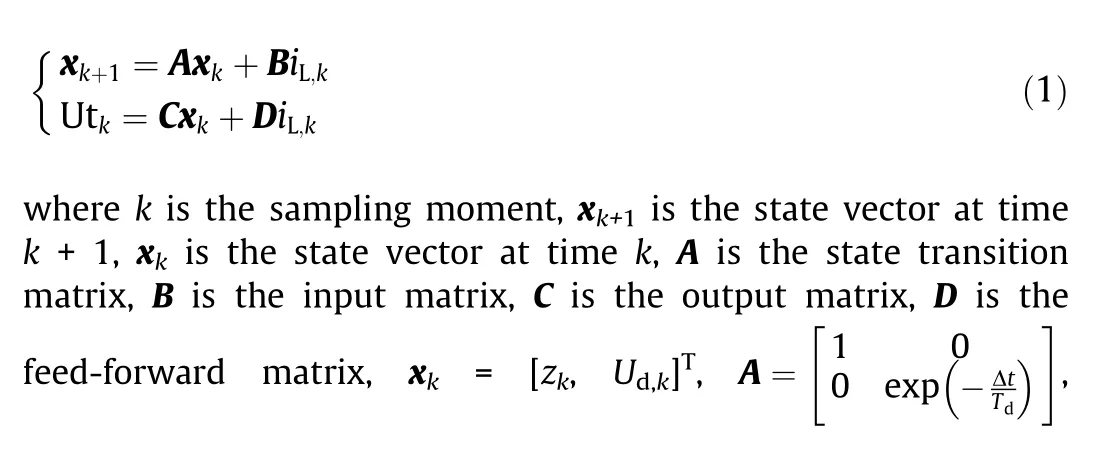
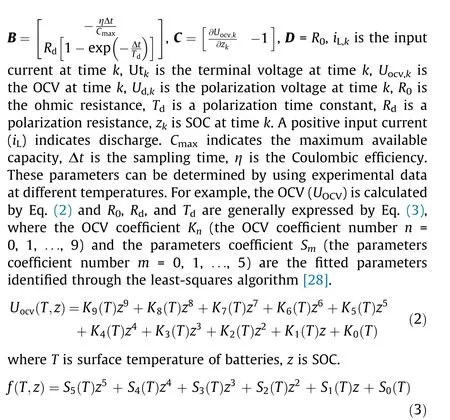
where f is the parameters function.
2.3. Parameter identification
After 600 cycling, the testing data of the batteries at multitemperatures and eight ageing points (Cycle 0, 100, 200, 300,400, 480, 550, and 600) are selected to establish battery model and verify the proposed algorithm. To balance the complexity of battery models for a full life cycle and accuracy, the testing data of the batteries at three ageing levels collected at Cycle 0(SOH = 1), Cycle 300 (SOH = 0.91), and Cycle 600 (SOH = 0.76)are employed to establish three models, respectively, named as Models 1,2,and 3 and identify the parameters of the three models.As the capacity is affected by temperatures, the tested capacity value at 25 °C is used to calibrate the SOH. The examples of these model parameters are provided at Cycle 0 as follows.Table 1 shows the parameters of the OCV–SOC–T model. Table 2 shows the parameters of the R0–SOC–T model.Fig.2 shows the model parameters at SOH = 0.76.
2.4. Limitation of a single model
A single model depends on the testing data at a certain ageing level, such as Model 2 corresponding to the data at Cycle 300,which has high accuracy for this ageing level. As batteries are operating under different ageing levels in their full cycle life, the precision of this single model will deteriorate, as shown in Fig. 3.
In Fig.3(a),the blue line indicates the simulation error of Model 1 built by using the data from the new battery at Cycle 0. Thismodel enjoys high simulation accuracy at Cycle 0. With the increase of ageing levels its root means square error (RMSE)increases. The green line demonstrates the performance of Model 2 established by using the data from the battery at Cycle 300. It has higher accuracy from Cycles 100 to 400, but lower accuracy for the new and severely aged battery. The red line represents Model 3 constructed from the data of the severely aged battery at Cycle 600. The RMSE of Model 3 decreases when the battery turns old. For example, Model 3 has high accuracy from Cycles 480 to 600.The same phenomenon occurs at another temperature as shown in Fig. 3(b). Therefore, the battery model established at the single ageing level cannot guarantee the accuracy of SOC estimation over a long-term operation.

Table 1Parameters of OCV–SOC–T model at Cycle 0.

Table 2 Parameters of R0–SOC–T functions at Cycle 0.
2.5. The feasibility of the fusion model

To circumvent the limitation of a single model, the multi-stage model fusion method is proposed to ensure high accuracy model for a long-term operation.The error between the measured voltage and simulation voltage can be used to calculate the weight of each model for the establishment of a fusion model. The parameters of the fusion model are calculated by Eq. (4).where p is the total number of model to be fused; i is the fused model number; ϑi,kis the weight of the ith model at time k; R0,i,kis the ohmic resistance of the ith model at time k; Rd,i,kand Td,i,kare the polarization resistance and the time constant of the ith model at time k,respectively;R0,F,kis the ohmic resistance of fusion model at time k;Rd,F,kis the polarization resistance of fusion model at time k; Td,F,kis the polarization time constant of fusion model at time k.These parameters are determined by Eq.(3),which build the dynamic constraint boundary of the parameters.
Due to the low computation burden and real-time performance,the recursive least square (RLS) algorithm is often used for online identification of battery parameters [29]. The main challenge of this kind of method is that the estimation error will increase under small excitation input [30]. The identified model parameters from both the fusion method and the RLS with forgotten factors are shown in Fig. 4. Since the testing current is zero in the first 315 s, the parameters of the model cannot converge by only using voltage information.To tackle this issue,the RLS is interrupted and the historical parameters are used to estimate SOC[28].In contrast to the RLS, the fusion method provides the stable parameters for the fusion model under low current conditions due to their existing boundary constraints. The weights for three models are shown in Fig. 4(d). According to the single model accuracy in Fig. 3(b), the RMSE of Model 2 is the smallest and the RMSE of Model 3 is the biggest, therefore the weight of Model 2 is the biggest and that of Model 3 is the smallest.These results indicate that the presented approach can effectively calculate the weight by residual analysis based on the assumption of a normal distribution.
The validation of the fusion model is observed in Fig.5.Models 1, 2, and 3 are established at Cycles 0, 300, and 600, respectively.The RMSEs of the fusion model at 25 °C are within 0.018 V in the whole range of 600 cycles,which are less than those of an individual Models 1, 2, or 3. Similarly, the maximal RMSE of the fusion model is 0.04 V,which is also less than those of an individual Models 1,2,or 3 at 10°C.The validation results indicate that the fusion model can achieve more accurate voltage simulation than a single model at different temperatures for a long-term operation.
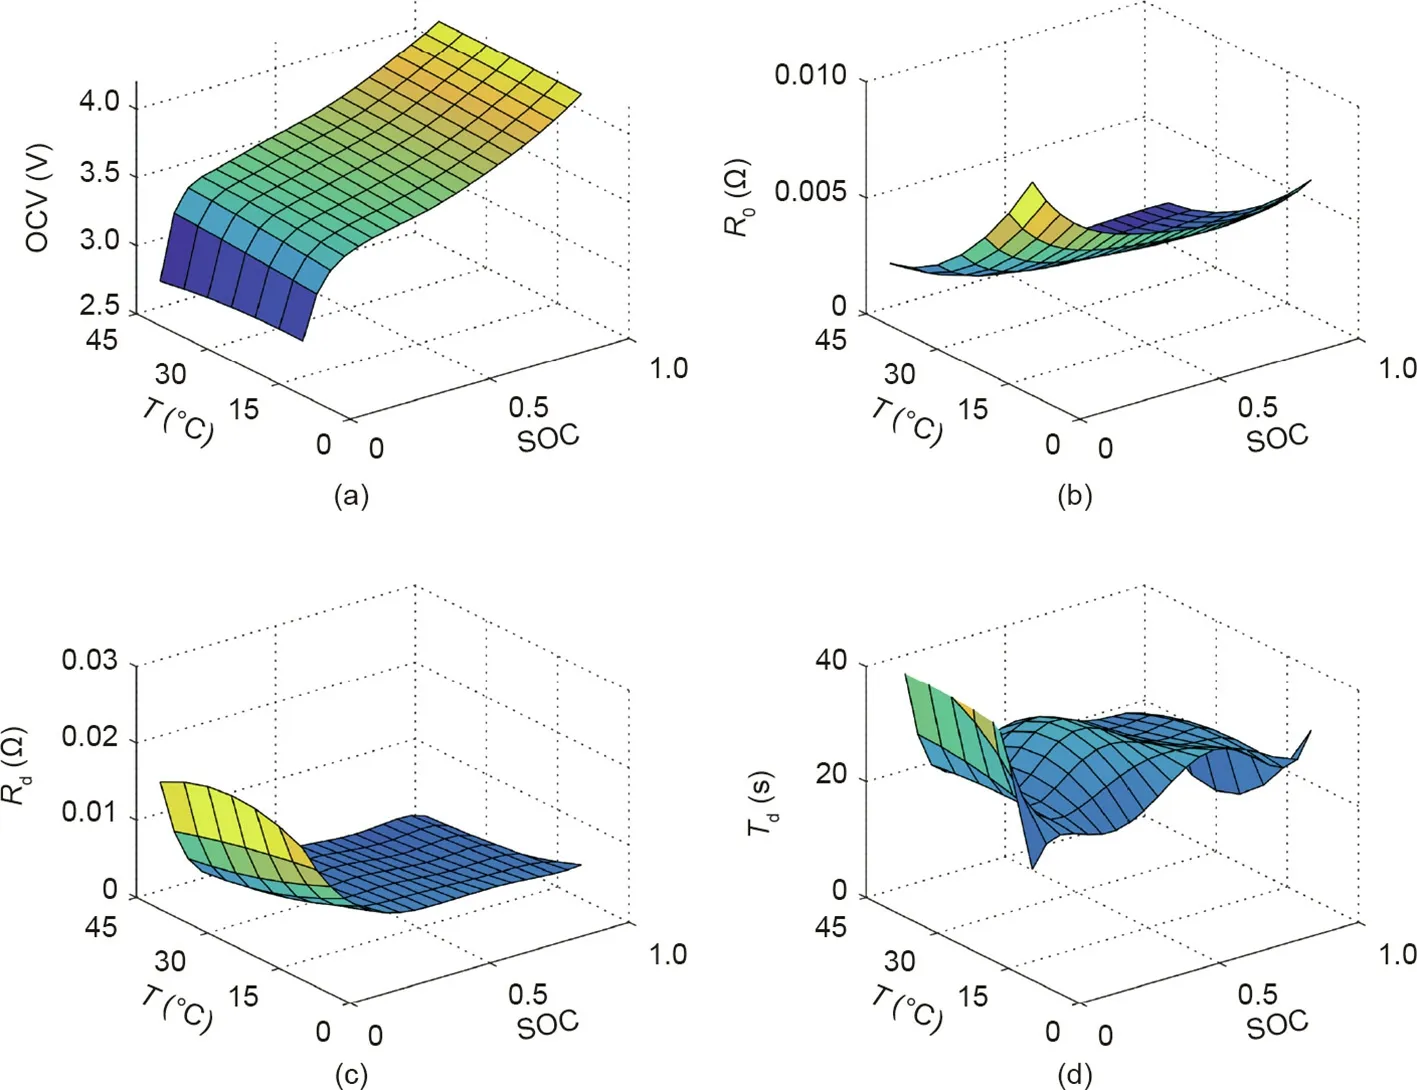
Fig. 2. Model parameters map of the tested battery at Cycle 0: (a) OCV map, (b) R0 map, (c) Rd map, and (d) Td map.
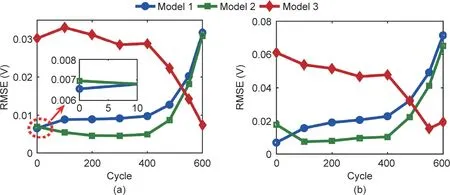
Fig. 3. Accuracy analysis of simulation voltage based on the parameters of the models at different ageing levels: (a) validation results at 25 °C and (b) validation results at 10 °C. RMSE: root means square error.
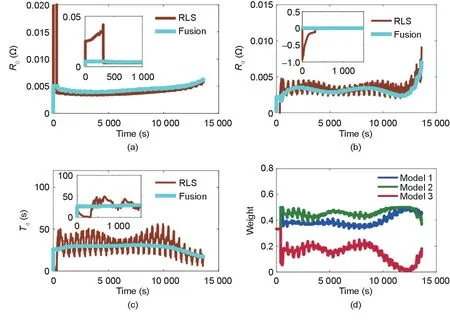
Fig. 4. Identified model parameters at Cycle 100 and 10 °C: (a) ohmic resistance, (b) polarization resistance, (c) time constant, and (d) weight value.
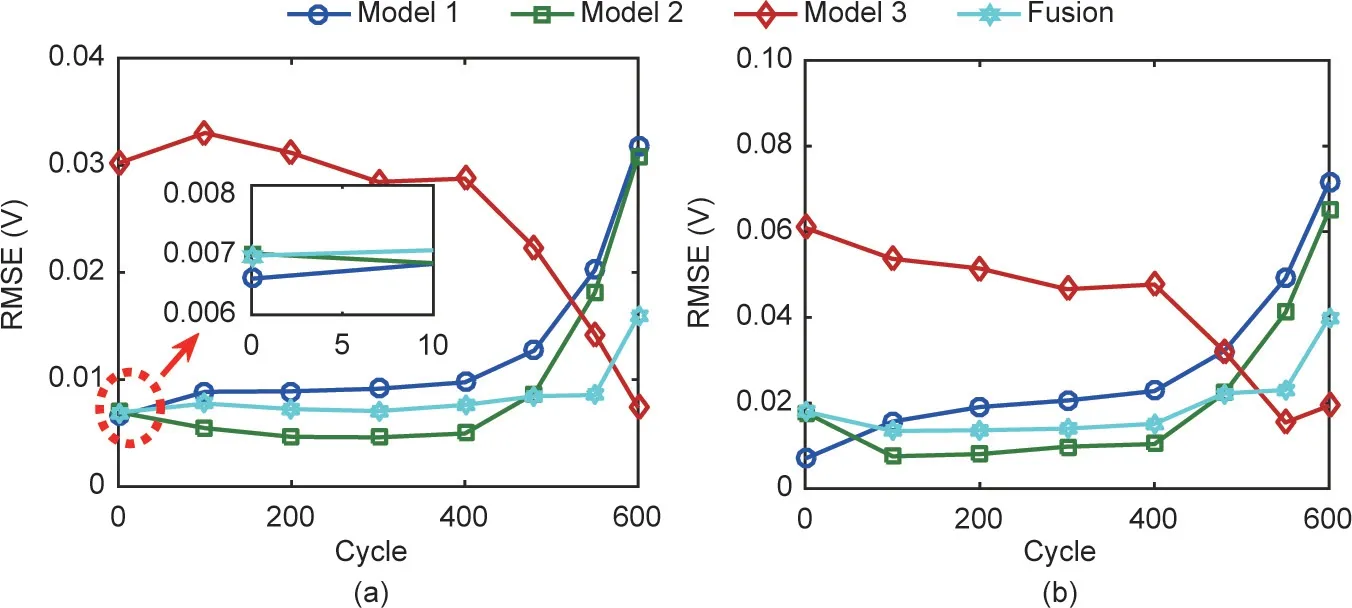
Fig. 5. Fusion model accuracy analysis: (a) validation results at 25 °C and (b) validation results at 10 °C.
3. State estimation method
3.1. Proportional–integral–differential observer
The PIO was firstly utilized to estimate battery SOC in Ref. [9].Since the derivative of error is ignored, the PIO exhibits overshoot and slow convergence speed. To accelerate the convergence and suppress the overshoot, the derivative of error is introduced into the PIO, leading to the improved observer named as a PIDO as shown in Fig. 6.
The discrete equations of the PIDO are used to observe the state of LIBs by following the terminal voltage:
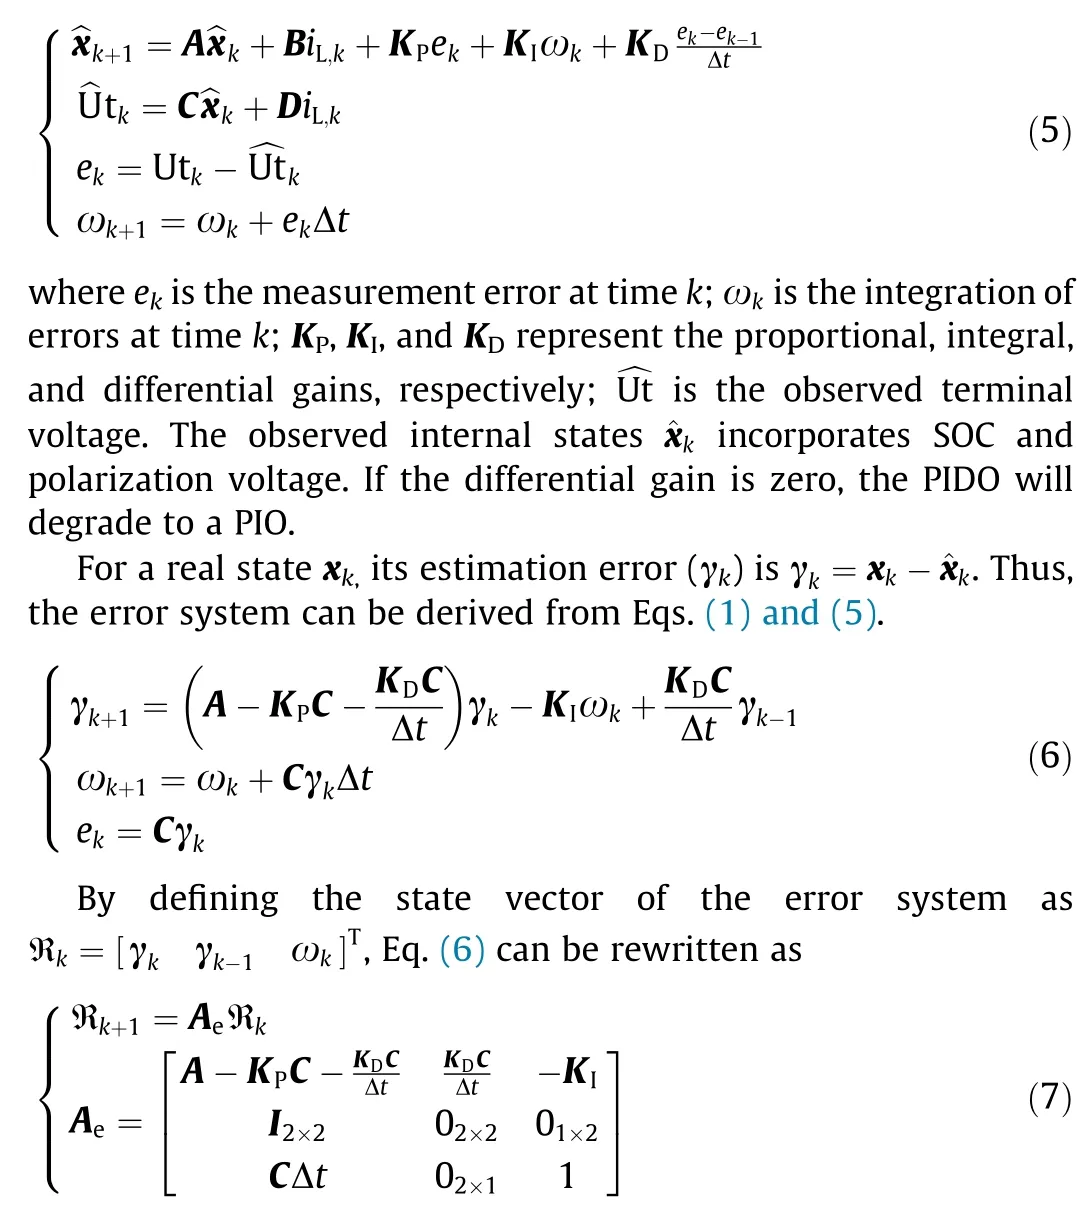
where KP, KI, KD∈R2×1, A ∈R2×2, C ∈R1×2. The state transition matrix of the error system, Ae∈R5×5, has full rank. I is the unit matrix.
To prove the estimation error is convergent, Aecan be changed to the following equation:
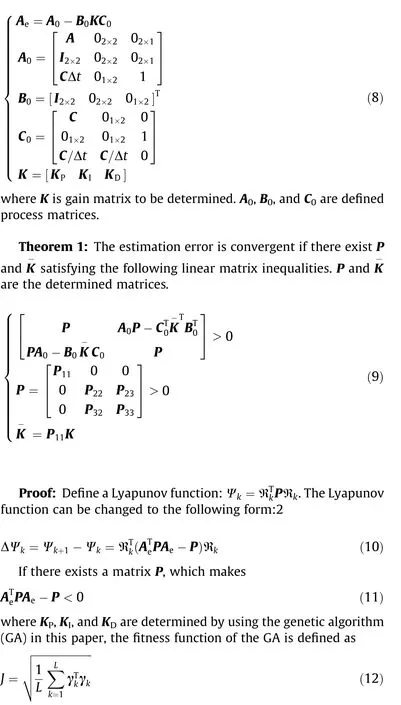
where J is the fitness function,L is the data length for optimization calculation.
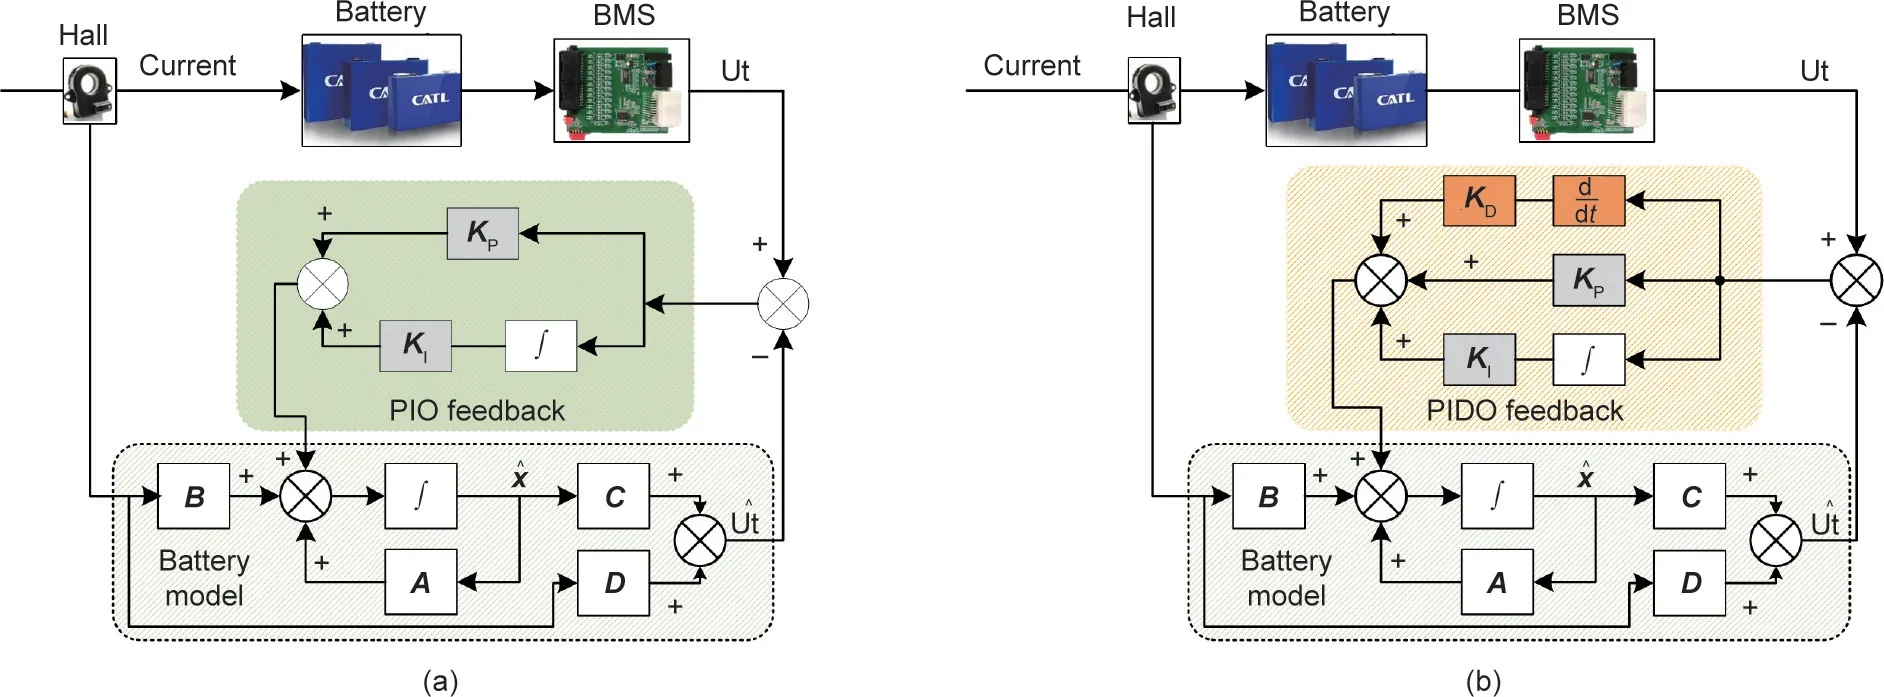
Fig. 6. Schematic diagram of (a) PIO and (b) PIDO. Ut: terminal voltage; Kp: proportional gains; KI: integral gains; KD: differential gains; ^Ut: observed terminal voltage; ^x:observed state vector; ∫: integral operation; d/dt: differential operation.
Then,the error system is asymptotically stable and would converge to the equilibrium point.Thus,the state observer would converge to the true states.
3.2. Co-estimation method
The fusion idea is usually adopted by multiple measurement information to provide a reference for decision-making in the field of remote sensing prediction and environmental perception [31].The fusion model identified at different ageing levels can be applied to estimate SOC for a long-term operation of batteries.The key to the fusion model is to use the weights of different models to calculate the state of fusion model. In Ref. [32], Eq. (13) was used to calculate the fusion state.
The weights are determined by statistics of residual error of the terminal voltage (RETV).ρi,kis the state vector of the ith model at time k.ℓkis a fusion state at time k.In this paper,the ℓ refers to the SOC and capacity. When the value of RETV increases, the accuracy of SOC estimation deteriorates.
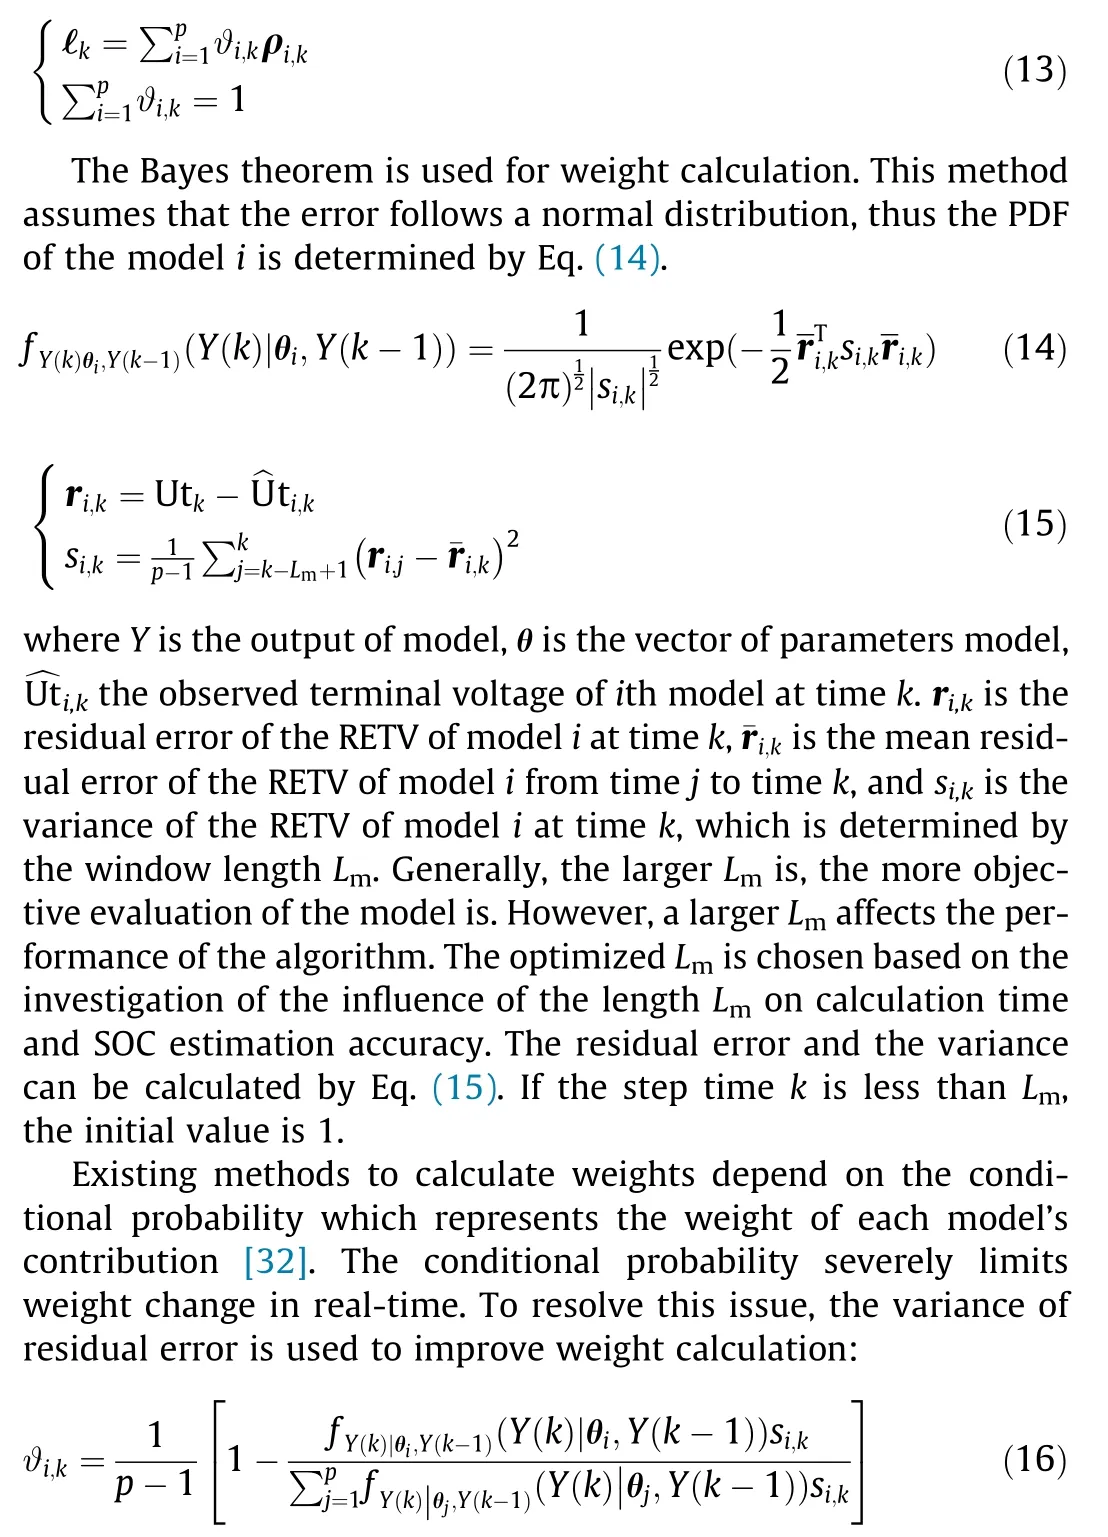
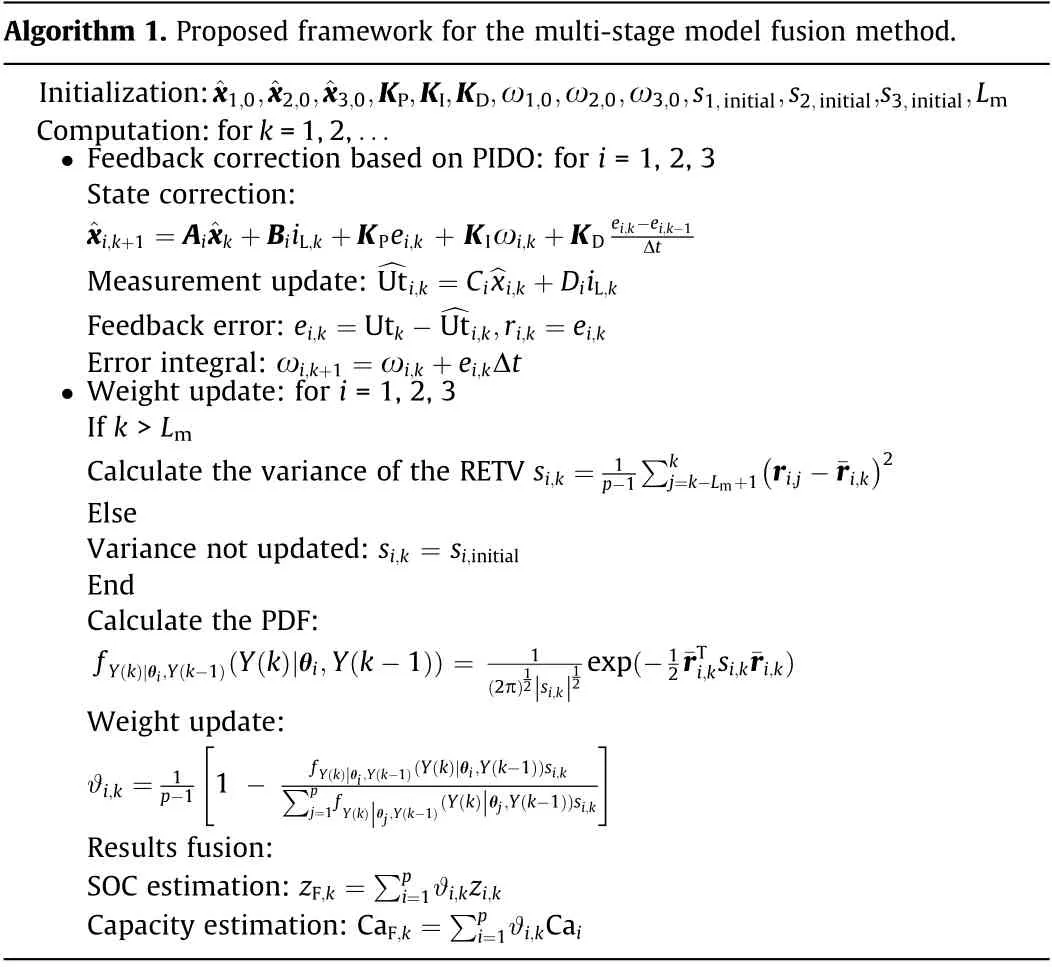
Fig. 7 shows the multi-stage model fusion estimation framework. Battery current, voltage, and temperature are sampled in real-time and fed into Models 1–3 together with the estimated SOC at the last moment to calculate model parameters by using Eqs.(2)and(3).Then,these parameters,including the ohmic resistance, polarization resistance, the time constant, and capacity, are fed into the PIDOs. The outputs of the PIDOs are the estimated states and voltage error. The weights of Models 1, 2, and 3 are calculated to determine the SOC and capacity. Caiis the capacity of model i which is determined by the ageing conditions and temperatures. Therefore, the decoupling of capacity and SOC is realized. Finally, the fusion state is calculated by Eq. (13). The summary of the proposed framework for the multi-stage model fusion method is shown in Algorithm 1. The main parameters of this method are listed in Table 3.
4. Results and discussions
4.1. SOC validation
The true capacity can be obtained by the static capacity tests and the true SOC can be determined by Ampere–hour integral method with the known initial SOC. The SOC estimation is validated under different cycles with the initial SOC setting to 0.5 although the true SOC is 1. From Figs. 8 and 9, it can be seen that the fusion approach provides the most accurate SOC than any one of the three models. For example, the SOC maximal error(MAXE)of the fusion method is within 3%at 25 °C over the whole range of 600 cycles, which is superior to those of an individual Models 1, 2, or 3. Model 1 has satisfying accuracy at Cycle 0. With the increase of cycles, the MAXE of Model 1 increases to 4.8%.Model 2 has a high precision from Cycles 100 to 480, but at Cycle 600 the MAEX of Model 2 increases to 3.6%.Model 3 only has good performance at Cycle 600. Similar phenomena also appear in the verification results at 10°C as shown in Table 4.Although the estimation accuracy of the fusion model is lower than that of a single model at some ageing level,overall the fusion method provides the improved estimation accuracy for a long-term operation, which is the main advantage of the fusion method. Additionally, as the observer parameters of three models are consistent, the convergence time of the fusion method is similar to those of three single model based methods. The window length Lmaffects not only the complexity of the algorithm but also the estimation accuracy.The optimized Lmvalue should be a compromise between these two factors. The results for the influence of different Lmvalues on the average calculation time and SOC estimation accuracy are listed in Table 5. The algorithm computing platform is a laptop,whose configuration is the Intel Core i7-8550U central processing unit(CPU)1.8 GHz and 8 GB random access memory(RAM).When the length Lmis greater than 600,the SOC accuracy is not improved greatly, but the computing time increases significantly. Therefore,the optimized Lmis taken as 500 in this paper.
4.2. Joint validation of SOC and capacity
4.2.1. Validation at SOH = 0.94
The initial value of SOC is 0.5 and the initial capacity is set to 20 A·h, and they deviate from their true values of 1.0 and 24.09 A·h,respectively. The SOC and capacity joint estimation results at 10 °C are shown in Fig. 10. The MAXE of the estimated SOC for the fusion method is 1.76%. Model 1 has similar accuracy to the fusion method in the first 100 min. As the inaccurate capacity is set initially, the estimated SOC errors for Model 1 can increase up to 3.6%.Model 2 has better accuracy than the other two models,which shows that the collected voltages at the present condition are closer to the output voltages of Model 2. However, it has a longer convergence time of up to 35 min than the other two models.Model 3 has the worst accuracy,indicating that Model 3 is not able to accurately simulate the terminal voltage at the present condition. Fig. 10(c) shows that the presented method can calculate the capacity accurately, where the mean absolute error (MAE) of the estimated capacity is 1.48% and the RMSE of the estimated capacity is 1.78%.
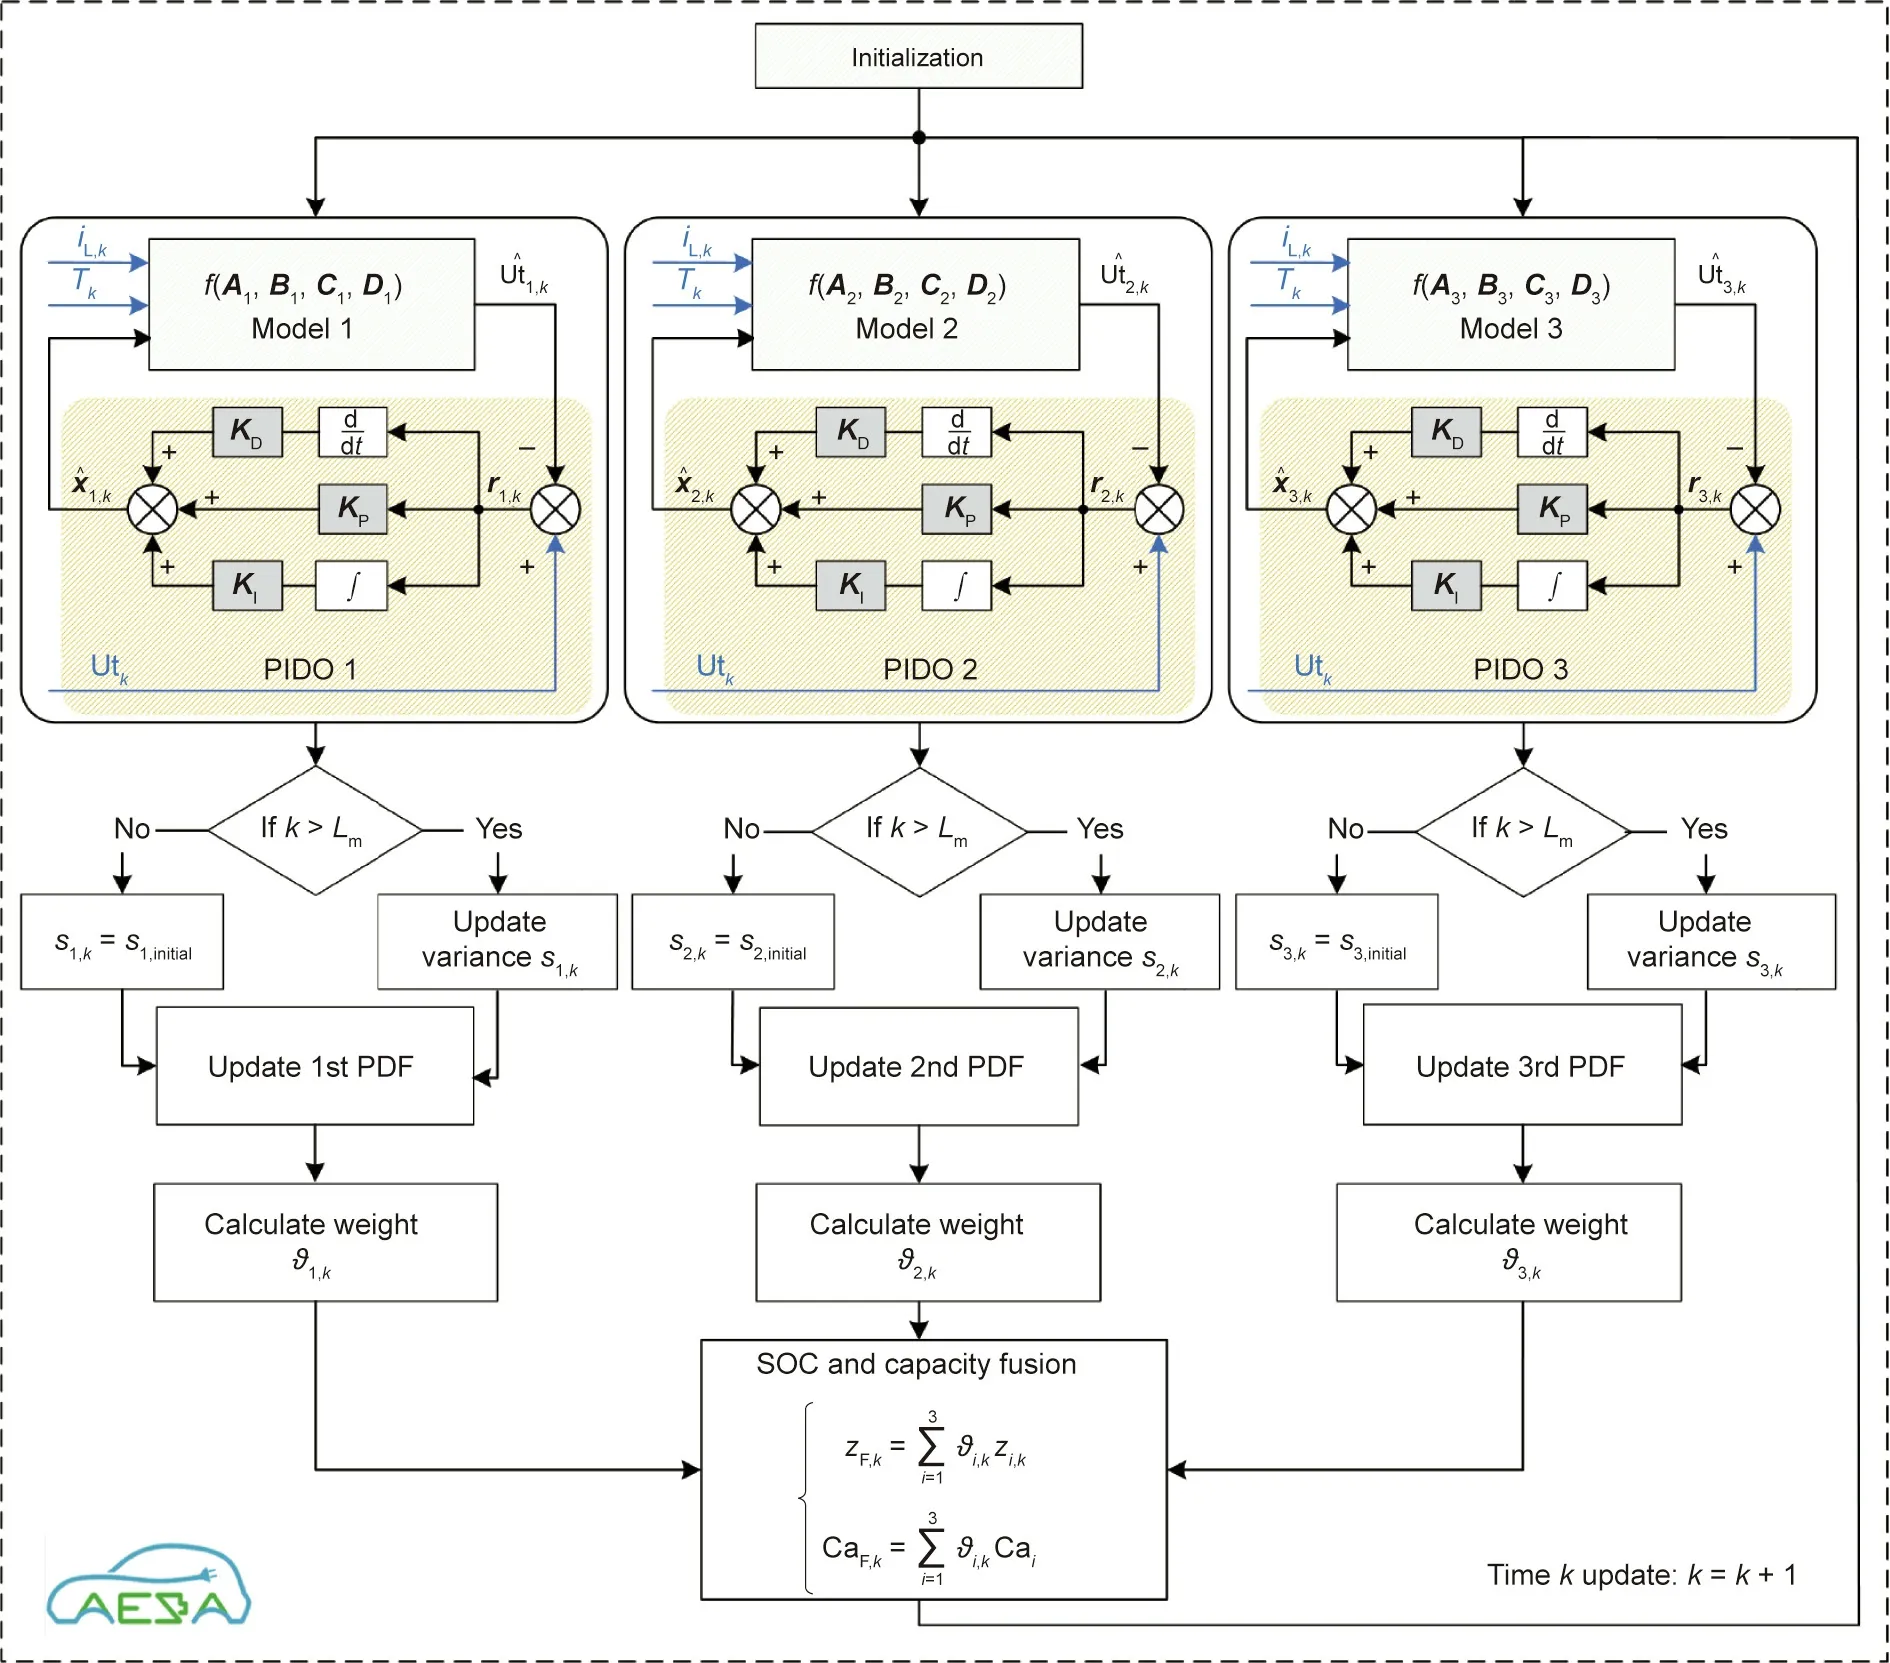
Fig.7. The multi-stage model fusion estimation framework.Tk:the surface temperature of battery at time k;zF,k:the fused SOC at time k;CaF,k:the fused capacity at time k;si,initial: the initial variance of the ith model.
Algorithm 1. Proposed framework for the multi-stage model fusion method.Initialization:^x1,0,^x2,0,^x3,0,KP,KI,KD,ω1,0,ω2,0,ω3,0,s1,initial,s2,initial,s3,initial,Lm Computation:for k=1,2,...· Feedback correction based on PIDO: for i = 1, 2, 3 State correction:^xi,k+1 =Ai^xk+BiiL,k +KPei,k + KIωi,k +KD ei,k-ei,k-1 Δt Measurement update: ^Uti,k =Ci^xi,k +DiiL,k Feedback error: ei,k =Utk- ^Uti,k,ri,k =ei,k Error integral:ωi,k+1 =ωi,k +ei,kΔt· Weight update: for i = 1, 2, 3 If k >Lm Calculate the variance of the RETV si,k =1()2 p-1∑k j=k-Lm+1 ri,j -¯ri,k Else Variance not updated: si,k = si,initial End Calculate the PDF:fY(k)|θi ,Y(k-1)(Y(k)θi,Y(k-1)) =i,ksi,k¯ri,k)Weight update:ϑi,k =|1(2π)12 |si,k |12 exp(-12¯rT"#1 p-1 1 -|)si,k∑p fY(k) |θi ,Y(k-1)(Y(k)θi,Y(k-1)|)si,kj=1fY(k) |θj ,Y(k-1)(Y(k) θj,Y(k-1)Results fusion:SOC estimation: zF,k =∑pi=1ϑi,kzi,k Capacity estimation: CaF,k =∑pi=1ϑi,kCai

Table 3 Parameters of the proposed algorithm.
Fig. 11 shows the estimated SOC and capacity results at 25°C,which indicates that the proposed approach has the same convergence time as the capacity estimation results at 10°C.Furthermore, the SOC estimation of the fusion method has the MAXE of only 2.1% and the RMSE of 1.12% while the capacity estimation from the fusion method has the MAXE of 2.11% and the RMSE of 2.2%.
4.2.2. Validation at SOH = 0.89

Fig. 8. SOC estimation results under Cycle 550 at 25 °C: (a) SOC estimation results and (b) estimation error.

Fig. 9. SOC estimation under different ageing levels at 25 °C: (a) MAXE and (b) RMSE. MAXE: maximal error.

Table 4 SOC estimation error under different ageing levels at 10 °C.

Table 5 The influence of different Lm values on average calculation time and SOC RMSE.
The SOC and capacity estimation results and their errors at 10 °C are shown in Fig. 12. The presented method closely follows the true SOC with the smallest error among all the models. It has an MAE of 0.31%, the RMSE of 0.39%, and the MAXE of 1.21%.Furthermore, the fusion method for capacity estimation has the errors all within 3%. It has the MAE of 1.45%, the RMSE of 1.59%,and the MAXE of 2.37%.In contrast,Models 1, 2, and 3 have larger SOC estimation errors than the fusion method. The main reason is that these models cannot simulate the present terminal voltage of batteries comparing with the fusion model.
Fig.13 shows the SOC and capacity estimation results and their estimation errors at 25 °C. The proposed method for SOC estimation has the MAE, the RMSE, and the MAXE of 0.55%, 0.74%, and 1.55%, respectively. Furthermore, the proposed method for capacity estimation has errors all within 3.3%. It has the MAE of 1.19%,the RMSE of 1.41%, and the MAXE of 3.25%.
4.3. Robustness evaluation
4.3.1. Convergence analysis
The convergence performance is important to practical applications, especially when the BMS is suddenly cut off without saving calculation results. To simulate these scenarios, the proposed method is tested when the battery is at different initial SOCs,such as 1.0,0.9,0.8,0.7,0.6,and 0.4,while its true initial SOC is 0.5.The proportional gain KPand integral gain KIare the same for both PIO and PIDO,listed in Table 3.The validation results are demonstrated in Fig.14.It can be seen that the PIDO can quickly and steadily converge to the true value within 5 min while the PIO only converge after 30 min. Although the convergence speed of the PIDO is reduced in the middle and low SOC range,it is still better than that of the PIO.Therefore,the PIDO converges much faster than the PIO,indicating that the convergence speed can be improved by adding the derivative of the error into the feedback gain.
4.3.2. Noise immunity test
In the hardware application, the measurement accuracy of differential voltage will determine the measurement error of voltage and current for BMSs.It mainly depends on the white noise caused by analog to digital converter. According to the measuring principle of a Hall current sensor, the measurement deviation of the signal is caused by the zero drift of the components, which is a bias noise with a non-zero mean [33].

Fig. 10. SOC and capacity estimation results at 10 °C and SOH = 0.94: (a) SOC results, (b) SOC error of different models, and (c) capacity results and errors.
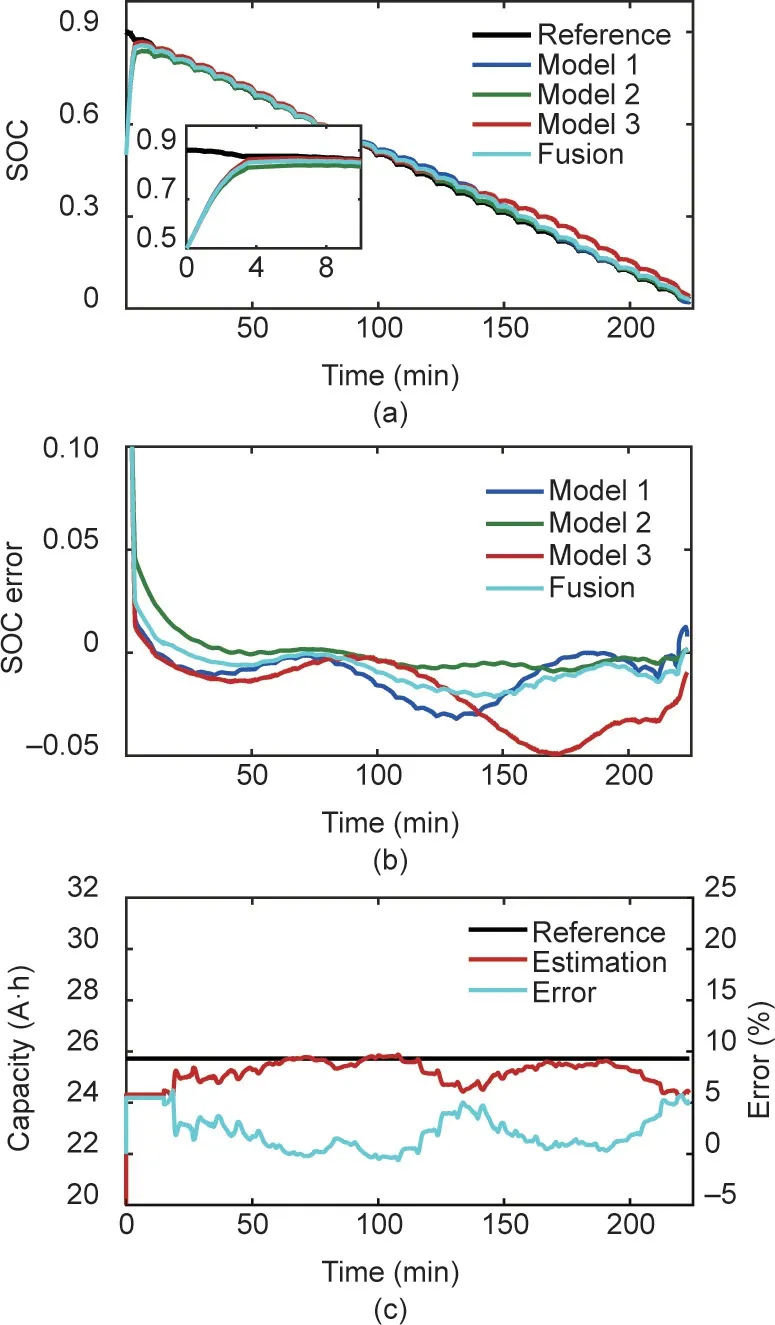
Fig. 11. SOC and capacity estimation results at 25 °C and SOH = 0.94: (a) SOC results, (b) SOC error of different models, and (c) capacity results and errors.
To investigate the influence of voltage sensor noise on the accuracy of the fusion approach, the white noises with the variance from 0.001 to 1 are added to the voltage signal[34].The estimation errors of SOC and capacity are shown in Fig. 15(a). It can be seen that after adding the white noise with the variance of 0.1 to the voltage signal the MAE and RMSE for SOC estimation increase by 60%and 51%,respectively,whereas the MAE and RMSE for capacity estimation increase by 125% and 93%, respectively. Therefore, the voltage white noise has less influence on SOC estimation errors than capacity estimation errors. The main reason is that the measured terminal voltage after adding white noise is quite different from the real terminal voltage, which cannot be represented well by Models 1–3.Consequently,the weight values are more distorted for the fusion model, resulting in large capacity estimation errors.
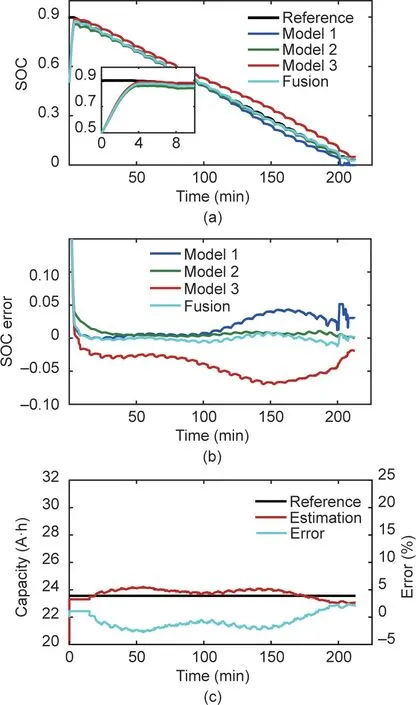
Fig. 12. SOC and capacity estimation results at 10 °C and SOH = 0.89: (a) SOC results, (b) SOC error of different models, and (c) capacity results and errors.
To investigate the influence of the current sensor noise on the accuracy, the bias noise with the mean value of 0.5, 0.2, 0.1, 0.05,or 0.005 A is injected into the current signal, respectively, and the variance of the noise is 0.01 A2. The estimation errors for SOC and capacity are shown in Fig.15(b).The results show that the bias noise has little influence on the performance of the fusion method.The main reason is that this method uses terminal voltage as the only tracking target, and the current signal is used for the singlestep prior estimation of SOC. Therefore, the proposed method is more dependent on voltage measurement accuracy but more robust against current interference.
4.4. HIL validation
4.4.1. HIL testing bench
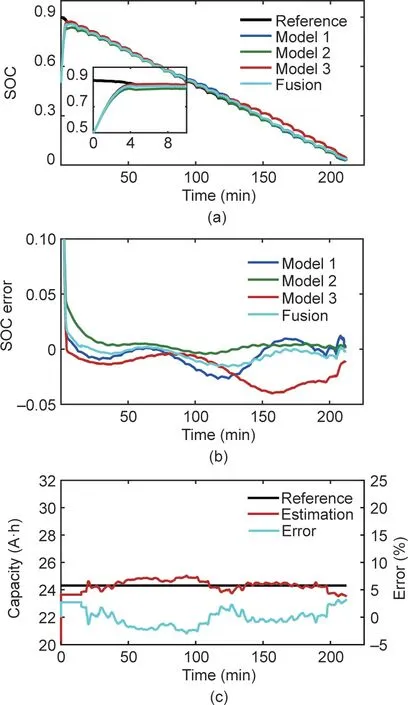
Fig. 13. SOC and capacity estimation results at 25 °C and SOH = 0.89: (a) SOC results, (b) SOC error of different models, and (c) capacity results and errors.
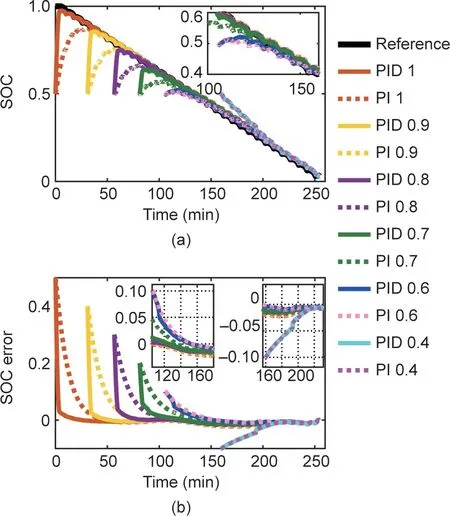
Fig.14. Performance of convergence:(a)SOC estimation results and(b)estimation errors. PI: proportional–integral; PID: proportional–integral–differential.
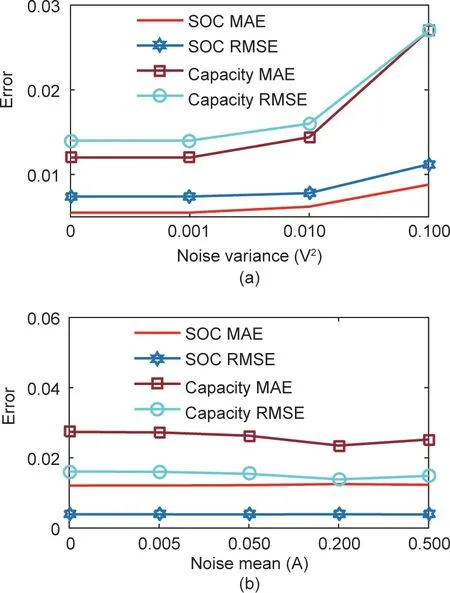
Fig.15. Performance with noise:(a)voltage white noise and(b)current bias noise.
To fully test the application of the proposed fusion algorithm,an HIL testing bench is established to conduct the validation test based on a developed BMS. The battery management hardware platform includes an BT2000, a temperature chamber, an upper computer,a power supply,a battery cell,a controller area network(CAN) board, and a BMS [35], as shown in Fig. 16. The BMS is comprised of a battery monitor unit (BMU) and a battery control unit (BCU). The BMU is used to collect the cell voltages and temperatures.The BCU is used to control the safety and uniformity of LIBs.The core algorithm such as SOC and SOH is executed in the BCU. The main specification of the BMS hardware is listed in Table 6. The voltage of the cell is measured by the LT6804 chip in the BMU, which has a high accuracy with the resolution of 3 mV. The CAB-300C (LEM, Switzerland), a professional current sensor, is used, whose maximum measurement noise is within 0.5 A [23]. The other cells after several cycles are used for the algorithm validation. The testing temperature is 40 °C, where the real capacity of the cell is 26 A·h.
4.4.2. Application in BMS
Before validation in the HIL, the calculation time of the proposed method is discussed and listed in Table 7 [36,37]. Resultsindicate that the complexity of the fusion method is superior to the joint unscented Kalman filter.The proposed method is implemented in Matlab/Simulink shown in Fig. 17, where the label "voltage,"infer that the voltage and current data from real-time BMS. The standard embedded C code is automatically generated by the Simulink code toolbox. In the integrated development software,the input, output, and execution cycle of the algorithm are set.

Table 6 The technical parameters of BMS.
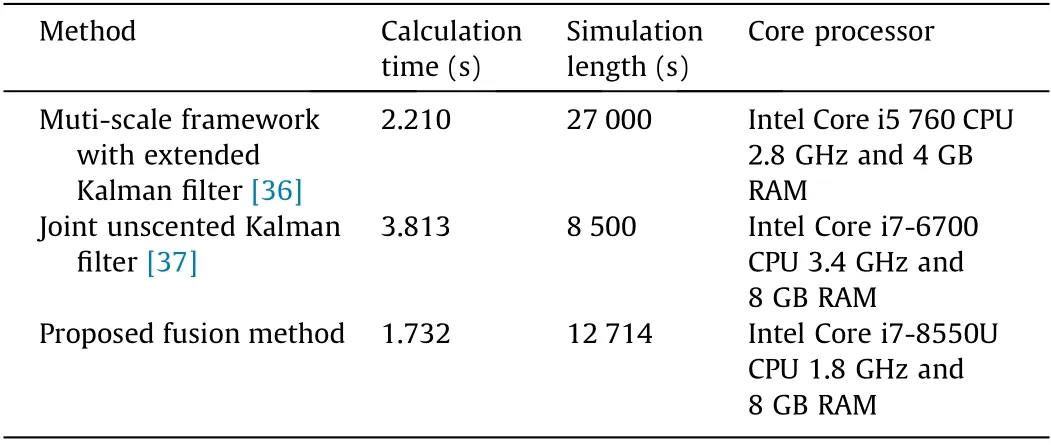
Table 7 The calculation time of different method [36,37].
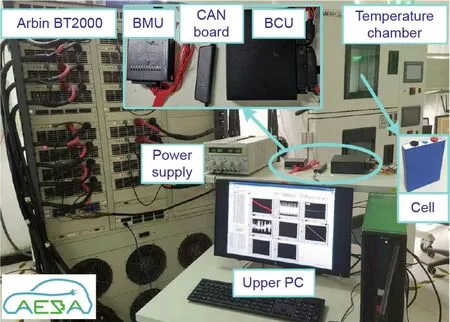
Fig. 16. Platform of HIL validation. PC: personal computer.
The input is the cell voltage,current,and temperature.Voltages and temperatures are collected by the BMU at the sampling period of 100 ms. The current value is measured at 100 Hz by the CAB-300C.The output is the estimated SOC and capacity.The execution cycle is 1 s.Additionally,to calculate the weight of each model,the historical RETV should be saved in real-time.If the window length Lmis set to 500, the micro-controller unit (MCU) needs to store 1500 floating-point data, the current mainstream 32-bit MCU can meet this requirement.
4.4.3. Results analysis
The SOC range of the tested cell is 0.5–1.0.There are two validation tests,one for the accuracy named as HIL1and the other for the convergence named as HIL2. The initial SOC is set to 0.5. The validation results are shown in Fig. 18. In HIL1test, the MAXE of the estimated SOC is 0.88% and that of the capacity is 3.1%. In HIL2test,it simulates the process of a BMS to turn on and off.When the BMS is initially turned off and then on at the 76th minute, the algorithm starts to estimate SOC and capacity, and it converges within a specified error of 3% at the 86th minute.
Therefore, the accuracy validation test shows that the fusion algorithm can accurately estimate SOC and capacity. The convergence test shows that when the BMS is initially powered off and then on suddenly the SOC and capacity estimation results can quickly and steadily converge to the true values.The main features of the proposed fusion algorithm are as follows:
(1)The parameters of the fusion model at different ageing levels are a function of SOC and temperature, which can ensure the stability of the model parameters. The weight updating method makes the identified parameters have good real-time performance.
(2) The RETV of the model is used to determine the real-time fusion weight.
(3) The proposed framework realizes an independent estimation of SOC and capacity. As the model input SOC is the frontend fusion result, the input capacity is the maximum available capacity under the ageing stage, which realizes the decoupling of SOC and capacity.
5. Conclusions
In this paper, a novel framework including the multi-stage fusion model and a PIDO is presented to accurately estimate SOC and capacity under a complex application environment. The experimental and HIL results have verified the effectiveness of the proposed algorithm.In addition,we also achieve the following three conclusions:
(1) By using the fusion method to identify parameters, stable values can be obtained in real-time, which overcomes the deficiency of the RLS algorithm sensitive to working conditions. Compared with a single model, the multi-stage model achieves more accurate battery voltages at different temperatures and ageing levels. The RMSE of predicted voltage is within 40 mV at 10 °C.

Fig. 17. Simulink model of the fusion method.
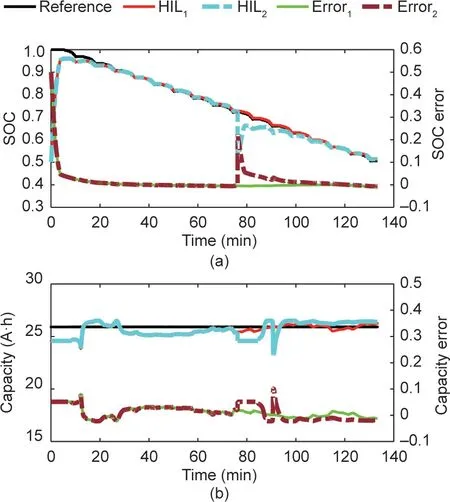
Fig. 18. Results of the HIL test: (a) SOC estimation and (b) capacity estimation.
(2) The proposed framework based on the fusion model and PIDO can accurately estimate SOC and capacity for aged batteries over a wide range of temperature range.The MAXE of SOC estimation is within 3%at 25°C under the long-term cycles.The HIL tests show that the proposed method can be effectively used in the realtime SOC and capacity estimation with high accuracy. The maximum SOC estimation error is 0.88% and the maximum capacity estimation error is 3.1%.
(3) Compared with PIO, the proposed PIDO algorithm can improve the convergence speed by up to six times while suppressing current noise.
Acknowledgments
This work was supported by the National Key Research and Development Program of China (2017YFB0103802) and the National Natural Science Foundation of China (51922006 and 51707011). The systematic experiments of the LIBs were performed at the Advanced Energy Storage and Application (AESA)Group, Beijing Institute of Technology.
Compliance with ethics guidelines
Rui Xiong, Ju Wang, Weixiang Shen, Jinpeng Tian, and Hao Mu declare that they have no conflict of interest or financial conflicts to disclose.
- Engineering的其它文章
- Engineered Hybrid Materials with Smart Surfaces for Effective Mitigation of Petroleum-Originated Pollutants
- Diffractive Deep Neural Networks at Visible Wavelengths
- A Predictive Instrument for Sensitive and Expedited Measurement of Ultra-Barrier Permeation
- Clinical Characteristics and Outcomes of Severe or Critical COVID-19 Patients Presenting No Respiratory Symptoms or Fever at Onset
- Mass Spectrometry Analysis of Newly Emerging Coronavirus HCoV-19 Spike Protein and Human ACE2 Reveals Camouflaging Glycans and Unique Post-Translational Modifications
- A Smart Procedure for the Femtosecond Laser-Based Fabrication of a Polymeric Lab-on-a-Chip for Capturing Tumor Cell

