Are domestic electricity prices higher in countries with higher installed capacity of wind and solar? (2019 data)
Gautam Kalghatgi
(Department of Engineering Science, University of Oxford, London OX1 3PJ, U.K.)
Abstract: Domestic electricity price (P) from twenty different countries in Europe, Asia and America is compared with various combinations of the total electricity generation, the installed capacity and the actual energy delivered by wind and solar (variable renewable energy, VRE) in 2019. There is a positive correlation between P and per capita installed capacity of VRE but it is weaker than reported in the past just for Europe.The strongest correlation, with an R2 of 0.71, of P is with the ratio of the maximum possible energy from wind and solar working continuously at rated capacity to the actual total electricity generation. The various correlations suggest that, though there would also be other policy options, the impact of VRE on P can be moderated by reducing the fraction of electricity supplied by VRE through the use of other CO2-free energy sources and/or more efficient VRE via higher capacity factors.
Key words: wind energy; solar energy; electricity; domestic electricity prices; variable renewable energy (VRE);capacity factor
1 Introduction
It has been noted in many publications that household electricity prices are higher in countries with a larger share of wind and solar in electricity generation and the primary reason appears to be the intermittent nature of wind and solar, variable renewable energies (VRE)[1-4]. VRE do not necessarily produce enough electricity when societies need it and too much electricity when they do not. This problem becomes more acute as the share of VREs in electricity generation increases.Hence countries like Germany, with large installed capacity of VRE, need to buy electricity at high cost from neighboring countries when there is a shortage but pay them to take excess electricity when there is too much of it. The modeling by Hirth[2]showed that the “economic value” of solar and wind would drop by 50% and by 40% in Europe when they got to 15%and 30% respectively of total electricity generation. VRE are also geographically dispersed and are often located far away from population centers where electricity is needed. Hence transmission costs will be higher – this would be particularly the case for offshore wind. Finally, regulations such as the Renewable Portfolio Standards (RPS) in the U.S. which require a certain percentage of electricity to be produced by renewable sources by a certain date can make some of the existing power generation redundant; the costs of these “stranded assets”are passed on to the consumer[1]. To tackle the intermittency problem, VREs require some form of reliable back-up power source such as natural gas plants and hydroelectricity which can step in quickly when needed. Eventually, the intermittency problem of VREs will need to be addressed with adequate storage capacity but all this will add significantly to the capital and effective operating costs of VREs.
It would be of interest to see if the correlation between the domestic electricity price (P) and installed VRE capacity still holds because a significant reduction in the cost of VREs in recent years has been claimed. In this note the most recent available data, including from non-European countries are analyzed. Average residential electricity price,P, in UK pence/ kWh, including taxes, for different countries for 2019 from Table 5.5.1 from Ref. [5]is listed in Table 1 – average exchange rate over the year was used to convert the prices to a common currency as explained in Ref. [5].
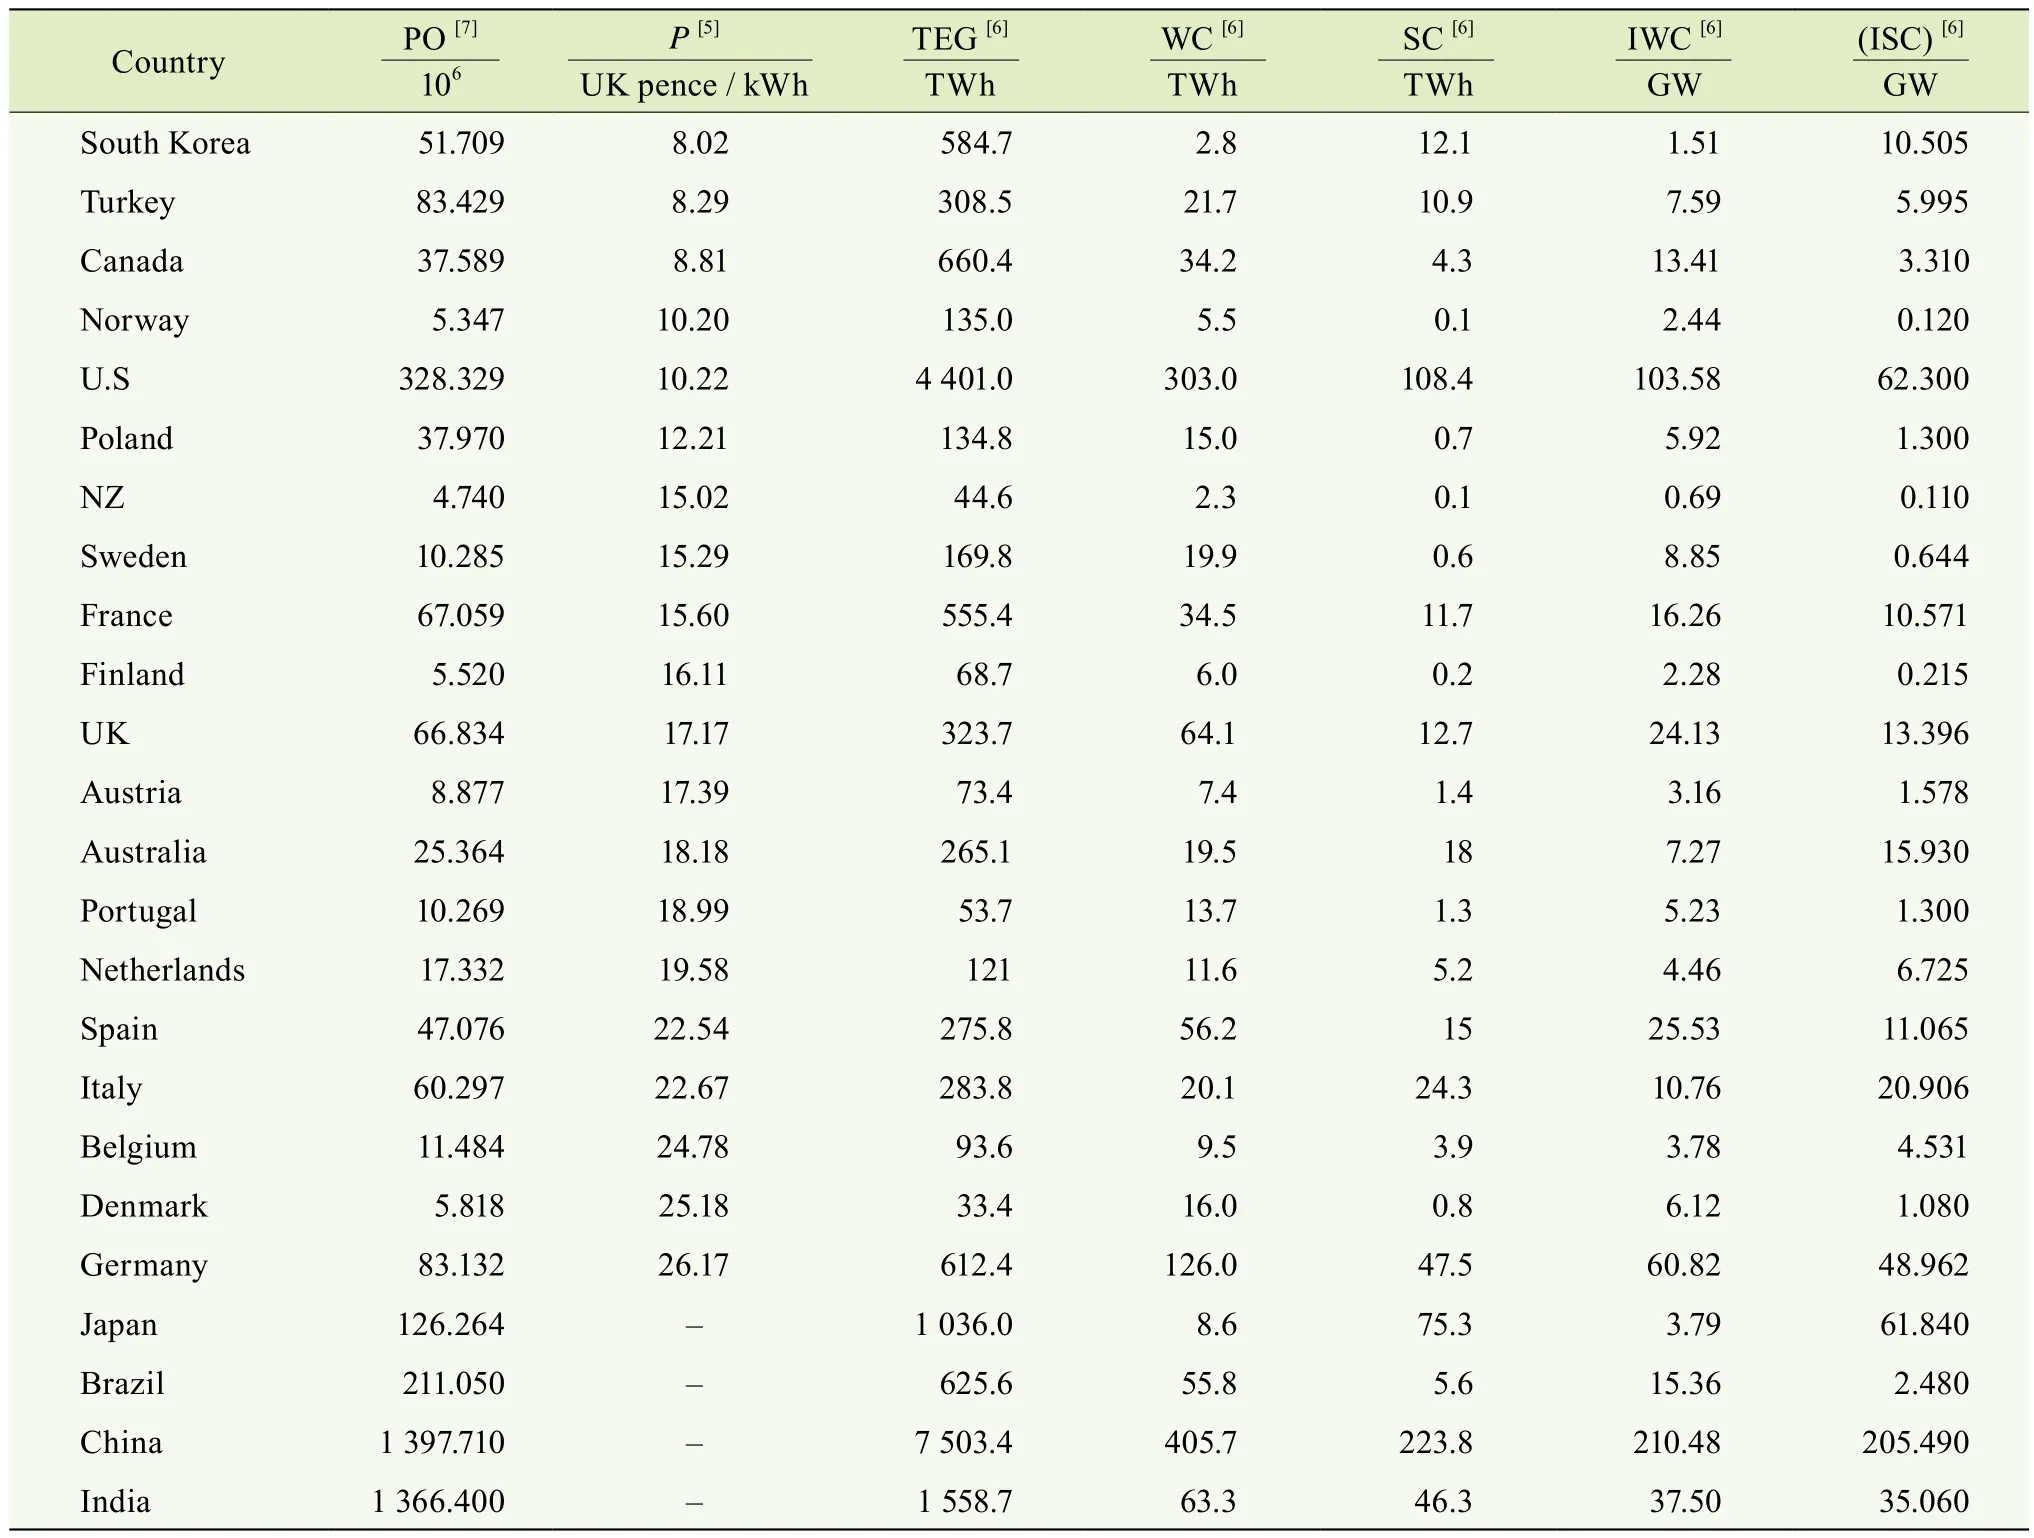
Table 1 For 2019, population (PO), domestic electricity price (P), total electricity generation (TEG), actual wind (WC)and solar (SC)contribution to electricity generation, installed capacity of wind (IWC) and solar (ISC) for different countries
Notes:
a) Total installed wind and solar capacity in GW, the total electricity generation and the actual electrical energy contribution of wind and solar in TWh in 2019 from the BP Statistical Review of World Energy 2020[6].
b) Population in 2019, taken from the World Bank[7].
c) In Ref. [5]Pwas not available for several countries for which other data from Ref. [6]were available – e.g. for Japan in 2019 and China, Brazil and India – they are included for the insight they provide about the efficiency of VRE contribution to electricity generation. Similarly, some data in Ref. [6]was not available for some countries for which P was available in Ref. [5]– e.g. data for wind for Hungary. Table 1 lists 24 countries but only 20 are included in the price correlations.
Taxes are included because consumers pay these and they might actually reflect the additional costs of VRE that the governments might want to recoup. The following data for these countries are also listed in Table 1.
2 Domestic Electricity Price Correlations
Figure 1 showsP, domestic electricity price, plotted against,X, the installed VRE capacity per capita in 2019. There is still a correlation betweenPandXand the correlation coefficient does not change much if only European countries are considered as in Ref. [3]. The scatter in Fig.1 might be partly due to exchange rate variations between the different currencies and the UK pound. Of course,Pdoes not depend only onXbecause many other factors such as pricing policy,taxes and subsidies, complexities and opportunities for dynamical trading of wholesale electricity and better matching of supply and demand also come into play[1,4]. For instance,it is notable thatPis particularly high in Belgium. This has been attributed to a chronic failure of supply to meet demand because of bad policy decisions[8].
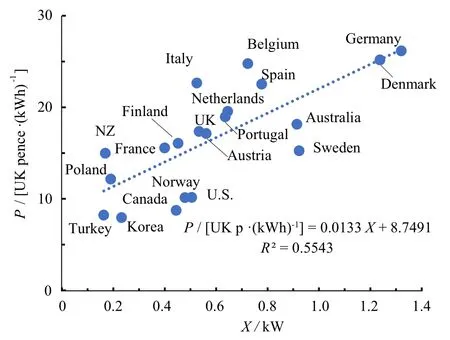
Fig 1 Average domestic electricity price (P) plotted against installed per capita (wind + solar) capacity X in 2019.
Figure 2 showsPplotted against the actual share of electricity generation from wind and solar (Y), from columns 4,5,6 in Table 1 and theR2value does not improve compared to Fig.1.Figure 3 showsPplotted againstZ, the ratio of the theoretical energy generated by wind and solar working continuously at rated power, to the actual total electricity generation using columns 4, 7 and 8 in Table 1. This correlation has the highestR2value of the various linear correlations tried. In Fig.3, a linear correlation betweenPandZhas aR2value of 0.707 and is described by

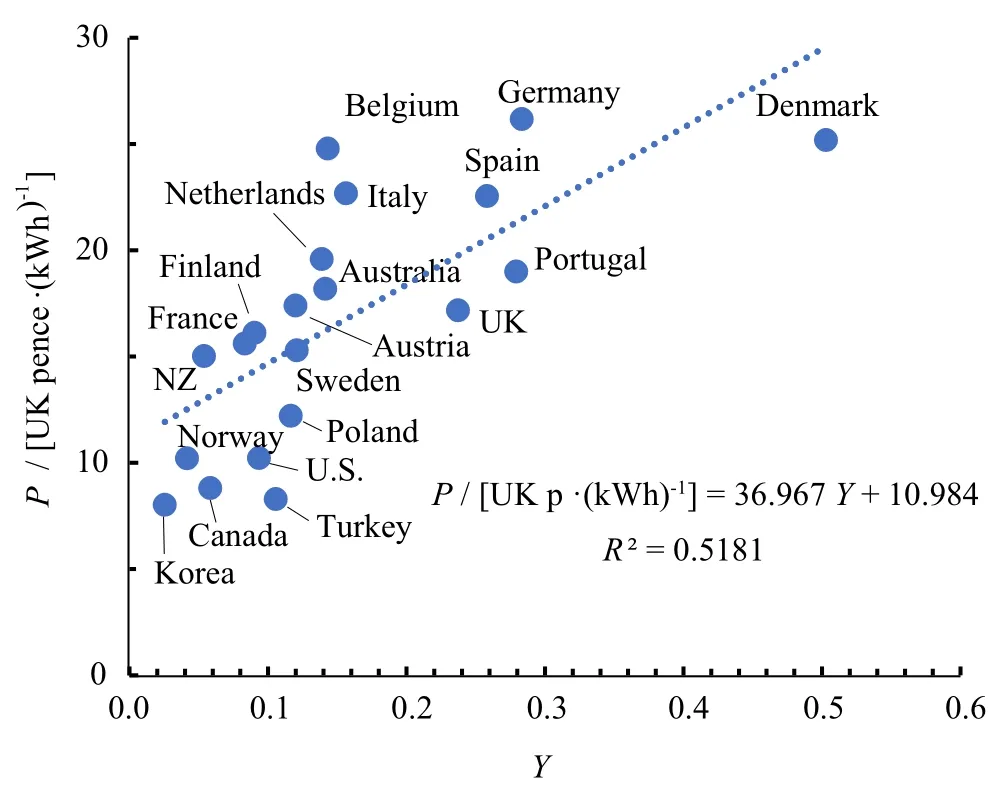
Fig 2 Average domestic price of electricity (P) plotted against the actual share of wind and solar of total electricity generation,Y, in 2019
3 Capacity Factor (CF)
It can be seen from Figure 3 that the U.K., for instance, has enough wind and solar capacity to supply all its electricity(Z~1) if they worked without interruption at rated power but in fact only supply about 24% (Y~0.24) of the total electricity(See Fig.2). This highlights the need to consider the capacity factor (CF) for intermittent sources of power. CF is the ratio of the actual electricity delivered by the VRE to the electricity that would be generated if the VRE operated continuously at rated power. CF can be calculated from columns 5, 6, 7 and 8 in Table 1 and is shown for different countries in Fig.4 in 2019.Averaged across the countries shown, CF for wind, solar and(wind + solar) is respectively, 0.275, 0.128 and 0.225. Thus, on average, wind provides only 27.5 % of the electricity expected from its installed capacity because the wind does not blow all the time.
4 Concluding Discussion
Of course, correlation does not imply causation andPdepends on many other factors as well. In that context it is surprising that theR2value is as high as it is in Fig.3 and it indicates some trends. With continued decarbonization of electricity generation, the impact on the consumer electricity price can be moderated by reducingZ(though many other policy options such as subsidies might also be available), by doing any or all of the following. Note thatZ=Y/ CF.
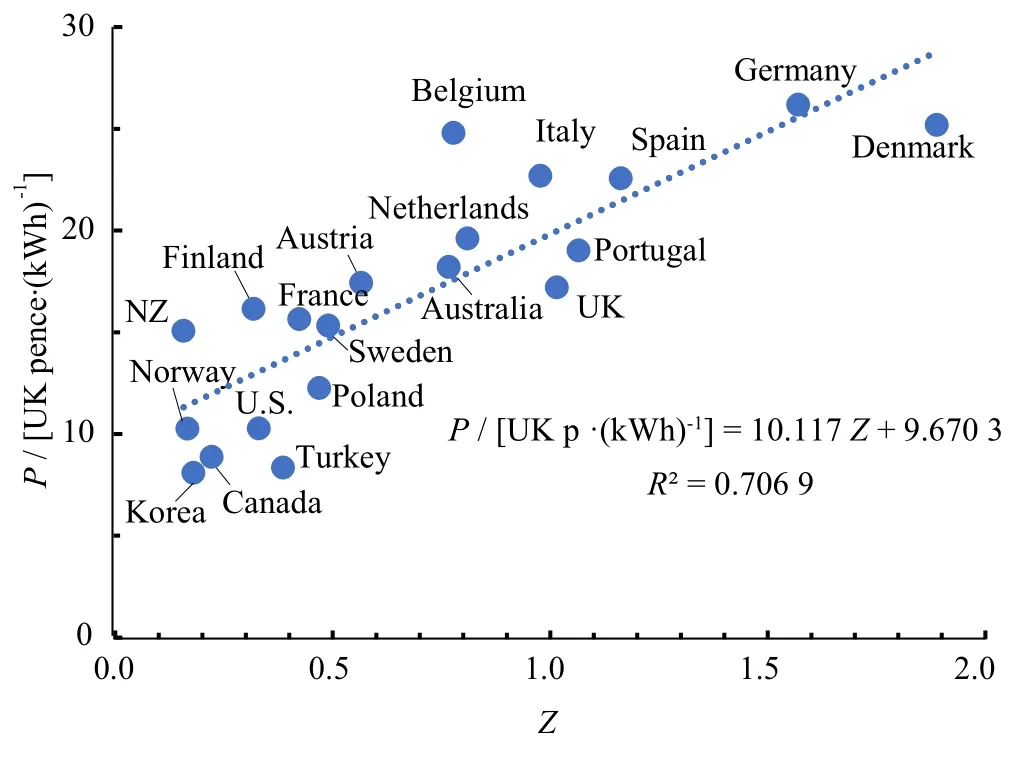
Fig 3 Average domestic price of electricity (P) in 2019, plotted against Z, the ratio of the energy generated by wind and solar if they work continuously at rated power to the actual total electricity generation
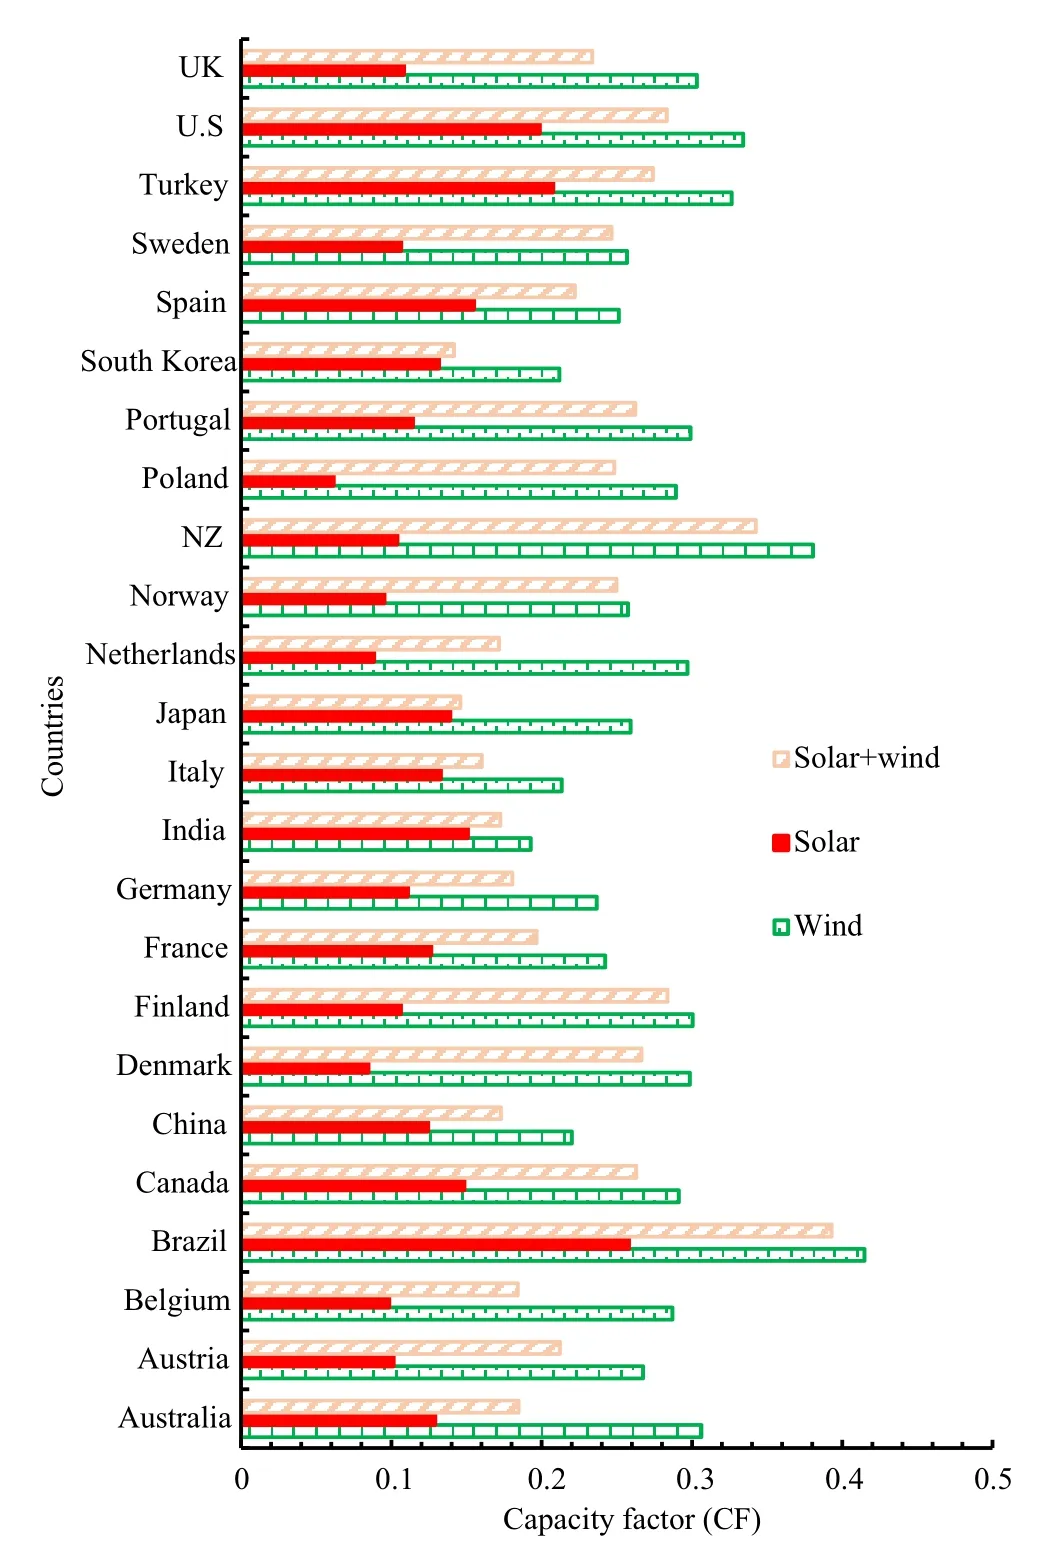
Fig 4 Capacity factors for wind, solar and (wind + solar) in 2019. The average values for wind, solar and (wind + solar) across the countries shown are respectively,0.275, 0.128 and 0.225.
a) ReducingX, by reducing the total electricity requirement through efficiency improvements and consequently reducing the need for VRE.
b) ReducingY, the proportion of future energy to be supplied by VRE by increasing other CO2-free energy sources such as nuclear and hydro power but they might have other cost and environmental implications and constraints.
c) By increasing the capacity factor of VRE. The fact that theR2value in Fig.3 is higher than in Fig 1 and Fig 2 suggests that more efficient VRE use (higher CF), as well as lowering the actual share of VRE in the electricity generation (Y) could lowerP.
All changes to the energy infrastructure need to be assessed honestly and on a life cycle basis to ensure that they actually deliver the benefits they promise and do not have unintended consequences.
Correlations such as in Fig.3 cannot be used to predict actual future domestic electricity prices with great accuracy or confidence. Nevertheless, it is interesting to explore what the trends would be for one country, say the U.K., which has a net zero greenhouse gas (GHG) target to be met in 2050. By that time, it has to move out of fossil fuels as much as possible and offset the rest of the CO2against natural and artificial sinks such as forests and carbon capture and storage. If we assume that because of improved efficiency and some offsetting,the U.K. needs to replace just 60% of the 6.21 EJ of energy supplied by fossil fuels in 2019 (3.73 EJ or 1 036 TWh), it would require 118 GW of additional continuous CO2-free power generation[9]. This is optimistic because the actual energy demand might increase because of initiatives such as bringing on the hydrogen economy and carbon capture and storage and more than 60% of current fossil fuel energy might need to be replaced. If this additional electricity is to be supplied by offshore wind and we assume an improved average CF of 0.45 for wind (the current value is 0.3, see Fig.4), additional wind capacity of 262 GW has to be built by 2050. Including the existing VRE capacity of 37.2 GW and total electricity generation of 323.7 TWh, the U.K. will have around 299 GW of VRE capacity (X= 4.47 kW per capita) and 1 359 (1 036 +323) TWh of total electricity generation in 2050, requiring 155 GW of continuous electricity generation. The actual electricity supplied by VRE would be 1 113 TWh (1 036 + 64.1 + 12.7)so thatYwould be 0.819. TheZvalue would be 1.93 andPwould be 29.2 UK p / kWh from Eq.1 i. around 70% higher than in 2019. If the requirement for additional VRE energy is higher or if the average CF for wind were to be less than 0.45, the value ofZand hence,Pwould be higher. If the linear correlation in Figs 1 and Fig 2 were to hold (the correlation equations are shown in the figures),Pwould be around 4 times and 2.4 times higher than in 2019. The government will probably intervene through subsidies to prevent such large increases inP. The difference in the prediction from the three correlations illustrates the uncertainty of using such correlations of prediction ofPin the future but it does appear thatPwill increase as VRE capacity increases. There would also be substantial environmental, economic (e.g. capital and operating costs) and material requirement challenges posed by such a massive scale-up of primarily off shore wind and the dismantling of the existing energy infrastructure[9].

