Dust Distribution Study at the Blast Furnace Top Based on k-Sε-up Model
Zhipeng Chen, Zhaohui Jiang, Member, IEEE, Chunjie Yang, Senior Member, IEEE, Weihua Gui, Member, IEEE,and Youxian Sun, Member, IEEE
Abstract—The dust distribution law acting at the top of a blast furnace (BF) is of great significance for understanding gas flow distribution and mitigating the negative influence of dust particles on the accuracy and service life of detection equipment. The harsh environment inside a BF makes it difficult to describe the dust distribution. This paper addresses this problem by proposing a dust distribution k-Sε-up model based on interphase (gaspowder) coupling. The proposed model is coupled with a k-Sε model (which describes gas flow movement) and a up model(which depicts dust movement). First, the kinetic energy equation and turbulent dissipation rate equation in the k-Sε model are established based on the modeling theory and single-Greenfunction two-scale direct interaction approximation (SGF-TSDIA)theory. Second, a dust particle movement up model is built based on a force analysis of the dust and Newton’s laws of motion.Finally, a coupling factor that describes the interphase interaction is proposed, and the k-Sε-up model, with clear physical meaning,rigorous mathematical logic, and adequate generality, is developed. Simulation results and on-site verification show that the k-Sε-up model not only has high precision, but also reveals the aggregate distribution features of the dust, which are helpful in optimizing the installation position of the detection equipment and improving its accuracy and service life.
I. INTRODUCTION
BLAST furnaces (BFs) are the main energy consumers in the iron-making process. Energy consumption and emissions reduction [1], [2] entails precision control of BFs,which begins with measuring gas flow distribution and key operation parameters using detection equipment. Most detection devices are installed at the top of the BF, which also
Manuscript received May 30, 2020; accepted July 22, 2020. This work was supported by the Foundation for Innovative Research Groups of the National Natural Science Foundation of China (61621062), the National Major Scientific Research Equipment of China (61927803), the National Natural Science Foundation of China (61933015), and the National Natural Science Foundation for Young Scholars of China (61903325). Recommended by Associate Editor Hui Yu. (Corresponding author: Zhaohui Jiang.)
Citation: Z. P. Chen, Z. H. Jiang, C. J. Yang, W. H. Gui, and Y. X. Sun,“Dust distribution study at the blast furnace top based on k-Sε-upmodel,”IEEE/CAA J. Autom. Sinica, vol. 8, no. 1, pp. 121-135, Jan. 2021.
Z. P. Chen, Z. H. Jiang, and W. H. Gui are with the School of Automation,Central South University, Changsha 410083, China (e-mail: chenzhipeng 0803@163.com; jzh0903@csu.edu.cn; gwh@csu.edu.cn).
C. J. Yang and Y. X. Sun are with the School of Control Science and Engineering, Zhejiang University, Hangzhou 310027, China (e-mail: cjyang 999@zju.edu.cn; sunyx@zju.edu.cn).
Color versions of one or more of the figures in this paper are available online at http://ieeexplore.ieee.org.
Digital Object Identifier 10.1109/JAS.2020.1003468 houses a direct observation window for the gas flow.However, a high-concentration dust layer formed by suspended and high-speed dust particles is fully filled at the BF top, greatly limiting the accuracy and reliability of the detection equipment and influencing gas flow distribution.Determining the law governing the movement and distribution of the dust is helpful for gaining a quantitative understanding of the gas distribution at the BF top, preventing dust damage to detection equipment on the burden surface, prolonging its service life, and improving its detection accuracy. However,the BF is an enclosed industrial reactor involving complicated multiphase flow and heat transfer with chemical reactions [3], [4].The movement and distribution of the dust particles are complicated, and it is a challenge to establish the dust distribution models. These difficulties have resulted in few direct studies on dust motion at the top of BFs. Most relevant research has focused on the turbulence of the gas flow, the gas-solid two-phase flow, and their interaction. For studying gas flow turbulence, the main problem lies in finding the statistical solution of the Navier-Stokes (N-S) equations.However, the strong nonlinearity of the N-S equations means that the n th order moments of the turbulence pulsation are coupled with its (n +1)th order moments. Therefore, it is impossible to obtain a strictly closed-form equivalence to the N-S equations from a few low-order moments. The N-S equations must be artificially closed based on some reasonable assumptions, and there are two main techniques for achieving this. The first is to use the modeling theory based on engineering experience, and rely on keen physical intuition and analogy rather than on strict mathematical proof, to close the equations. Examples of this strategy include thek-ε turbulence model [5], [6], the realizable k-ε model [7], [8] and the renormalization group model [9], [10], and the Reynolds stress model [11], [12]. The second technique involves turbulence analysis theory, which is based on isotropic turbulence. That is, the statistical theory and rigorous mathematical derivation are employed to close the equivalent equations. A representative study of this technique is in [13].Based on a direct interaction approximation (DIA) method[14], the paper introduced a two-scale direct interaction approximation (TSDIA) method according to the difference in characteristic lengths between the average velocity and the fluctuating velocity. Using the TSDIA method, the turbulent energy dissipation rate equation ε was simulated and closed in[15]. Based on this, Kraichnan used the single-Greenfunction-TSDIA to derive a simulation formula for the diffusion term of the Reynolds stress and scalar flux [16], thus improving the results given in [13]. For studying gas-solid two-phase flow, there are two main methods. The first is the Euler-Euler method (two-fluid model), which is used for dense two-phase flow [17], [18]. Gidaspow studied the turbulence problem of fluidized beds. In their research, the pulsation of the gas phase was considered as a large-scale turbulence, and the pulsation of the particle phase was considered a small-scale turbulence. The relationship between the internal force and the random motion of the particles was established according to the discrete-medium dynamic theory[19]. The second is the Euler-Lagrange method (fluid-particle trajectory model), which is suitable for diluting two-phase flow [20]. One representative approach is the particle following theory developed by Schubauer et al. [21]. Under the premise of ignoring the internal forces of the particle phase, the motion of the particles was determined by the gas phase, and the pulsation of the particle phase was always smaller than that of the gas phase turbulence. The particle trajectory model was thus established by analyzing the forces acting on the particles. However, Zhou’s study showed that the turbulence pulsation of particles had its own laws and was not completely controlled by gas-phase turbulence [22]. In many cases, the pulsation strength of the particle phase was larger than that of the gas phase. The main challenge in studying the interaction of two-phase flow is describing the momentum exchange between the two phases and the exchange of turbulent energy. In [23], based on the Euler method, a K-ε-KPmodel was proposed to describe the interaction between the two phases. In [24], based on the Lagrange method, a particle source in cell (PSI-Cell) method was proposed for the momentum transmission between the two phases, but the influence of the particles on the gas turbulence was neglected.
Overall, studies on turbulent flow reveal that when using the modeling theory to simulate and close the N-S equations, the simulation process exhibits a clear physical meaning and that the model structure is simple. However, considering the characteristics and complexity of the gas flow in BFs, the accuracy and reliability of a dust distribution model based completely on the modeling theory must be questioned. If TSDIA is used to simulate and close the model, the characteristics of the gas flow would be better reflected and the mathematical logic would be strict. However, the model becomes complex and has numerous parameters to be determined, which makes it difficult to solve. In studying gassolid two-phase flows, most studies rely on the turbulent movement of the gas phase to analyze the forces acting on the particles of the gas phase, and then establish the Newtonian equation of the particle movement to obtain the trajectory of each particle. However, although the dust movement at the BF top is a typical dilute two-phase flow, few studies consider the dust formation mechanism at the BF top and then combine the movement of the gas flow to comprehensively analyze the forces acting on the dust particles. In studying the interaction between the two-phase flows, although different models and methods have been used to quantitatively describe the interaction between the two phases, few researchers have focused on the dust at the top of a BF considering the physical mechanism of the turbulence interaction of the gas-solid phase. Similarly, few have investigated the force of the particles and the turbulence pulsation characteristics of the gas flow to quantitatively describe the interphase momentum and turbulent kinetic energy exchange process.
Since the traditional standard k-ε model, which is the equation for turbulent dissipation rate ε, not only contains the isotropy assumption but also cannot describe the influence of dust particle phase movement on the turbulent motion of gas flow, it is not suitable for describing the turbulent motion of gas flow at the BF top. To fully understand and quantitatively describe the distribution law of dust at the top of the furnace,the research content of the dust distribution k-Sε-upmodel in this paper is shown in Fig. 1. First, considering the nature and motion characteristics of gas flow, a k-Sε model describing the movement of the gas flow is established. For thek equation in the k -Sε model, an engineering modeling theory is used to derive a closed turbulent kinetic energy equation based on the gas flow N-S equation that considers the influence of dust particles, and the equation parameters are corrected according to the gas flow characteristics to obtain the k equation that can adapt to complex turbulence. For the S ε part of the k-Sε model, a simple structure of the equation for turbulent dissipation rate S ε, which not only has strict mathematical logic, but also reflects the phenomena such as momentum, scalar and reverse energy gradient transport of the gas flow, is obtained. It is based on the single-Green-function-TSDIA (SGF-TSDIA) theory. Compared with the traditional standard k-ε model, the k-Sε model considers the influence of dust particle phase movement on the turbulent motion of gas flow, does not rely on an isotropic hypothesis, and has good generalization. Second, based on the dust formation mechanism, the distribution characteristics of the mass particle size and the velocity field information of the gas flow at the top of the furnace, the forces acting on the dust particles are carefully analyzed and the motion equation upof the dust particles is developed using Newton’s law. Compared with the traditional dust particle movement model, the upmodel in this paper not only considers the source and mass particle size distribution of dust, but also reflects the influence of top gas flow movement on dust in the model, resulting in higher accuracy. Third, a coupling factor describing the interphase interaction is proposed, and an equation is constructed for coupling the k-Sε and upmodels to obtain the dust distribution k-Sε-upmodel at the top of BF based on phase-tophase coupling. Finally, the correctness of the model is verified through comparisons with the measured industrial data of the gas flow. The simulation results indicate that the dust distribution at the BF top has the characteristics of stratified aggregation distribution with a thick middle and a thin edge. With the distribution law, the installation method and position of detection equipment at the BF top are optimized to improve the precision and service life of the equipment.
The remainder of this paper is organized as follows. Section II introduces the establishment of the k-Sε model that describes the gas flow movement. In Section III, the k-Sε-updustdistribution model of the BF top is developed based on interphase coupling. The simulations and industrial experiments are conducted, and the verification and application of dust distribution law are demonstrated in Section IV. Section V gives the conclusions.
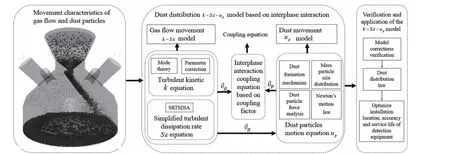
Fig. 1. Research schematic of the dust distribution k -S ε-up model based on interphase interaction.
II. GAS FLOW MOVEMENT k -Sε MODEL
To develop the k-Sε-updust distribution model for the top of a BF based on interphase coupling, it is essential to obtain an accurate k-Sε model of the gas flow. Considering the complexity of the gas flow, some reasonable assumptions are made.
1) The pressure at the BF top is essentially stable. The gas flow is thus equivalent to an incompressible fluid, and physical parameters such as density, kinematic viscosity, and dynamic viscosity are assumed to be constant.
2) The higher-order pulsation terms of the physical pulsation of gas flow are neglected; the model only contains the first-order physical pulsation terms.
3) The pulsation of the gas flow has statistical mechanical principles governing the molecular pulsation. Therefore, the turbulent stress can be expressed as a function of the turbulent kinetic energy and turbulent dissipation rate.
4) The dust at the top of the BF belongs to the dilute suspension flow in the gas flow, and the volume concentration of the solid phase is significantly less than one. The dust particles are assumed to be spheres of the same diameter and density, and there is no crushing and aggregation in the motion orbits of the particles. The ratio of the density between the dust and the gas flow is greater than 1 03.
5) For the interaction effect between the dust and gas flow,only the main Stokes resistance and Saffman lift force of the dust are considered, and the influence of other forces on the gas flow is neglected.
Based on the above assumptions, a continuity equation and the N-S equation of the gas flow considering the dust influence are described as follows:


A. Development of k Equation
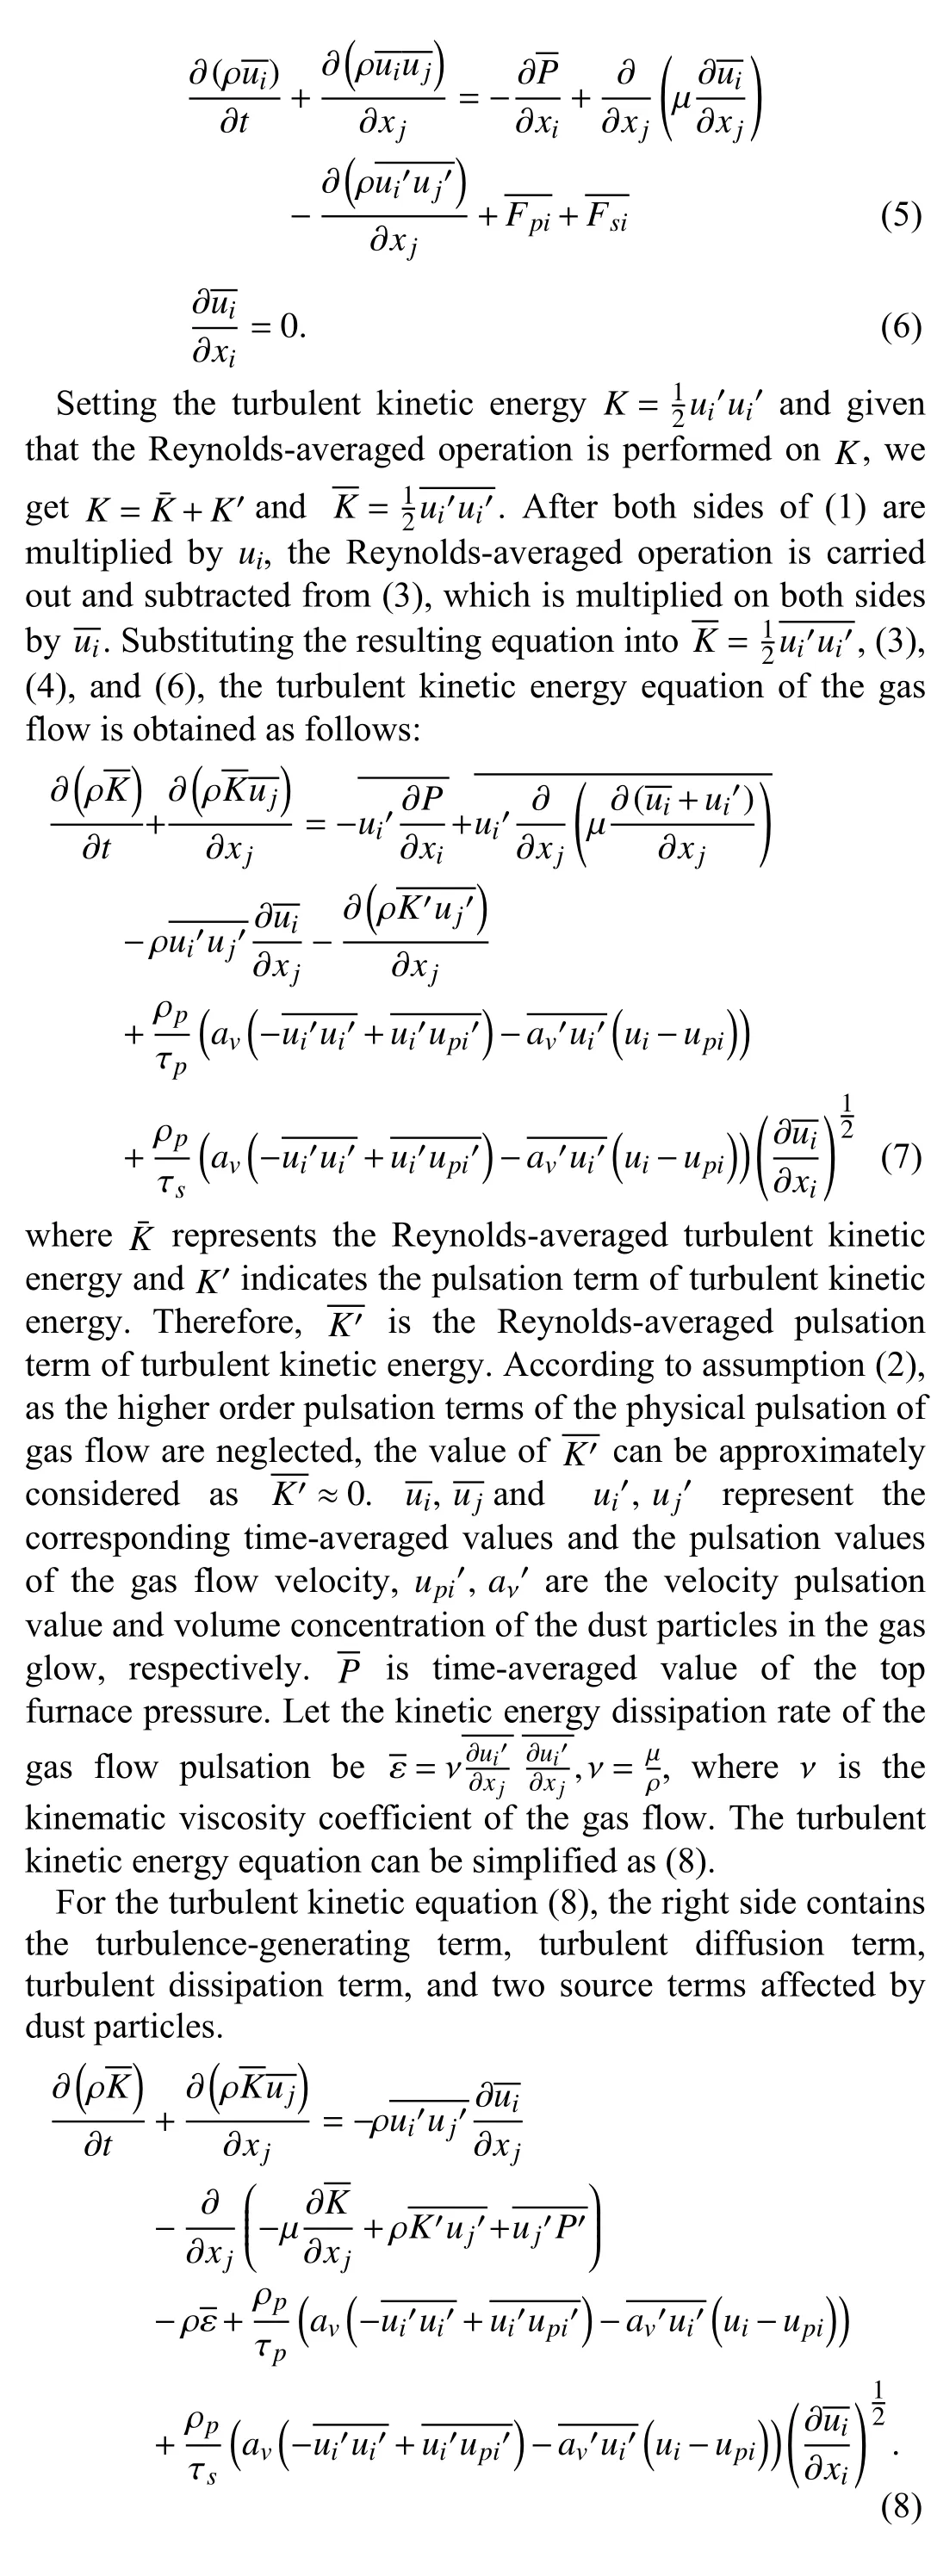
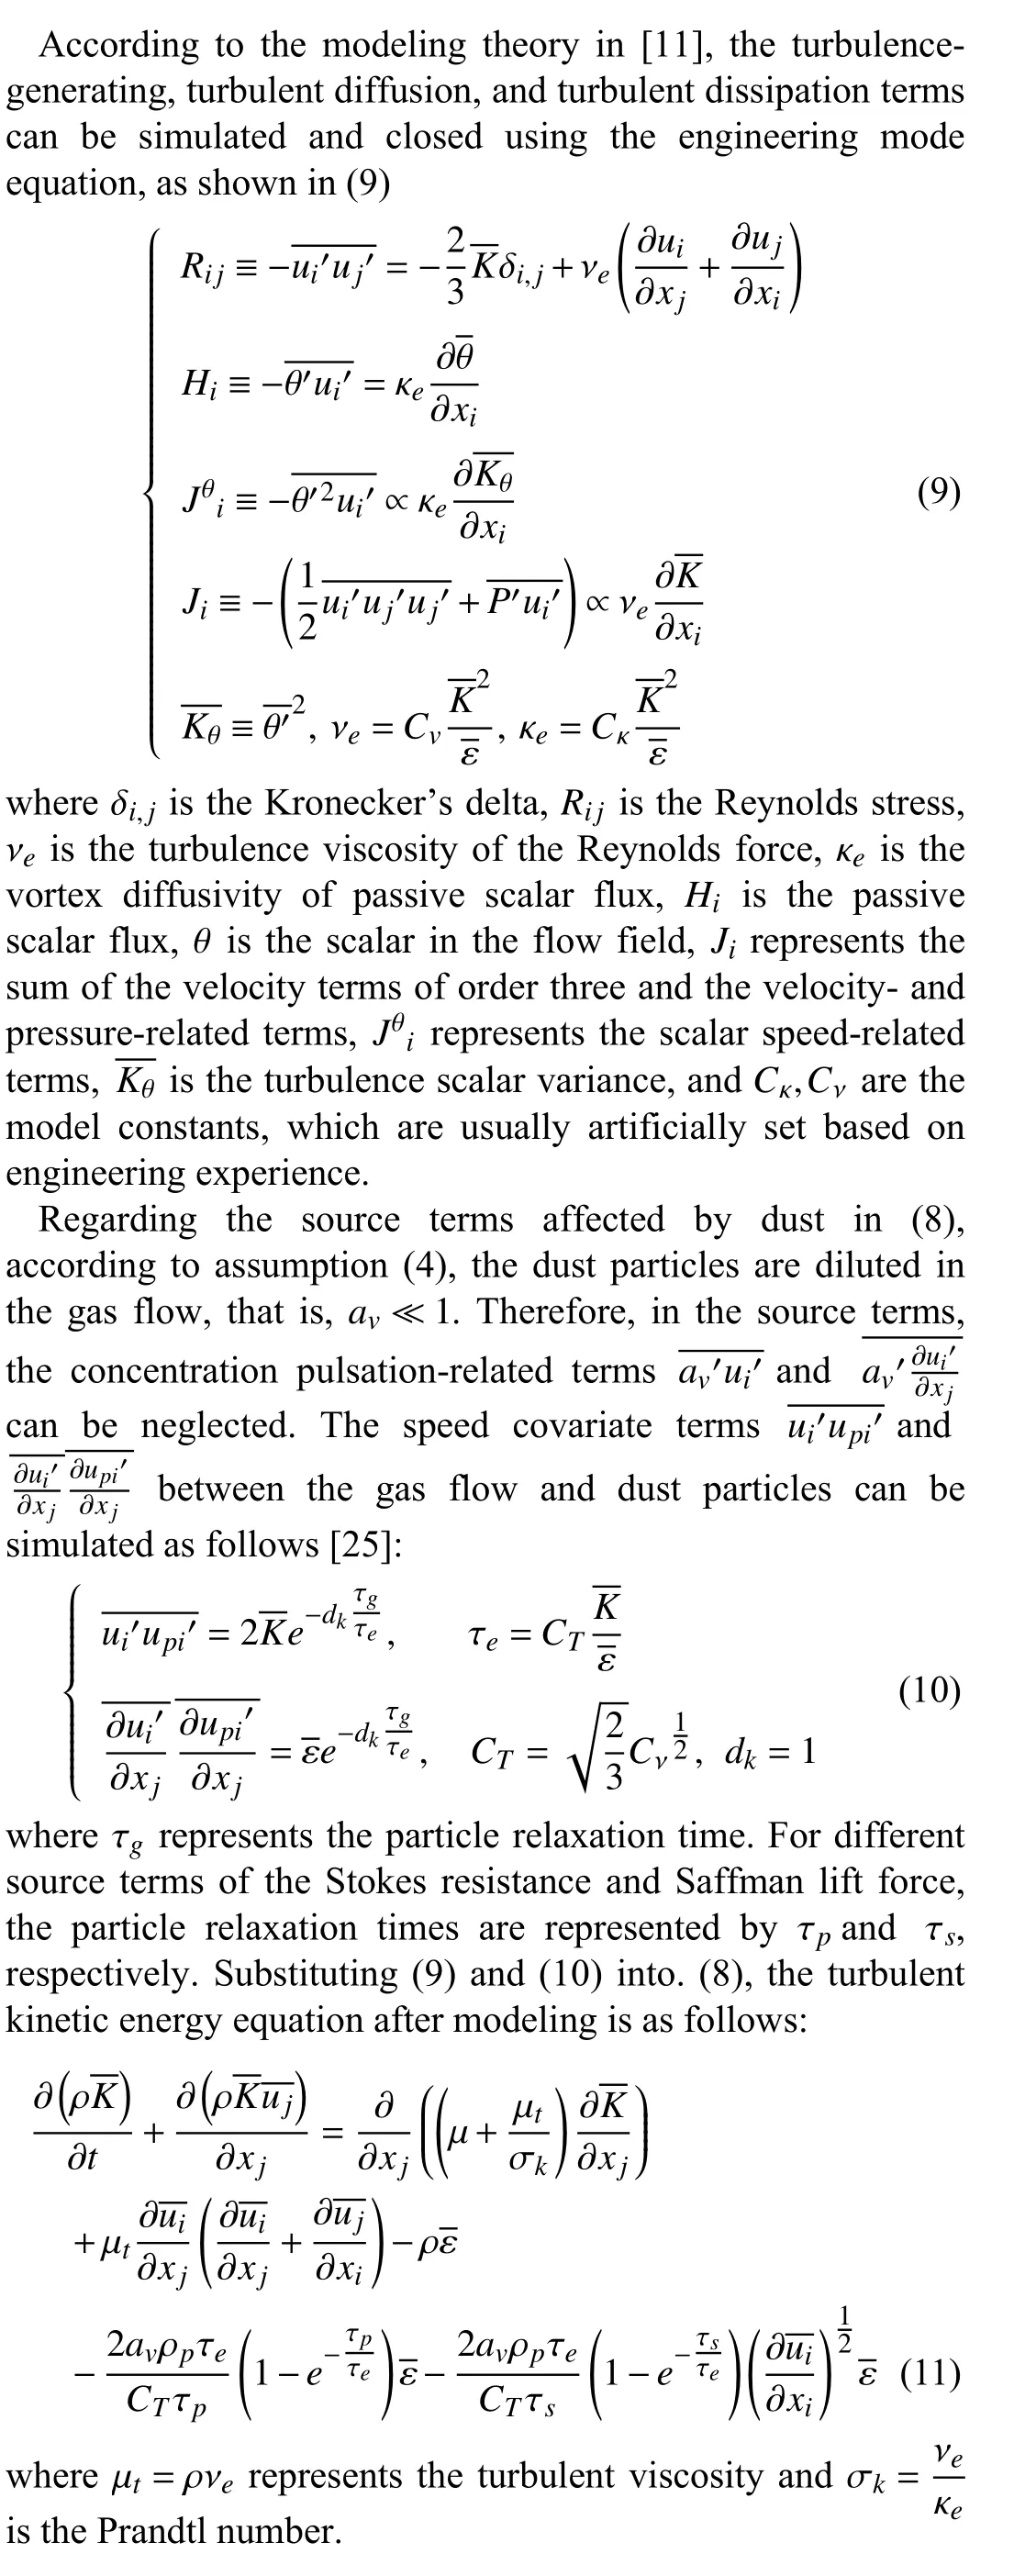
According to assumption (1) and the Reynolds averaged method, the tensor form of the continuity equation and momentum equation of the gas flow affected by dust particles are expressed using (5) and (6).
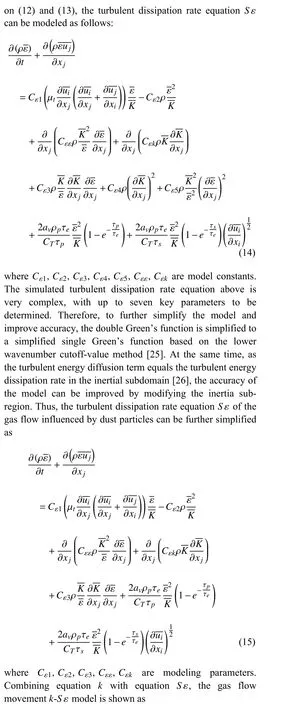
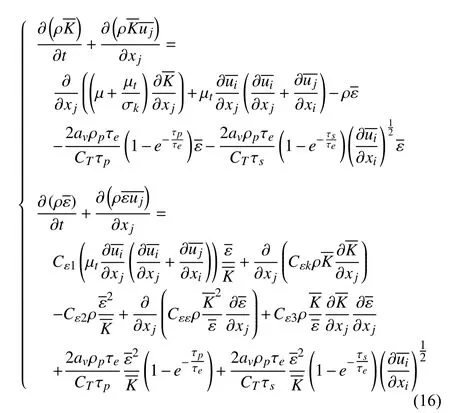
B. Establish Development of S ε Equation

III. DUST DISTRIBUTION k -S ε-up MODEL BASED ON INTERPHASE COUPLING AT THE BF TOP
To obtain the movement and distribution law of the dust particles at the BF top, a hybrid-mode dust distribution model based on interphase interaction must be established. The dust distribution model consists of two modules: the first is the established hybrid mode turbulent gas flow model, which can obtain the velocity field of the gas flow, and the second is a dust trajectory model, which can describe the motion law of the dust based on the hybrid mode turbulent model of gas flow. The development of the trajectory model for the dust particles can be divided into three steps. First, the dust formation mechanism at the BF top is analyzed. Second, the forces acting on the dust particles are comprehensively examined. Third, Newton’s law is used to establish the motion equation to complete the entire modeling process.
A. Analysis of Dust Formation Mechanism
In the melting process, dust is formed at the top of the BF during the crossing of the downward material flow and upward gas flow. When discharging material, a large amount of dust is generated by the fierce collision between the material flow and the burden surface, and during the downward movement of the material flow, minute dust particles are blown up by the gas flow to form dust. In the intermittent period of material discharge, the gas flow also contains a considerable amount of dust from the smelting material, blowing ingredients, and pulverized coal. Therefore,according to the formation mechanism of the dust, the dust at the top of the BF has a high concentration (10-50 g/m3, an average of 25 g/m3) and is produced in large quantities(average 50-70 kg/t of crude iron, maximum 100 kg/t of crude iron). Influenced by the raw smelting materials, furnace temperature, furnace pressure, and wind speed, the dust distribution also exhibits large fluctuations and a complex shape.
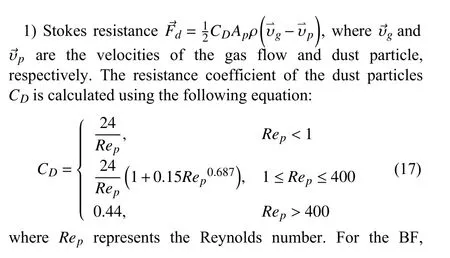
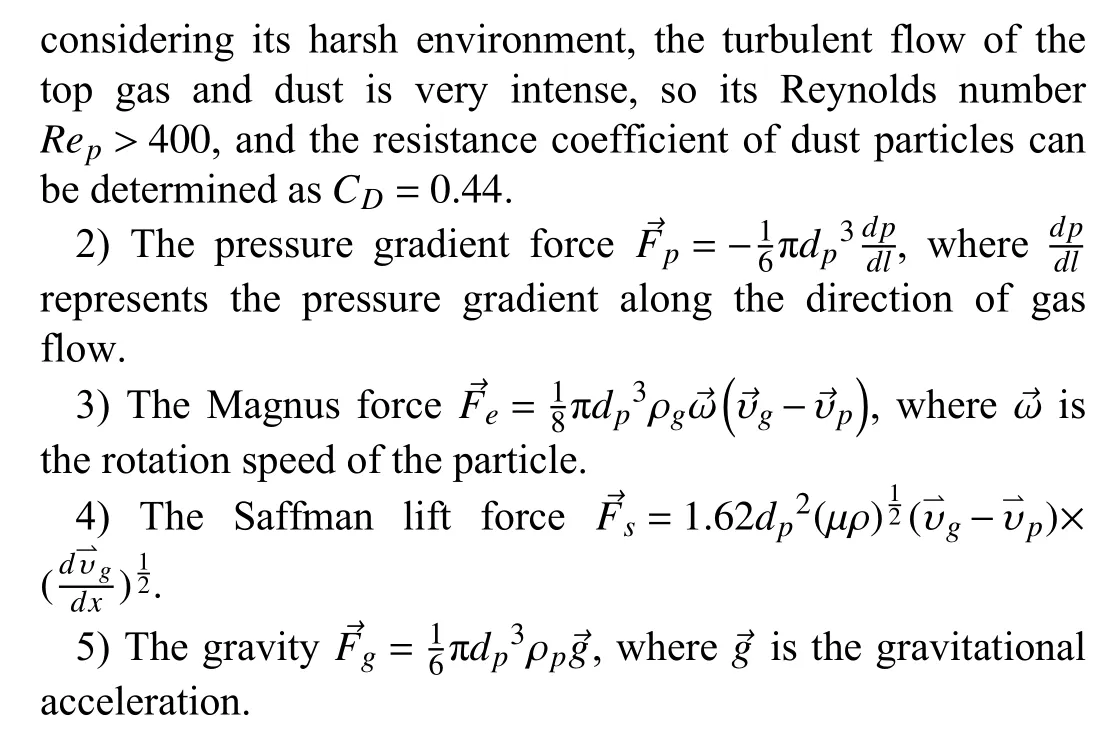
B. Analysis of Forces Acting on the Dust Particles
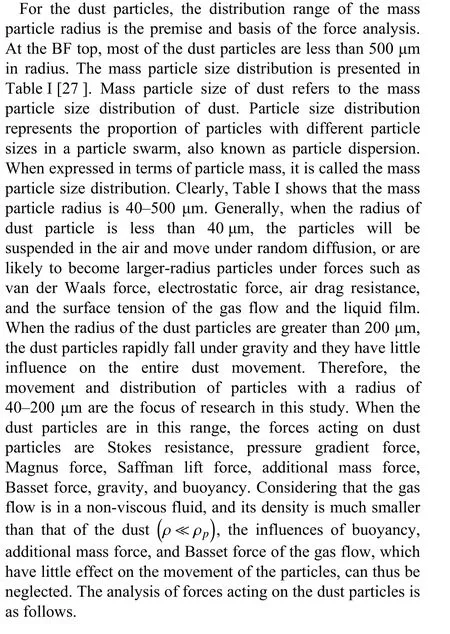

TABLE I MASS PARTICLE SIZE DISTRIBUTION OF THE DUST AT THE TOP OF THE BLAST FURNACE
C. Motion Trajectory Model of the Dust Particles
To obtain the movement equation of the dust particles at the top of the BF, the three-dimensional coordinate system shown in Fig. 2(b) is established. Combined with the dust formation mechanism and the force analysis, the following assumptions are made.
1) The pressure gradients of the gas flow on the X -axis, Yaxis, and Z-axis are known and constant.
2) The angle between the Z -axis and the direction of the lift force of the particles is 45°.
3) The density of a dust particle is much larger than that of the gas flow.
4) The dust particles belong to a dilute phase compared to the gas flow, and the probability of dust particles colliding with each other in the moving gas flow is low, so that the influence on the movement of the gas flow caused by the collision among dust particles is small, therefore, mutual collisions among the particles can be neglected.
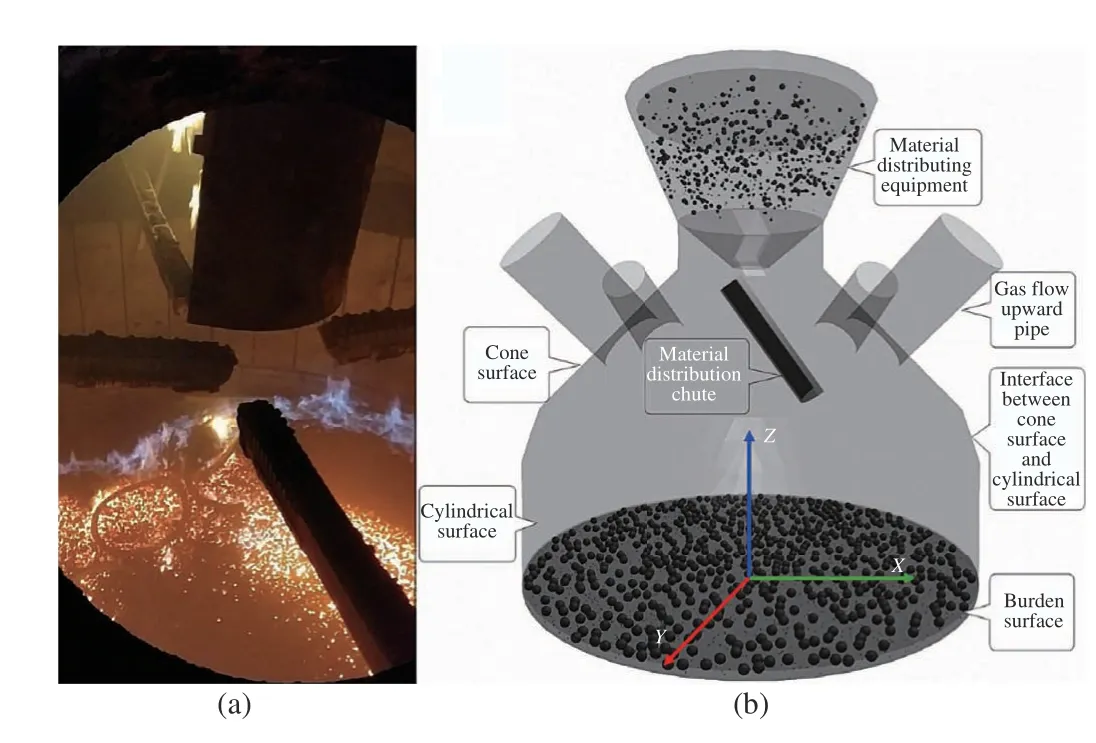
Fig. 2. Structure of the BF top. (a) Physical structure of BF top on-site. (b)Schematic diagram of BF top.
Based on the above assumptions, using the Lagrange coordinate system in the specified three-dimensional space,and according to Newton’s second law, the force balance equation of each dust particle in the gas flow is established as follows:upz, the kinetic equations can be rewritten in tensor form as


where Δt represents the time step of the calculation. The entire trajectory of each particle can be determined by iteratively using (29), and the dust distribution law at the BF top can be obtained from the trajectory statistics of a large number of particles.
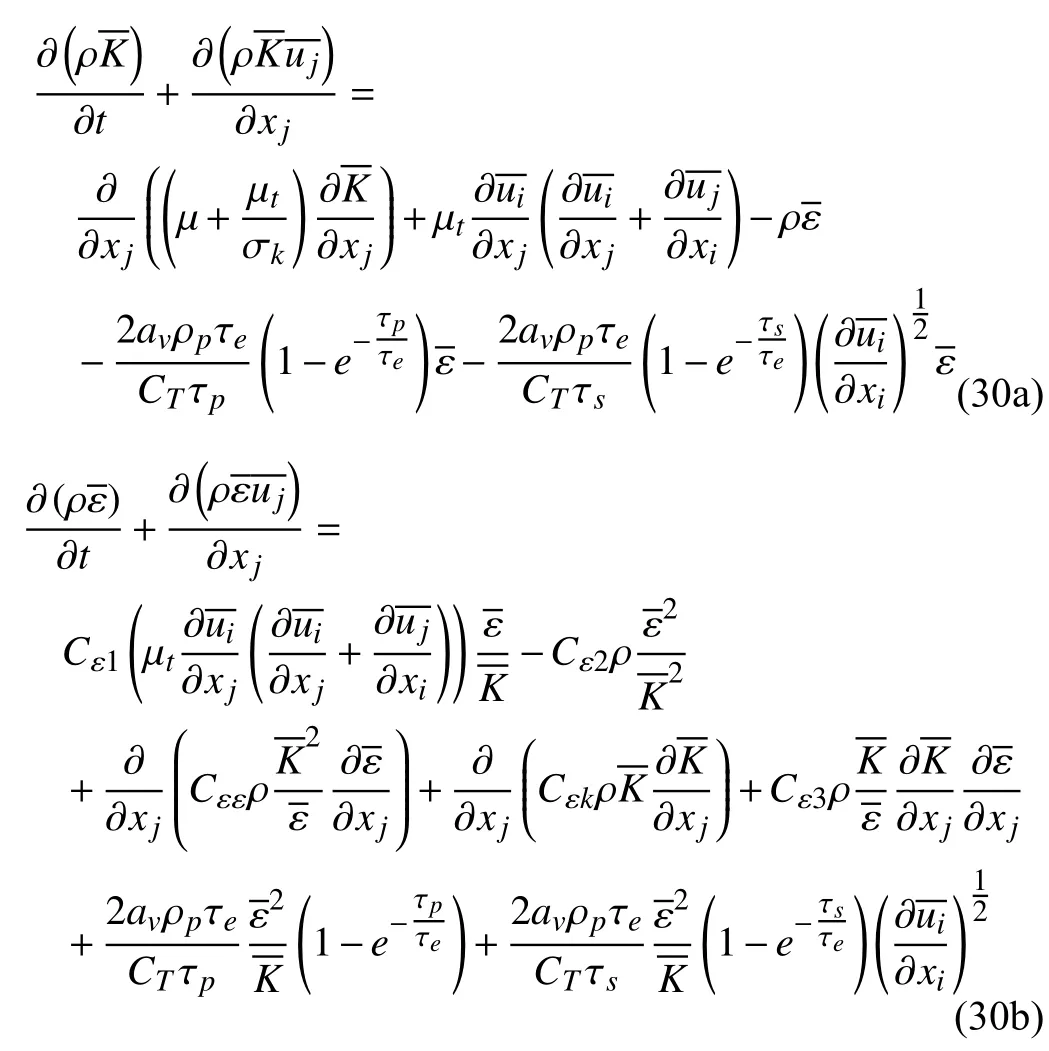
Once the hybrid-mode turbulent model of the gas flow and the movement model of the dust particles have been established, the turbulent interaction effect between the gas and dust particles is used to couple the two models into a single, complete model, as shown in (30). Studying the model reveals that the velocity field of the dust particles affects the relaxation time parameter τp. In the dust particle movement model, the effect of the gas flow on the dust movement is reflected in the fact that the velocity field of the gas flow affects the forces acting on the dust particles. Therefore, the complete hybrid-mode dust distribution model is expressed in tensor form, as shown in (30).


IV. RESULTS AND DISCUSSION
The verification of the validity of the k-S ε-upmodel is conducted from the following four perspectives. First, the open-source software OpenFOAM and particle simulation software EDEM are used to solve and simulate the developed model. Second, for qualitative verification of the accuracy of the developed model, a numerical simulation of the developed model is conducted to examine whether it satisfies the field situation. Third, for quantitatively proving the correctness and superiority of the developed model, the calculated values of the gas flow velocity by the developed model and the control group models are compared with those measured at the nozzles of the upward pipes. Fourth, performing a comparative analysis of the dust distribution between the model simulated results and the dust distribution images captured by the high temperature industrial endoscope, to show that the developed model can correctly reveal the trajectory of the dust. Finally, the dust distribution law at the top of the BF can be deduced.
A. Solving of the Hybrid Dust Distribution Model
OpenFOAM and EDEM are coupled to solve the developed hybrid dust distribution model shown in (30). The simulation steps are as follows:
m3
Step 1: The top of a 2650 BF was taken as the research object. A physical simulation model, as shown in Fig. 2(b),was created according to the real geometry of the BF top.Pellets of different sizes were discharged from the material discharge device at the BF top, then through the rotating chute(4.23 m in length, 0.78 m in width, and with a 38° tilt angle),and finally down to the burden surface. The height, bottom diameter, top diameter, wall thickness, and tilt angle of the cone face were 2.9 m, 9 m, 3.2 m, 0.2 m, and 45°, respectively. The angle with the vertical direction, and the diameter of each of the four upward pipes were 31° and 1.22 m,respectively. The height, bottom diameter, and wall thickness of the cylindrical face were 2.5 m, 9.6 m, and 0.65 m, respectively. The length, wall thickness, and tilt angle of the slope between the cone face and the cylindrical face were 1.08 m,0.25 m, and 71°, respectively. The diameter of the burden surface is 8.3 m.
Step 2: A total of 3 536 668 elements with 0.1 m hexahedra were obtained by meshing the selected geometry model. The number of grid nodes was 611 821. The maximum skewness of the cell was 0.83 and the average value was 0.22, which means the element quality was good.


Step 5: This step represents the solving of the model. The model of (30) consists of three parts. (30a) and (30b) are gas flow turbulent equations; (30c) is the interactive coupling equation; and (30d) is the movement equation of the dust particles. During the iterative coupling calculation process, the velocity of the dust particle obtained at the previous moment was used to obtain parameter τpin the gas flow model by calculating the interactive coupling equation. Next, using OpenFOAM, the gas flow turbulent equations were programmed and incorporated. The initial conditions and boundary conditions were set, and an icoFoam solver example in the software was modified. Within the mesh space, the gas flow turbulent equations were solved to obtain the gas flow velocity data at the current moment. Meanwhile, the movement equation of the dust particles was incorporated into the EDEM software, and the API function provided by the EDEM was used to import the velocity data of the gas flow at the current moment into the particle movement equation.Through the EDEM, the velocity of the dust particle at the current moment can be calculated. Through iterative calculation, the trajectory and distribution of dust particles on the top of the furnace can be obtained, and the entire hybrid dust distribution model can be solved and simulated.
B. Validation of the Gas Flow Turbulent Model
Fig. 3 shows the velocity distribution of the gas flow calculated by the standard k-ε model and the developed k-Sε-upmodel. Figs. 3(a) and 3(b) represent the location of the vertical section, and Figs. 3(c) and 3(d) demonstrate the detailed velocity information of the corresponding vertical section. From the overall velocity distribution, both models show the following characteristics in the lower part of the BF top: 1) The closer the gas flow is to the furnace center, the stronger and faster the flow rate is; 2) The closer the gas flow to the furnace wall is, the weaker and slower is the gas flow.Furthermore, in the upper area of the BF, the closer the gas flow is to the upward pipe nozzle, the greater the flow rate is,and (especially in the upward pipes) the gas flow velocity rises sharply and becomes the strongest of all the zones. To clearly illustrate and compare the velocity difference between the two models, the gas flow velocity is confined to the range of 0-5 m/s. There is only one strong gas flow in the standard k-εmodel, marked ① in Fig. 3(c). However, in Fig. 3(d),there are two strong gas flows given by the developed model,and flow ① is significantly stronger than flow ②. The velocity field distribution calculated by the developed model is in better agreement with the practical smelting condition. That is,in the smelting process, to ensure smooth operation of the BF,two gas flow streams should be maintained at the BF top: the central gas flow and the edge gas flow. The central gas flow must be stronger than the edge gas flow. Therefore, it is reasonable to believe that the developed k-Sε-upmodel is more accurate than the k-ε model in describing the movement of the top coal flow and provides a better representation of the BF smelting mechanism.
Fig. 4 shows the turbulent kinetic energy contours of the gas flow in the corresponding vertical section mentioned in Fig. 3.The overall distributions of the turbulent kinetic energy of the two models are essentially the same. The turbulent kinetic energy changes violently in the areas of the central gas flow,the upward pipe nozzles, and the upward pipes, where the gas flow is complex and rapidly changing. This result satisfies the prior knowledge that the more complex the gas flow, the stronger the turbulent kinetic energy. Therefore, these two models are credible and correct in describing the overall variation of the turbulent kinetic energy of BF top. Comparing Fig. 4(a) with Fig. 4(b) in the central and edge gas flows(marked ① and ②), for the developed k-Sε-upmodel, both the level of change and the continuity of the turbulent kinetic energy are better and clearer, and the changes in the edge flow are more obvious. However, for the k-ε model, the turbulent kinetic energy of the edge flow (marked ②) has no obvious change. At the upward pipe nozzle (marked ③), observing the contour line of turbulent kinetic energy of region ③ of the two models, it is seen that the contour line of thek-Sε-upmodel in Fig. 4(b) forms a complete closed curve and shows a connected turbulent kinetic energy region, which indicates that the gas flow movement on the left and right sides of region ③ is sufficient, and the gas flow in this region has strong intensity. This is consistent with the onsite industrial experience and the smelting technique, as shown by the digital images. However, for the contour line of the k-ε model, it does not form a complete closed curve, which indicates that the gas flow movement on the left and right sides of region ③is insufficient and that the gas flow in this region is not intense. Therefore, compared with the k -ε model, the turbulent kinetic energy of the k-Sε-upmodel is more consistent with the observation results. Moreover, in the upward pipes(marked ④), the strongest turbulent kinetic energy (red zone)of the k-Sε-upmodel is approximately three times larger than that of the k-ε model, which provides a more realistic reflection of the fact that the gas flow movement in the upward pipes is significantly complicated. The simulation results satisfy the practical working condition of BF.
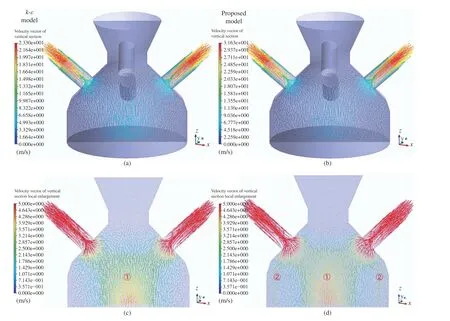
Fig. 3. Velocity vector of the vertical section at the top of the blast furnace. (a) Velocity vector of vertical direction of k-ε model. (b) Velocity vector of vertical direction of k -Sε-up model. (c) Local enlargement of vertical direction of k -ε model. (d) Local enlargement of vertical direction of k -Sε-up model.

Fig. 4. Comparison of contours of the turbulent kinetic energy of the vertical section. (a) k -ε model. (b) k -Sε-up model.
C. Validation of the Hybrid Mode Dust Distribution Model

Fig. 5. Comparison of the calculated and measured gas flow speed at the upward pipe nozzles.
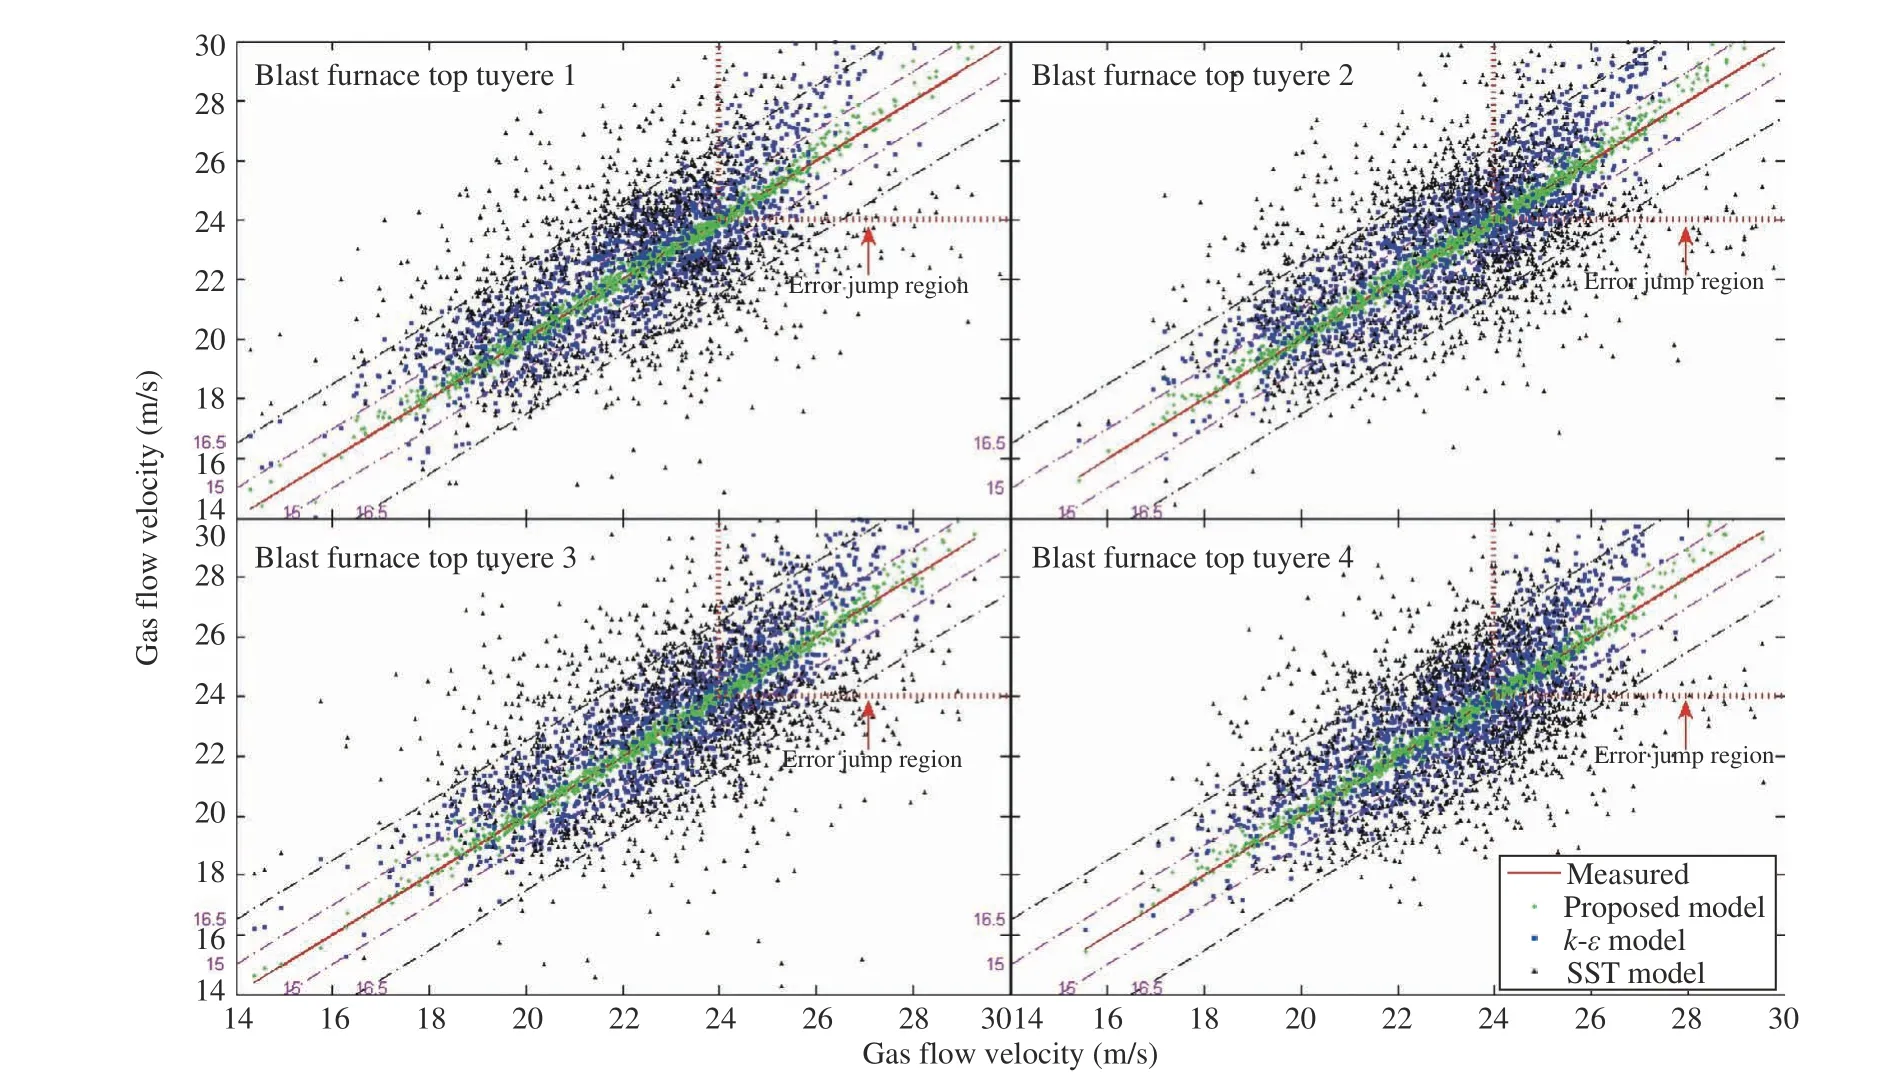
Fig. 6. Comparison of the computational accuracy of different models.
To verify the correctness of the k-Sε-upmodel, the operating conditions of the BF between 6:00-18:00 on a random day were selected as an example, and the outlet gas flow rates were collected at the nozzles of the four upward pipes. By converting the outlet gas flow rate to the outlet gas flow velocity, the measured values of the gas flow velocity were obtained. The sampling time interval was 30 s, and 1435 sets of gas flow data from each upward pipe were sampled.Therefore, we obtained a total of 5740 sets of measured gas flow velocities. The dust distribution models based on the standard k-ε model, the shear stress transport (SST)k-ω model, and the k-Sε-upmodel were separately constructed to calculate the gas flow velocity. The results are shown in Fig. 5.From the figure, the following conclusions can be drawn. First, the gas flow velocity is generally in the range of 19-24 m/s.Second, observing the tracking performance, we see that the standard k-ε model follows the measured values better than the SST k-ω model does, and the values calculated by the developed k-Sε-upmodel is most consistent with the measured values. Third, when the actual flow rate of the gas at the upward pipe nozzle is significantly fluctuating, as illustrated at the turning point in the measured profiles, the tracking performances of the standard k-ε model and SSTk-ω model deteriorate and the errors become larger, whereas the developed k-Sε-upmodel is almost unaffected. This is because the modeling process of the traditional k-ε model and(SST) k -ω model has harsh modeling assumptions, incomplete consideration of modeling factors, and more engineering experience values in the model parameters, making it difficult to adapt to the extremely harsh environment at the BF top.However, during the modelling process of the k-Sε-upmodel,the interaction between the dust phase and the gas flow phase is fully considered, and it is not necessary to assume that the fluid is isotropic in advance, which gives it better robustness for the fluctuations in operating conditions.
Fig. 6 displays the calculation errors of the three models in a more intuitive manner by plotting the deviation between the calculated velocities and the measured velocities. The red solid 45° line indicates the measured value, while the dotted line indicates the degree of deviation of the model calculated value from the measured value. The closer the calculated values are to the 45° line, the higher the model’s precision.For example, the points inside the area between the two purple dotted lines indicate that the deviation degree between the model calculated value and the measured value is less than ± 1 m/s.Similarly, the points inside the area between the two black dotted lines indicate that the deviation degree is less than ± 2.5 m/s.From Fig. 6, the SST k-ω model suffers the largest deviation,and its error distribution becomes divergent. The calculated values of the standard k-ε model are clustered on both sides of the measured value and the maximum deviation is approximately ± 2.5 m/s. It is observed that the maximum deviation of the k-S ε-upmodel is as low as ±1 m/s, indicating higher calculation accuracy than those of the other two models. In addition, comparing the deviation degree of the standard k-ε model with that of the k-S ε-upmodel, it is seen that as the measured speed increases, the degree of deviation of the model becomes gradually smaller and the model accuracy improves. However, once the measured speed is greater than 24 m/s, the situation is reversed. That is, the deviation degree of the model increases rapidly as the speed increases, as shown in an error jump region in Fig. 6. The calculated values are longer distributed on both sides of the measured values, but are generally above the measured values.To determine the mechanism of this phenomenon, the gas flow velocity was taken as an independent variable from 14 to 30 m/s; the average absolute error for each unit velocity interval is shown in Fig. 7. Fig. 7 gives the quantitative distribution of the absolute errors of the three models. When the gas flow velocity is in the range 14-19 m/s, the errors of all three models are large, but this decreases as the velocity increases. This is because, according to the smelting technique of the BF, if the gas flow velocity is less than 19 m/s, the air permeability of the smelting process is poor, and the gas flow is not smooth, which results in abnormal working conditions.In this situation, the gas flow movement at the top of the furnace becomes complicated; in particular, the furnace pressure exhibits small fluctuations, which contradicts the model assumption of constant pressure and causes a decrease in model accuracy. When the gas flow velocity is in the range 19-24 m/s, the working conditions are stable, and the average absolute errors of the SST k -ω model, standard k -ε model, and the k-Sε-upmodel are 2.19 m/s, 1.08 m/s, and 0.21 m/s, respectively. This result shows the superiority of the k-Sε-upmodel.When the gas flow velocity is in the range 24-30 m/s, the instantaneous speed difference between the gas flow and the dust particles becomes larger, and the interaction between the dust particles and the gas flow increases sharply. For the SST k-ω model and standard k-ε model, the interaction between the gas and the particles is not considered. This leads to an increase in model error with the enhanced interphase interaction, and the calculated velocities essentially become greater than the measured values. For the k-Sε-upmodel, the main interaction between gas flow and particles is considered in the model structure. Therefore, the influence of the interphase interaction on the model accuracy is relatively insignificant, which makes the accuracy of the k-Sε-upmodel better than those of the other two models.

Fig. 7. Comparison of mean absolute error of different models.
To display the precision of the three models in a more intuitive way, various statistics are listed in Table II, where the symbols MRE, RRMSE, and RE represent the mean relative error, relative root mean-squared error, and relative error, respectively. From Table II, the MRE of thek-Sε-upmodel is 2.8× and 5.8× lower than those of the standardk-ε model and the SST k-ω model, respectively. For the RRMSE,the k-Sε-upmodel is 4.8× and 2.7× better than the other two models. According to the experience of the smelting process,the model is considered to have practical reference value if RE is less than 5%; if RE is less than 2.5%, the model has industrial practical value. Table II demonstrates that99.41%of the values calculated by the k-Sε-upmodel have practical reference value and 93.73% of these have industrial practical value. These results are superior to those of the standardk-ε model (9 0.31%, 52.09% ) and the SST k-ω model (4 9.74%,15.17%).

TABLE II MODEL PERFORMANCE COMPARISONS OF GAS FLOW VELOCITY
D. Validation of the Dust Distribution Law
To verify the correctness of the k-Sε-upmodel, dust distribution images captured by a new parallel low-light-loss backlight high-temperature industrial endoscope [29] were selected as the control group, and those simulated by the developed k-Sε-upmodel were set as the experimental group.The distributions of dust movement at the top were compared and analyzed to verify the correctness of the k-Sε-upmodel.Fig. 8 demonstrates the movement of the material flow and the dust during the material discharge process. Fig. 8(a) shows that, at the initial point of the material discharge process, most of the dust particles are concentrated in the central part of the BF top, which is displayed by the red curve. The simulation results of Fig. 8(a) indicate that while the dust concentration area does not cover the camera’s shooting area, the burden surface is clearly captured. A small part of the material flow can be captured, which is consistent with the real captured image ① in Fig. 8(e). During the material discharge process,as shown in Fig. 8(b), the dust distribution mainly surrounds the burden surface and the industrial endoscope, as illustrated on the left of the BF top (marked red curve). A large part of the captured image is covered by the material flow, and the small part that is not covered by the material flow contains a large amount of dust. Therefore, the burden surface cannot be observed. This result coincides with the captured image ② in Fig. 8(e). The distribution of material flow and dust in the final stage of the material discharge process is simulated and illustrated in Fig. 8(c). The dust is concentrated on the right of the red curve. According to Fig. 8(c), the captured image may have characteristics such as no material flow in the shooting area and a blurred image because of the dust. These characteristics are consistent with image ③ in Fig. 8(e). Fig.8(d) is the simulation result after the batch material has finished discharging. The dust is concentrated in the upper part of the BF top, above the red curve. It can be deduced that there is no material flow in the shooting area, and a small amount of low-concentration dust remains in this area. Thus,the burden surface can be observed but with lower clarity.Observing image ④ in Fig. 8(e), the burden surface is visible,and a thin layer of dust can be observed.
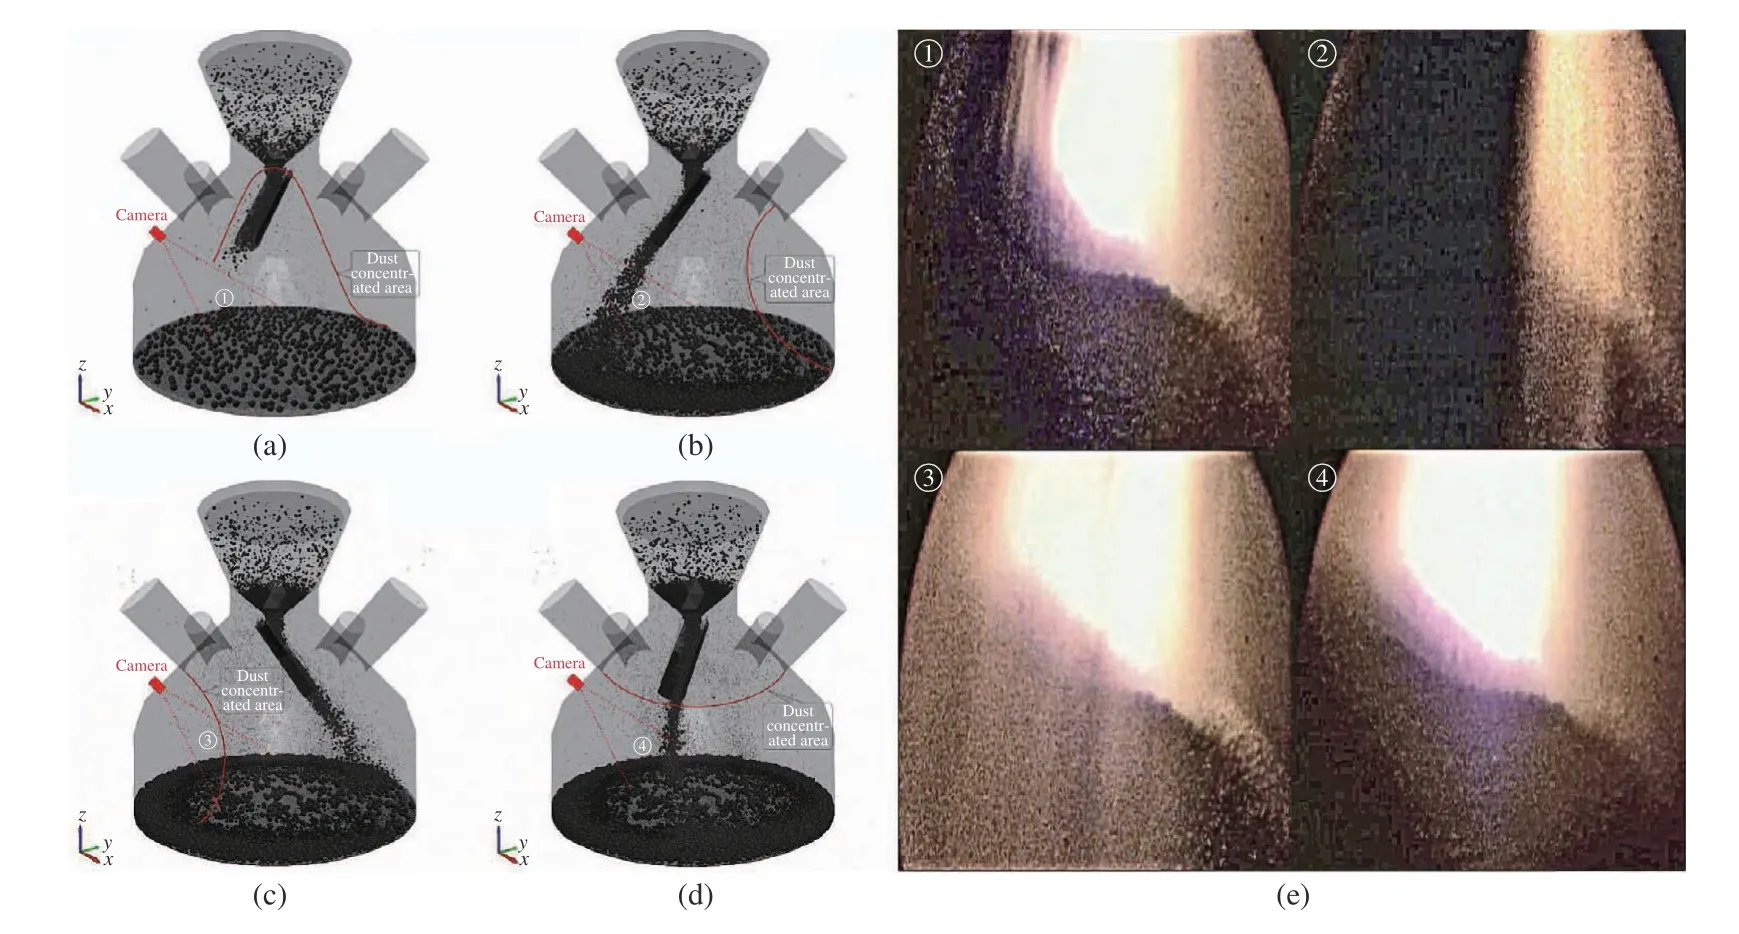
Fig. 8. Comparison of the simulated and captured images of the material flow and dust distribution during the material discharge process. (a) Initial term;(b) Interim term; (c) Final term; (d) End term; (e) Real captured image of the material flow and dust distribution.
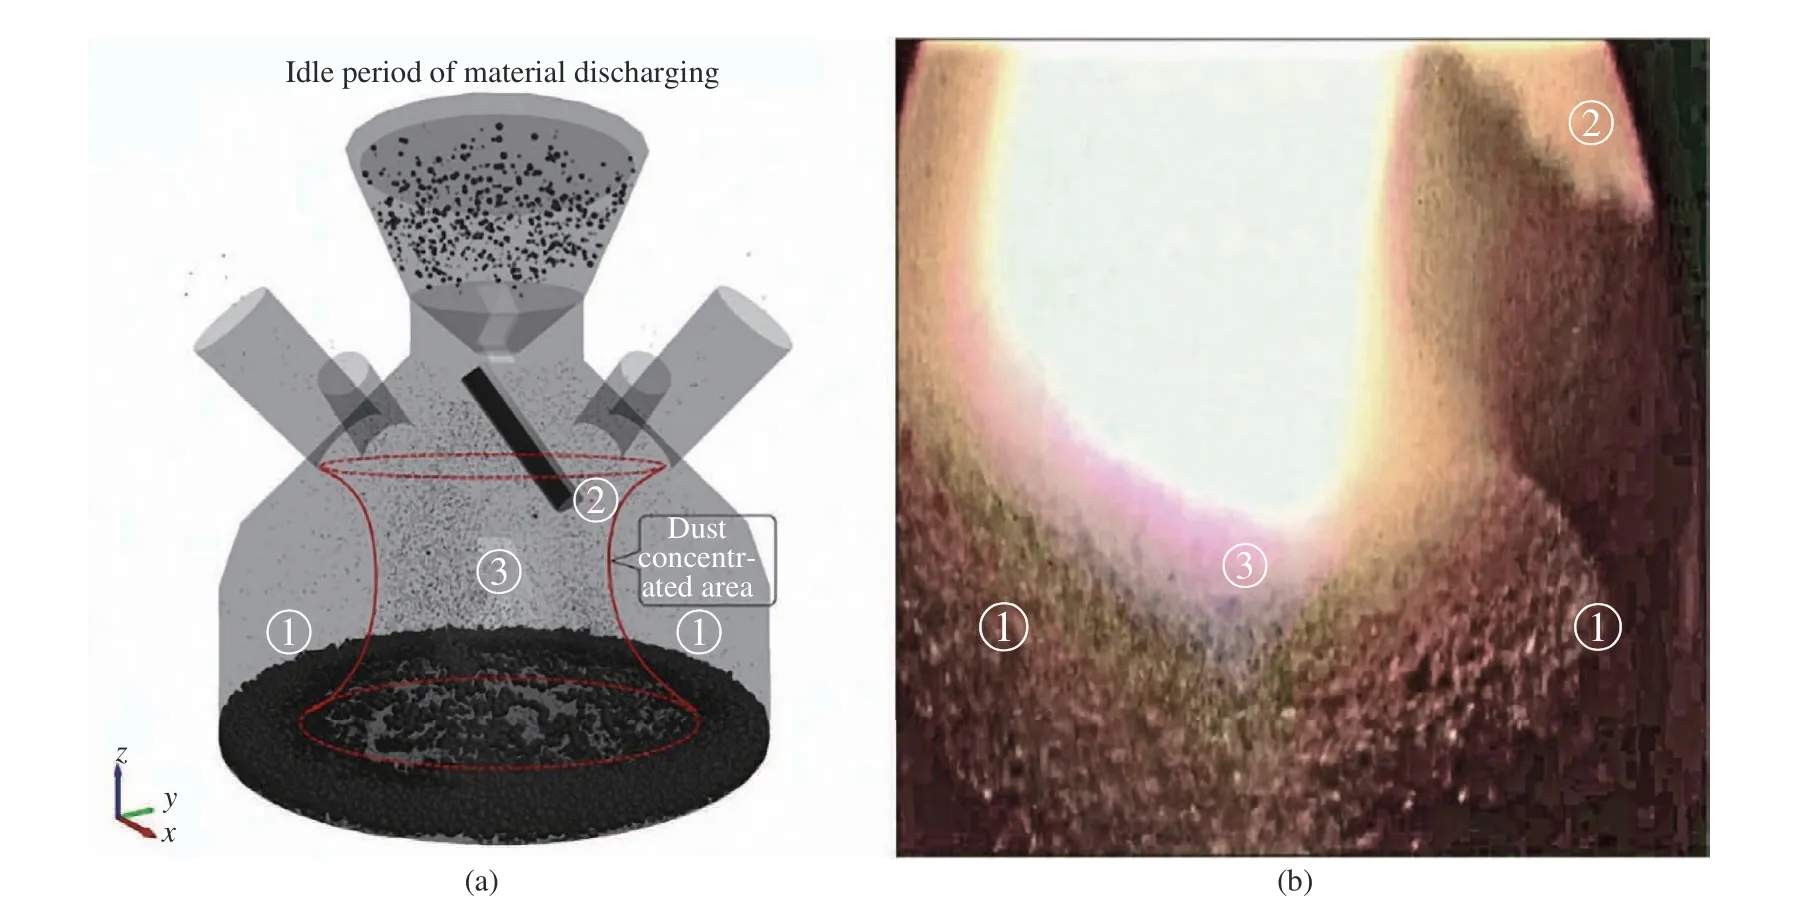
Fig. 9. Comparison of the simulated and captured pictures of the material flow and dust distribution during the idle period of material discharge. (a) Pictures simulated by k -Sε-up model. (b) Pictures captured by industrial endoscope.
For the idle stage of material discharge, the simulation results and the real captured image are shown in Fig. 9. The simulation results in Fig. 9(a) indicate that the dust is not uniformly distributed at the BF top. Zones ② and ③ are the high-concentration dust areas and zone ① is the low-concentration area. From Fig. 9(b), the captured image verifies this distribution. In the low-concentration dust area ①, the burden surface is clear, and details of each pellet particle (shape and contour) can be clearly observed. However, in zones ② and③, under the central high light, the thick dust layer looks like thick white smoke. This comparison between the simulations and the real captured images verifies the effectiveness of the developed model.
Overall, the simulation results of the dust movement and the real captured images of BF top further verify the correctness of the k-S ε-upmodel. It also reveals a rule for the movement and distribution of dust at the BF top that during the idle period, the dust aggregation occurs under the action of the gas flow, forming a high concentration dust area in the center of the BF top and a low concentration dust area at the edge of the BF top. This conclusion provides a new perspective for the study of dust distribution in the BF top.
According to the revealed dust distribution law at the BF top, the installation of the detection equipment at the BF top should follow the three principles below. First, the equipment probe shall be installed on the left or right of the furnace wall at the BF top, instead of directly at the top end of the BF, so as to ensure that the equipment probe is located in the low dust area of the BF top. Second, the equipment probe shall be installed as deep as possible into the hinterland of the furnace top to prevent scabbing of the equipment probe. Third, the equipment should not be installed at the center of the BF top.The installation scheme of the high-temperature industrial endoscope was designed based on the three principles. From industrial application experiments, the installation not only improves the clarity of the burden surface image captured by the endoscope, but also ensures the stable operation of the equipment for more than 6 months.
V. CONCLUSIONS
Based on the generalized fluid motion N-S equation and Newton’s motion equation for dust particles, and by combining the advantages of the modeling theory and turbulence analysis theory, a closed hybrid mode k-S ε-updust distribution model based on interphase interaction with simple structure and strong adaptability has been established. First,the modeling theory and SGF-TSDIA were adopted to produce closed-form turbulent kinetic energy equations and turbulent dissipation rate equations. In this way, a relatively simple structure of the k-S ε model was ensured, making the model suitable for describing gas flow with characteristics such as asymmetric flow, fully developed flow, flow rate with frequent fluctuations, large streamline bending, strong velocity gradients, the presence of separated flow and swirl flow, and extensive inverse gradient transport. Second,through a comprehensive force analysis and Newton’s motion equation, a upmodel was established for dust particles to describe the complex mechanism of their movement. Finally,to quantitatively describe the momentum and energy exchange process between the gas and powder phases, a transport equation for the interaction of the two phases was constructed using the common parameters of the gas-powder movement equation. By comparing with measured values, the standard k-ε model and SST k-ω model, the k-S ε-upmodel was shown to achieve a higher precision with respect to the actual situation inside the BF. Based on the k-S ε-upmodel, the dust at the BF top was found to have the characteristics of an aggregate distribution, and the BF top could be divided into high- and low-dust-concentration areas. This provides the possibility of preventing dust damage, improving precision,and prolonging the service life of detection equipment, and also provides a feasible means of studying the movement of gas flow at the top of BFs.
 IEEE/CAA Journal of Automatica Sinica2021年1期
- IEEE/CAA Journal of Automatica Sinica的其它文章
- A Multi-Layered Gravitational Search Algorithm for Function Optimization and Real-World Problems
- Dynamic Hand Gesture Recognition Based on Short-Term Sampling Neural Networks
- A Sensorless State Estimation for A Safety-Oriented Cyber-Physical System in Urban Driving: Deep Learning Approach
- Theoretical and Experimental Investigation of Driver Noncooperative-Game Steering Control Behavior
- An Overview of Calibration Technology of Industrial Robots
- An Eco-Route Planner for Heavy Duty Vehicles
