Does nitrogen fertilization impact nonstructural carbohydrate storage in evergreen Podocarpus macrophyllus saplings?
Renshan Li·Jianming Han·Liqiong Zhu·Lijun Zhao·Xiangling Huang·Mingyue Zhang·Qingpeng Yang·Weidong Zhang
Abstract Nonstructural carbon (NSC),which represents the relationship between the carbon source and carbon sink,is an important factor that reflects the functions and performance of a tree.However,little is known regarding the timeseries responses of NSC storage in evergreen species to different nitrogen (N) fertilization regimes.This study,which was based on a pot experiment,examined the response of the NSC (soluble sugars and starch) storage to different N addition intensities [light N addition (LN):6.5 g N m−2 a−1 ;moderate N addition (MN):13.0 g N m−2 a−1 ;and heavy N addition (HN):26.0 g N m−2 a−1)] in saplings of the evergreen species Podocarpus macrophyllus.Our results showed that the net photosynthetic rate (P n) under MN was significantly higher than that under LN,but was comparable to that under HN.Moreover,saplings subject to MN had a significant higher leaf biomass than that to LN and HN.These results indicated that the C supply via photosynthesis under MN was greater than that under LN and HN.The NSCs reserve under MN was considerable with that under LN,which suggested that saplings in MN group consumed higher and stored lower properties of NSCs than those in LN group.However,saplings under HN stored higher properties of NSCs than those under MN considering that no difference in NSCs pools was found between the two treatments.The leaf N concentrations were found in the increasing sequence of LN < MN < HN,whilst the leaf chlorophyll concentration under HN was obviously lower than that under MN.The growth rate under MN was higher than that under LN and HN.We concluded that the NSCs allocation between consumption and reserve in P.macrophyllus saplings depended on soil N availability,and an excessive N addition to soil favors the storage rather than the consumption of NSCs by plants.
Keywords Photosynthate·Allocation·Source-sink balance·Plant nutrient supply·Podocarpus macrophyllus saplings
Introduction
The stored non-structural carbon (NSC,primarily soluble sugars and starch (Hoch and Köner 2003) in plants plays a key role in maintaining proper tree function (Furze et al.2019).NSC can be carried to aboveground and belowground organs as fuel for respiration,solutes for osmoregulation,and building blocks for growth (Hartmann and Trumbore 2016;Furze et al.2019).The plant NSC pool is an indicator of the balance between the carbon gain via photosynthesis (source) and the demand via growth and respiration(sink).This implies that the plant NSC pool increases when the assimilated carbon (C) exceeds the demand for C,but decreases when the assimilated C fails to meet such a demand (Kozlowski 1992;Würth et al.2005;Sala et al.2012;Dietze et al.2014).Moreover,the transportation of NSC from leaves to other organs is a sink-driven process,by which carbohydrates are preferentially transferred to organs with the highest demand (optimal partitioning theory) (Kobe et al.2010).Thus,although the NSC represents a small proportion of the tree biomass,its level in various organs mirrors their respective functions,reflecting a tree’s functions at the whole-plant level (Hartmann and Trumbore 2016;Martínez-Vilalta et al.2016).
Nitrogen (N) is often a limiting resource in forest ecosystems and N fertilization often leads to increases in tree productivity (Manter et al.2005).The increased N supply caused by N fertilization might have a substantial effect on tree NSC conditions.Although studies regarding the effect of N fertilization on plant NSC have been conducted,the results were not conclusive in terms of plant NSC storage and internal allocation in response to N fertilization.According to previous studies,N fertilization could both increase(Ai et al.2017;Xiao et al.2017) and decrease (Alderman et al.2011) the NSC storage at the whole-plant level,and also had contrasting influences on the NSC allocation between various plant organs (Huttunen et al.2013;Ai et al.2017;Xiao et al.2017).
These discrepancies could be partially explained as follows.First,although enhanced N supply may increase photosynthesis leading to higher NSC availability,it may also increase tree growth and respiration leading to lower NSC availability (Stockfors and Linder 1998;Yan et al.2019).Also,there is evidence that the storage of carbohydrates can decrease if tree growth is stimulated by nutrients (Knox and Clarke 2005).Thus,the uneven balance between C gain and C consumption adds to the uncertainty of the response of tree NSC storage to N fertilization.Second,the effect of N fertilization on tree NSC storage and allocation is related to species,soil nutrient supply,and the type of ecosystem(Kobe et al.2010;Ai et al.2017;Wang et al.2019).Despite previous investigations providing important insights on how different N fertilization regimes affect plant NSC storage and allocation across various organs,these studies considered mainly herbaceous species (Alderman et al.2011;Ai et al.2017;Xiao et al.2017;Wang et al.2019) or deciduous tree species (Luo et al.2006;Huttunen et al.2013).To date,it is unclear to what extent N addition influences the NSC status in evergreen trees,which might show a different storage strategy compared with that of deciduous tree species(Furze et al.2019).
The different sampling times in previous studies might also have contributed to the conf licting results,because the storage and allocation of NSC in plants have an obvious seasonal fluctuation owing to the different C gain and C consumption in contrasting seasons (Sala et al.2012;Klein and Hoch 2015;Furze et al.2019).Thus,to accurately evaluate the performance of trees under different N fertilization regimes,a time-series response of plant NSC storage and allocation to N addition is necessary,which has received little attention previously (Alderman et al.2011).
Podocarpus macrophyllusis an evergreen tree species,which is widespread in the tropical and subtropical regions of China.In the present study,we choseP.macrophyllusas a representative evergreen tree species to explore the responses of NSC storage to different N fertilization regimes.Specifically,we characterized the organ-related NSC concentration of two-year oldP.macrophyllusseedlings subject to three different N addition intensities in various seasons,and then scaled these data up to the whole-plant level.We addressed the following questions:(1) Does the NSC storage change with different N fertilization regimes;(2) If so,what is the degree of seasonal fluctuation?
Materials and methods
Study site description
The experiment was conducted in Guangxi University (22°50′ N,108° 17′ E) in Nanning,Guangxi province,China.This region is characterized by a humid south subtropical monsoon climate,with an average annual temperature of 21.8 °C,and a mean annual precipitation of 1350 mm.The coldest and hottest months are January (average of 12.5 °C)and July (average of 28.6 °C),respectively.The precipitation is unevenly distributed over the year,and about 85% of the rainfall occurs in April to September.In March 2017,100 one-year-oldP.macrophyllussaplings were obtained from a local nursery garden and transferred into plastic pots (diameter 31.5 cm;height 22.5 cm).These pots were perforated at the bottom to allow water drainage,and were filled with homogenized surface forest soil.The soil had a total N of 0.85 g kg−1,and available N of 54 mg kg−1.
Experimental design
In October 2017,a total of 90 healthy saplings,which were relatively uniform based on their height and ground diameter,were selected in this N fertilization experiment.Three N fertilization regimes were imposed:(1) Low N addition (LN,6.5 g N m−2a−1),(2) moderate N addition (MN,13.0 g N m−2a−1),and (3) heavy N addition (HN,26.0 g N m−2 a−1).Each of the three N fertilization regimes contained 27 pots,and urea dissolved in 1 L distilled water was applied in each pot.For each N treatment,the saplings were harvested in January (non-growing season),April (early stage of growing season),and October (late stage of growing season) 2018,respectively,and thus resulting in 9 replicates at each sampling date.Another 9 pots of saplings which were harvested at the beginning of the experiment were used to assess the initial sapling biomass.During the experiment,all these saplings were exposed in full sunlight.To ensure that all saplings were exposed to homogeneous condition,all pots were randomly arranged daily.
Gas exchange and leaf chlorophyll measurements
Due to the equipment failure,leaf gas exchange and chlorophyll were measured only twice.The net photosynthetic rate (Pn) was measured at 15 January and 15 April,2018,using a portable photosynthesis system with a red/blue LED light source and a CO2injector (LI-6400,LI-COR,Inc.,Lincoln,NE,USA).The measurements were taken between 9:00 and 11:00 at each sampling date.Three mature leaves were placed in a 2 cm × 3 cm leaf chamber for gas-exchange measurement.In the leaf chamber,the light intensity and CO2concentration were kept constant at 1500 μmol m−2s−1and 0.4‰ mg L−1,respectively.The leaf temperature was maintained at about 25 °C,and the leaf-to-air vapor pressure deficit ranged from 0.75 to 1.5 mmol mol−1for all measurements.Leaves were allowed to acclimate to the light intensity for 15 min,and measurements were not taken until the photosynthetic values were constant.After the photosynthetic measurements,the leaves enclosed in the chamber were harvested and scanned by a leaf area meter (LI-3000,LI-COR,Inc.,Lincoln,NE,USA),andPnwere corrected to the actual leaf area (Li et al.2017).
For each sapling that subject toPnassessment,about 20 leaves were collected and stored at −70 °C for chlorophyll measurement.According to the method of (Dong et al.2015),leaf chlorophylls were extracted from 0.5 g freezeground leaf samples in 10 ml of an 80% (v/v) aqueous acetone solution.After extraction,the samples were centrifuged and the absorbance of the supernatant was measured at 663.6 and 646.6 nm using a UV/VIS spectrophotometer (Lambda 25,PerkinElmer Ltd.,Singapore).The chlorophyll concentration was calculated according to the equations of (Porra et al.1989).
Determining the sapling biomass
To determine the sapling and organ biomass,saplings were harvested at each sampling time were divided into five parts:leaf,twig,stem,coarse root (with a diameter of ≥ 2 mm),and fine roots (with a diameter of < 2 mm) (Tang et al.2016).Subsequently,these organs were rinsed with deionized water and dried to a constant mass at 65 °C.The growth rates were calculated using the difference between the sapling biomass measured in October 2018 and the initial biomass measured in October 2017.
Determining leaf N and NSCs in various organs
A sample of each organ was taken and microwaved in a microwave at 600 W for 90 s to stop all enzymatic activity.Afterward,these samples were dried to a constant mass at 65 °C and ground to pass a 0.2-mm sieve using a ball mill.The assessments of leaf N concentration was performed by using a Vario MAX CN analyzer (Elementar Analysensysteme GmbH,Hanau,Germany).The concentrations of NSC,defined in this study as soluble sugars (i.e.,sucrose,glucose,and fructose) and starch,were determined as described by Zhang et al.(2014).In brief,60 mg of the milled sample was extracted with 10 mL of aqueous ethanol (80% v/v) for 24 h,and centrifuged at 4000×gfor 10 min.Then,the pellet was re-extracted with 5 mL of 80% v/v ethanol,and centrifuged again.The supernatant was used to determine the concentration of soluble sugars at 490 nm with a UV/VIS spectrophotometer (Lambda 25,PerkinElmer Ltd.,Singapore).The pellet was used for starch measurement.Specifically,10 mL of distilled water was added to the pellet,which was then boiled for 15 min.After cooling to room temperature,fungal α amylase (300 U mg−1) was added,and the pellet residues were incubated in a water bath at 60 °C for 1 h and centrifuged at 4000×gfor 10 min.The supernatant was used to determine the concentration of starch using the same procedure as that for soluble sugars.The concentration of starch was obtained by multiplying a reference concentration of glucose by the conversion factor of 0.9.
Statistical analysis
One-way ANOVA with Tukey’s HSD was used to determine the response ofPn,leaf chlorophyll concentrations,and biomass increasement to the changes in N addition.Repeated measure analysis of variance (ANOVA) was used to determine the effects of N fertilization,date,and their interactions on leaf N concentrations,leaf biomass,organ-specific concentrations of NSCs,and whole sapling NSCs pools.Tukey’s honestly significant difference (HSD) test was used to determine the differences among different N fertilization regimes if a significant(P< 0.05) or marginal significant (P< 0.10) effect of N was detected based on the repeated measure ANOVA.All statistical analyses were carried out using the SPSS 22.0 (SPSS Inc.,Chicago,IL,USA).
Results
Sapling photosynthesis
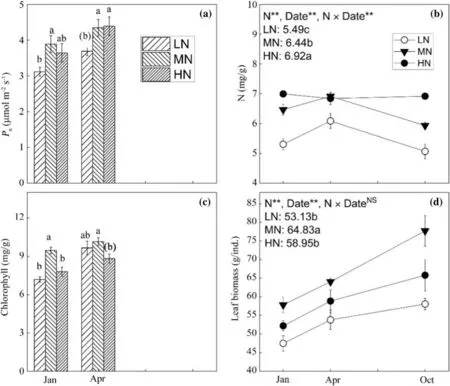
Compared with that in LN group,the saplings in MN group showed an obvious increase inP nin January (P< 0.05) and April (P< 0.10) (Fig.1 a).Interestingly,P nwas unchanged when the N addition intensity was increased from MN to HN in both sampling date (Fig.1 a).The leaf N concentrations were found in the increasing sequence of LN < MN < HN (Fig.1 b).In January,the leaf chlorophyll concentration under MN was significantly higher than that under LN and HN,while difference in leaf chlorophyll concentration was found only between MN and HN group in April (Fig.1 c).Saplings under MN had notably greater leaf biomass than those under LN and HN (Fig.1 d).

Fig.1 Changes of net photosynthetic rates (P n) (a),leaf N concentrations (b),leaf chlorophyll concentrations (c),and leaf biomass (d)with different N fertilization regimes.Different lowercase letters not in and in brackets indicate significant (P < 0.05) and marginal significant (P < 0.10) difference,respectively,among different N addition intensity.Values are the mean ± SE (n=9)
NSC storage and growth
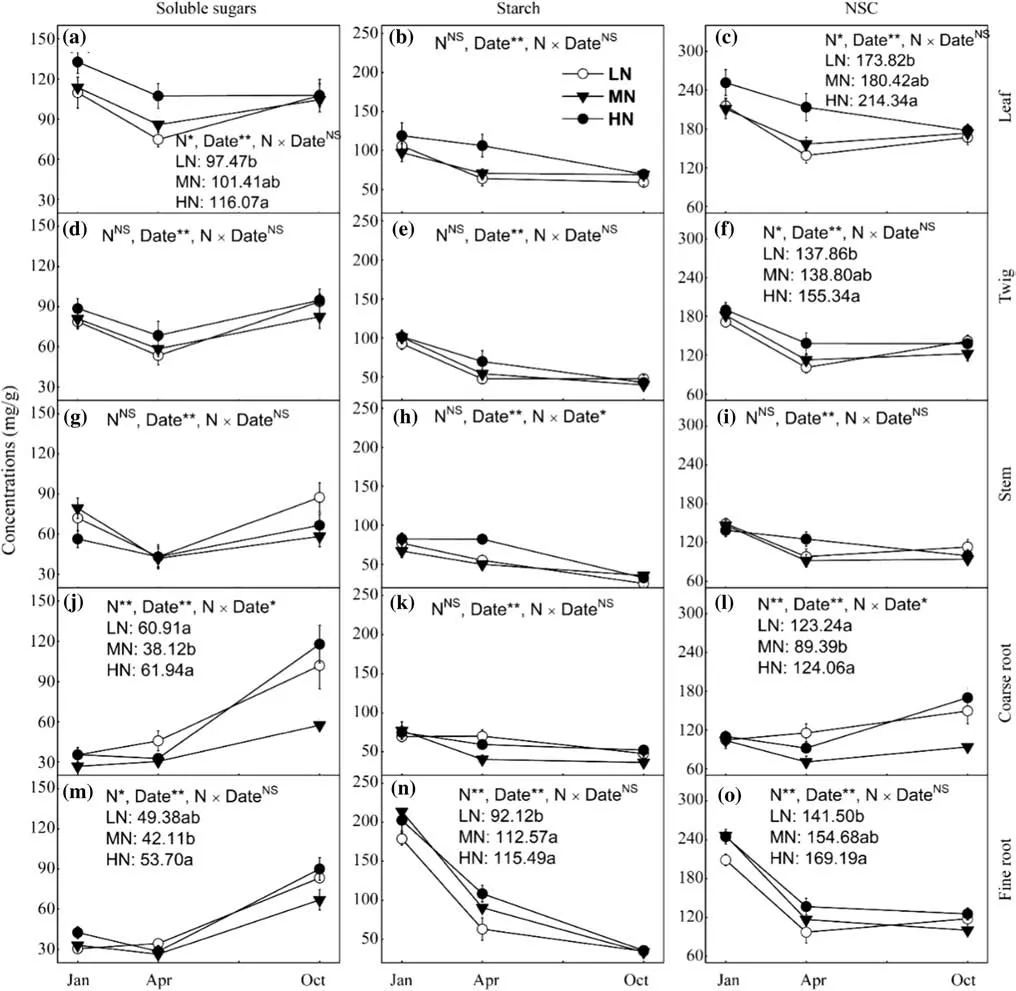
The concentrations of soluble sugars and NSC in the leaf were enhanced with increasing N addition intensity,with a significant difference between LN and HN (Fig.2 a,c).However,no difference in the concentration of leaf starch was detected among LN,MN,and HN (Fig.2 b).The treatment-induced difference in the NSC concentration in twigs was similar to that of leaf,while both the soluble sugar and starch concentrations of twigs were comparable among the three N fertilization regimes (Fig.2 d–f).In contrast to leaves and twigs,higher N addition had no influence on the concentrations of NSC,soluble sugar,and starch in the stem (Fig.2 g–i).The concentrations of soluble sugars and NSC in coarse roots under MN were significantly lower,by about 30%,than those under LN and HM,whilst N addition changes had no effect on the concentration of starch in the coarse roots (Fig.2 j–l).Unlike in the coarse roots,in the fine roots,both NSC and its two components showed their highest concentrations in HN (Fig.2 m–o).

Fig.2 Responses of soluble sugars,starch,and NSC concentrations of leaf (a–c),twig (d–f),stem (g–i),coarse root (j–l),and fine root (m–o) to N fertilization,date,and their interactions.* P < 0.05,** P < 0.01.Different lowercase letters indicate significant difference (P < 0.05) among different N addition intensity.Values are the mean ± SE (n=9)
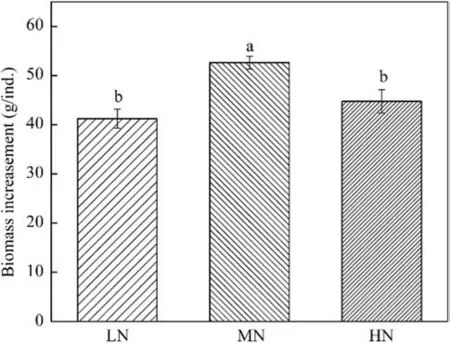
Saplings in HN group had significantly larger pools of NSC and its two fractions than that in LN group,but no difference in NSCs pools was detected between LN and MN group or MN and HN group (Fig.3).Moreover,the pools of soluble sugar and starch showed different seasonal dynamics (Fig.3 a,b).Differed from the soluble sugar pools which peaked in October (Fig.3 a),the starch pools were decreasing from January to October (Fig.3 b).The NSCs pools showed no response to the interaction between N fertilization and season (Fig.3).From January to October,the biomass increasement under MN was significantly higher than that under LN and HN (Fig.4).

Fig.3 Responses of pools of soluble sugars (a),starch (b),and NSC (c) to N fertilization,date,and their interactions.(*) P < 0.10,*P < 0.05,** P < 0.01.Different lowercase letters indicate significant difference (P < 0.05) among different N addition intensity.Values are the mean ± SE (n=9)

Fig.4 Sapling biomass increase following LN,MN,and HN.Different lowercase letters indicate significant difference (P < 0.05) among different N addition intensity.Values are the mean ± SE (n=9)
Discussion
The response of NSC storage to N addition of different intensity
The typical mass balance model holds that NSC reserves in plants represent photosynthetic production minus respiratory consumption and allocation to new tissue growth (Dietze et al.2014).Based on this model,we found that the effect of N fertilization on the NSC partitioning to reserve and consumption inPodocarpus macrophylluswas related to the N addition intensity.
Given that saplings in MN group had higherPnand greater leaf biomass than that in LN group (Fig.1 a,d),the C supply via photosynthesis under MN should be larger than that under LN.However,the NSC pool of MN group was similar to that of LN group (Fig.3 c),which indicated that the saplings in MN group preferentially consumed than stored their NSCs compared with those in LN group.This result was in line with those of previous studies showing that the starch accumulation in plants increased in nutrient deficient soils but decreased in nutrient rich soils (Matson and Waring 1984;Curtis et al.2000).These findings are not surprising considering that plants under better nutrient supply often have stronger desire to accumulate biomass rather than NSCs (Knox and Clarke 2005).Alderman et al.(2011)also concluded an increase in the utilization of NSCs by plants with N fertilization based on a concentration assessment.Although the conclusion of Alderman et al.(2011)was compatible with ours,it was important to note that the estimation based only on NSC concentrations in various organs was not so accurate because the biomass of different organs might be unevenly changed by N enhancement.As expect,the saplings in MN group had higher growth rates than those in LN group (Fig.4),which indicated that more NSCs under MN have been translated into new tissue growth.Unfortunately,the respiration was not measured in the current study,and we could not determine how the NSC allocation to respiratory process changed facing an increased N availability,from LN to MN.
Interestingly,when the N addition intensity was increased from MN to HN,we observed a constantP n,accompanied by an increased N concentration in leaves(Fig.1 a,b).This phenomenon could be explained as follows.First,N in MN group was sufficient and was not a growth-limiting factor,thus a higher N supply than this level would not exert a substantial influence on leaf photosynthesis (Luo et al.2006).However,this interpretation should not work because the leaf chlorophyll concentration and sapling growth rate under HN was significant lower than those under MN (Figs.1 c,4).In fact,this change pattern of leaf chlorophyll concentration and sapling growth rate partially supported the second explanation that HN might have caused an inorganic N toxicity on plant physiology.In an N-rich forest in southern China,Mao et al.(2018) also reported that an excessive N addition (15 g N m−2a−1) could impose a negatively toxic effect on plants by restricting the absorption of other mineral nutrients(e.g.K,Ca and Mg) by the roots.
The saplings in HN group had a similarPnbut a lower leaf biomass than those in MN group (Fig.1 a and d),which indicated that the C supply via photosynthesis of the former was smaller than that of the latter.Meanwhile,the NSC pool of HN group was comparable to that of MN group (Fig.3 c).These results collectively suggested that the saplings under HN used less and stored greater proportions of NSC than those under MN.Our findings differed greatly from those of previous studies showing that plants lower their NSC storage in response to excessive N because more NSCs needed to be invested to the synthesis of proteins and amino acids (Cheng et al.2004;Ai et al.2017;Omondi et al.2019).This discrepancy might be attributed to the following three possible reasons.First,the excessive N addition in their experiment caused a more negative effect on the leaf photosynthesis than that in ours.For instance,the excessive N in the study of Omondi et al.(2019) resulted in a 30% decline inPnthan the optimal N,thus the assimilated C by their plants under excessive N might fail to meet the physiological demands.Second,HN in our study greatly promoted the concentration of the soil solution.Therefore,a certain level of NSCs was needed to increase the root osmotic pressure considering that NSCs were important substance for osmoregulation(Hartmann and Trumbore 2016).In agreement with this interpretation,saplings in HN group had higher NSC concentrations in their fine roots (Fig.2 m).Relatively,the plants in their experiments probably had no such a demand because of the much lower N addition in their experiments.Third,again because of the more intense N addition in our study,saplings under HN was likely suffered a heavier toxic stress,thereby having the incentive to stored greater NSCs to enhance the resilient to this kind of stress (Furze et al.2019).Moreover,we also detected a growth reduction of HN group compared with that of MN group (Fig.4),which was compatible with the decreased NSC consumption under HN.
Overall,our findings showed a trade-offin the NSCs investments between storage and new tissue growth under different N fertilization intensity.This result was consistent with the results of Manter et al.(2005),who reported a curvilinear relationship between N supply and tree growth,by which N addition exceeding the optimal dosage would decrease tree growth rates.
Seasonal fluctuation of NSC storage
We observed the seasonal oscillations of NSCs storage at the whole-plant level,regardless of the treatments applied(Fig.3).The soluble sugar pools were declined from January to April (Fig.3 a),which should due mainly to the fact that saplings in winter have more incentive to increase their cold tolerance by improving the sugar reserve (Ögren 1997).A notable increase in the soluble sugar pool occurred from April to October (Fig.3 a).Except for the enhancement in sapling biomass during this period,the larger soluble sugar storage in October could also result from the relatively dry climate in this month.Although the study site has plentiful rainfall,these precipitations are unevenly distributed over a year.We detected that the soil water content in October was much lower than that in the previous months in this year,and an increase in soluble sugar reserve in roots could help the saplings to obtain additional water (Hasibeder et al.2015).In agreement with this interpretation,the soluble sugar concentrations of roots were also dramatically enhanced from April to October (Fig.2 j,m).
The highest starch pool appeared in January,followed by a decline in April and October (Fig.3 b).These results were in line with Martínez-Vilalta et al.(2016) who claimed that evergreen conifers often accumulate starch in dormant season and consume it in later growth and metabolism depending on a global synthesis.A believable explanation for this phenomenon was that the low temperature in winter months resulted in a sink-limitation for plants (Bansal and Germino 2008);thus,more newly assimilated photosynthates by leaves had to be stored as starch to sustain the photosynthesis and phloem transport (Paul and Foyer 2001).This fluctuation of starch pool in our study differed greatly from those of a previous study showing that the starch pool of white pine(Pinus strobusL.),also an evergreen species,peaked in June(Furze et al.2019).This inconsistence can be partly owing to the fact that the temperature and further the photosynthesis in winter months in the ecosystem of Furze et al.(2019) are substantially lower than that in ours.
Furthermore,no interactions between N fertilization regimes and the date (season) were found on the NSC pools of these saplings (Fig.3 c).This finding suggested a tightly coupled response of C source and C sink to N addition over different seasons,considering that the NSC reserve fluctuated depending on the balance between C gain by canopy and demand for growth and respiration (the source-sink dynamics concept) (Martínez-Vilalta et al.2016).
Conclusion
We confirmed that the response of the NSC storage to N fertilization depended on N addition intensity.When the N addition intensity increased from LN to MN,thePodocarpus macrophyllussaplings tended to allocate more NSC to growth and less NSC to storage.However,when the N addition intensity increased from MN to HN,NSC was preferentially used for storage rather than growth,which could be attributed mainly to the negative toxicity effect of excessive N supply on plant physiology.Moreover,our results also provided evidence that the different seasons were not a factor that regulates the responses of whole-sapling NSC storage to N addition.Our study provided basic ecophysiological data in evaluating the performance of trees subjected to different N fertilization regimes.
AcknowledgementsWe thank Xiaoyan Su,Lingwen Wei,and Rongduo Wang for their invaluable assistance in the laboratory and field experiments.
 Journal of Forestry Research2021年4期
- Journal of Forestry Research的其它文章
- Flexible transparent wood enabled by epoxy resin and ethylene glycol diglycidyl ether
- A new species of Exoristobia (Hymenoptera:Encyrtidae)from China
- Larvicidal activity and microencapsulation of tobacco (Nicotiana tabacum) extract on Malacosoma neustria testacea larvae
- Resistance genes mediate differential resistance to pine defensive substances α-Pinene and H2 O2 in Bursaphelenchus xylophilus with different levels of virulence
- Investigation of beetle species that carry the pine wood nematode,Bursaphelenchus xylophilus (Steiner and Buhrer) Nickle,in China
- Termite-killing components in Serratia marcescens (SM1)
