
Behavior of alkali minerals in oxyfuel co-combustion of biomass and coal at elevated pressure#*
2021-02-07 09:22:02OrisCHANSAZhongyangLUOWennanZHANGChunjiangYU
Oris CHANSA, Zhong-yang LUO, Wen-nan ZHANG, Chun-jiang YU
Behavior of alkali minerals in oxyfuel co-combustion of biomass and coal at elevated pressure#*
Oris CHANSA1, Zhong-yang LUO†‡1, Wen-nan ZHANG2, Chun-jiang YU1
,,, China Department of Chemical Engineering,,,†E-mail: zyluo@zju.edu.cn
Combustion of biomass or coal is known to yield aerosols and condensed alkali minerals that affect boiler heat transfer performance. In this work, alkali behavior in the pressurized oxyfuel co-combustion of coal and biomass is predicted by thermodynamic and chemical kinetic calculations. Existence of solid minerals is evaluated by X-ray diffraction (XRD) analysis of ashes from pressure thermogravimetric combustion. Results indicate that a rise in pressure affects solid alkali minerals negligibly, but increases their contents in the liquid phase and decreases them in the gas phase, especially below 900 °C. Thus, less KCl will condense on the boiler heat transfer surfaces leading to reduced corrosion. Increasing the blend ratio of biomass to coal will raise the content of potassium-based minerals but reduce the sodium-based ones. The alkali-associated slagging in the boiler can be minimized by the synergistic effect of co-combustion of sulphur-rich coal and potassium-rich biomass, forming stable solid K2SO4at typical fluidized bed combustion temperatures. Kinetics modelling based on reaction mechanisms shows that oxidation of SO2to SO3plays a major role in K2SO4formation but that the contribution of this oxidation decreases with increase in pressure.
Oxyfuel co-combustion; Equilibrium calculations; Chemical kinetic reactions; Mineral’s identifications; Thermogravimetric combustion
1 Introduction
Co-combustion of coal and biomass not only directly reduces CO2emission but also cost- efficiently uses dispersed biomass resources in power generation (Chen et al., 2012; Tang et al., 2019). Biomass combustion alone poses a number of challenges, particularly its high content of alkali that is released during combustion and is deposited on heat exchange tubes leading to severe corrosion (Tillman et al., 2009). China, a huge agricultural nation, has about 72% of its total biomass resource as straw, with a significant contribution of corn stalk (Zeng et al., 2007). The use of corn stalk in power plants is limited mainly due to its higher potassium content, and there are other factors which make it less economical than coal, such as its lower calorific value, and higher handling and operational costs. Most of them are thus just subjected to open fire burning (Wang and Feng, 2004). On the other hand, coal constitutes the major fuel used in power generation especially in China and the USA (Chen et al., 2012). The Zhundong region, Xinjiang Uygur Autonomous Region has a coal field that is believed to be the largest in China with reserves estimated at >390 Gt (Zhou et al., 2010). Although low in ash and sulphur, combustion of Zhundong coal alone in power plants results in increased slagging in boilers due to its high sodium content (Zhou et al., 2013). For these reasons, efforts are being directed towards developing more effective usage of mixed Zhundong coal and corn stalk biomass. Co-combustion is a promising technology in that as it achieves synergistic changes in ash chemistry, emission, and ash deposition, and reduces the tendency to fouling (Munir et al., 2011; Bartolomé and Gil, 2013; Chansa et al., 2020).
Oxy-fuel combustion is important for realizing carbon capture and sequestration (CCS) for CO2emission reduction. In this process, a mixture of pure oxygen and a recycled flue gas is the oxidizer instead of air (Hong et al., 2009). When the oxy-fuel combustion furnace is pressurized, the combustion, heat transfer rates, and steam cycle for power generation are improved (Gazzino and Benelli, 2008; Hong et al., 2010). Hong et al. (2009) and Gopan et al. (2015), reported an increase of 3%–7% in net power plant cycle efficiency when pressure is raised by more than 10-fold. The key issue in the oxy-fuel co-combustion of coal and biomass under high pressure is the behavior of the alkali minerals present in the ash in their liquid and gas phases. The atmospheric co-firing release of potassium and sodium has been predicted by many studies based on equilibrium analysis and reports show that the release of potassium, sodium, and sulphur to the gas phase is suppressed by the interaction of biomass and coal ashes (Li et al., 2014; Wu et al., 2016). Temperature is a crucial factor in the formation of potassium compounds (Jokiniemi et al., 1994; Liao et al., 2012). In the boiler, alkali species are likely to be the significant aerosols condensing on the heat exchange tubes and will induce high- temperature corrosion while some remains in the residue as K2O·SiO2(s) and KAlSiO4(s) leading to increased slagging (Li et al., 2014). Heterogeneous nucleation of KCl on the surface of the heat exchanger is facilitated by the formation of K2SO4nuclei first on which KCl then condenses (Christensen et al., 1998). An alkali chemistry mechanism and the basis of studying alkali aerosols in coal fired boilers to address deposition and corrosion are available (Hynes et al., 1984).
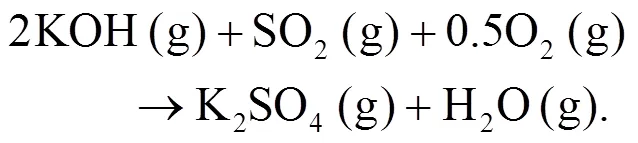
Srinivasachar et al. (1990) developed a kinetic model for predicting the concentration of gaseous alkali. Glarborg and Marshall (2005) identified a plausible mechanism for the formation of alkali species and updated their high temperature gas- phase thermochemistry data bank. Most alkali metal compounds such as halides and hydroxides are polar and display strong gas phase ionic characteristics with very fast reactions owing to their attractive forces. Molecule-molecule reactions are mainly due to dipole-dipole induced dipole moment interactions while diatom-atom reactions may transfer electrons as described in Eqs. (1)–(3). The reaction of NaOH and HCl is highly exothermic (Ager III and Howard, 1987).


The object of this study is to understand the behavior of condensed and aerosol phase alkali minerals in the high pressure oxy-fuel co-combustion of coal and biomass. So far, little information on this topic exists in the literature. Such information may be helpful in the scaling-up of coal and biomass co- combustion mainly in fluidized-bed but also in pulverized-coal fired boilers in the power industry.
2 Properties of investigated coal and biomass
Corn stalk biomass and Zhundong lignite coal from Xinjiang Uygur Autonomous Region, China are used in this study. The fuel samples are first dried in an oven at 105 °C for 24 h and later pulverized in a mill grinder and ball mill respectively. Proximate and ultimate analyses results are given in Table 1.
The fuel ash in Table 2 is produced at 850 °C in a horizontal tube combustor under oxy-fuel conditions and a residence time of 15 min and is analyzed with X-ray fluorescence (XRF) for oxide contents. The distribution of the nature of their alkalis is given in Table 3 (Chansa et al., 2019). Biomass is pulverized to fineness of less than 250 μm and coal to 90% passing 100 μm sieve (Skinner et al., 2006). The coal particle size suits industrial boiler requirements (Pronobis et al., 2017). Potassium and sodium are analyzed by a fractionation method (Chansa et al., 2019).
3 Ash analysis
3.1 High pressure thermogravimetric analysis
The influence of pressure and the blending ratio on fuel alkali minerals under oxy-fuel conditions is investigated. Biomass and coal are mixed at blend ratios (biomass/(biomass+coal)) of 20% and 30% on an energy basis, respectively. The fuels and their blends are used as the feedstock samples to the high pressure (Cahn Thermax 500) thermogravimetric analyzer (PTGA) (Thermo Fisher Scientific Cooperation, USA) as shown in Fig. 1. This system and process description is as given by Cahn Thermax, and the only modification is the inclusion of O2and CO2gas cylinders indicated in the dashed section.
The sample weight is limited to (50±0.01) mg. The reference gas for combustion is taken from gas cylinders of O2and CO2with a mixing ratio of 80:20 in volume and flow rate of 100 mL/min. The temperature is raised constantly at a heating rate of 25 °C/min until the designated temperatures of 800, 850, and 950 °C are reached for each test under atmospheric pressure and then later at 0.5 MPa. The ashes are cooled in a N2environment and later their mineral contents are determined by X-ray diffraction (XRD) and scanning electron microscope/energy dispersive spectrometer (SEM/EDS) analyses.
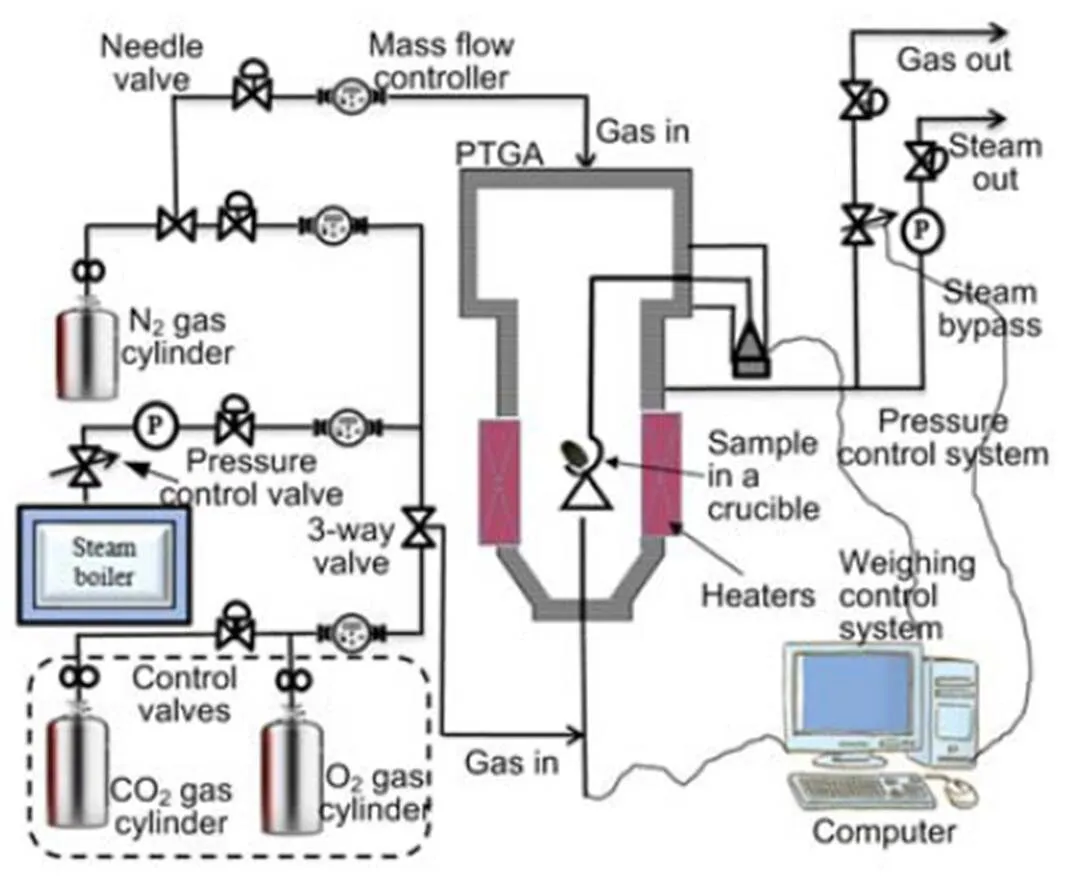
Fig. 1 High pressure (Cahn Thermax 500) thermogravimetric analyzer (PTGA) system
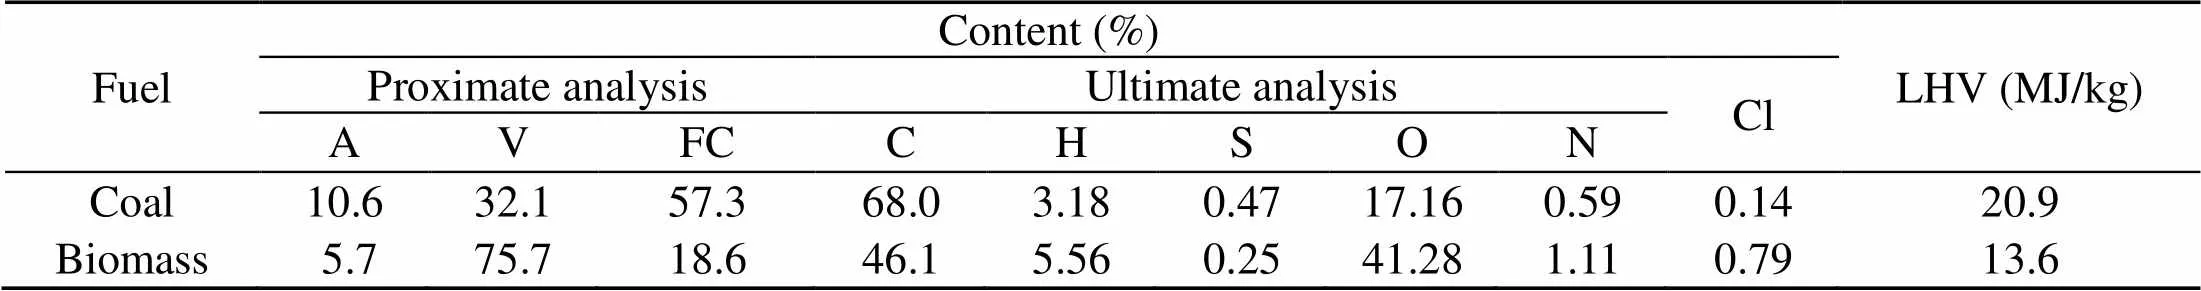
Table 1 Proximate and ultimate analyses for the 100% fuels
A, V, and FC mean ash, volatile, and fixed carbon, respectively;O%=1−(C%+H% +N%+S%+A%); LHV is the low heat value; oxygen obtained by difference; Cl is analyzed by ion chromatography (IC) method
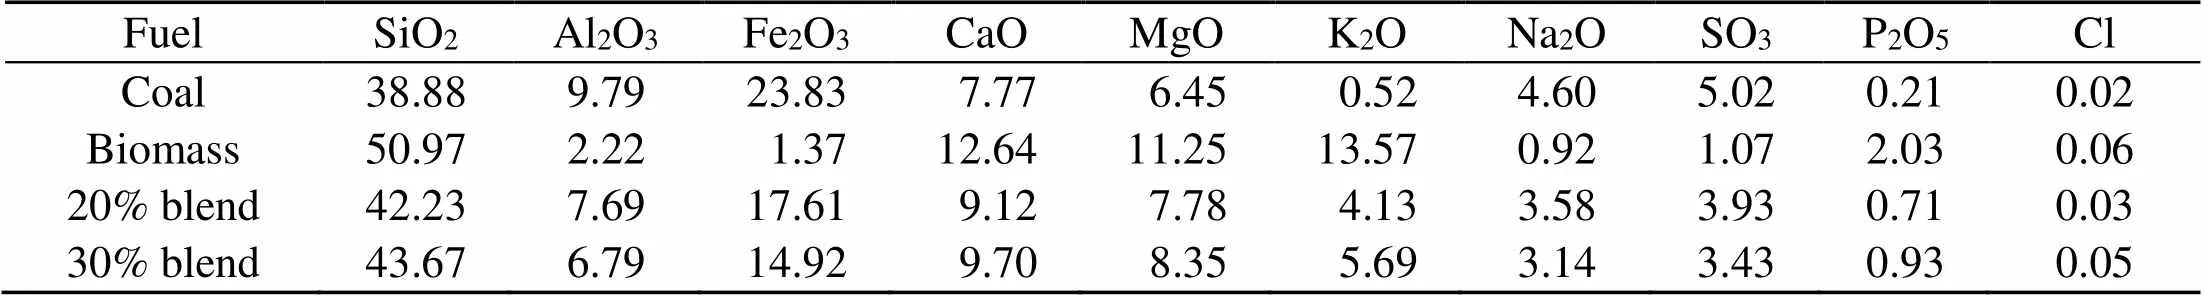
Table 2 X-ray fluorescence (XRF) ash oxide content analyses (%)
Cl is analyzed by IC method
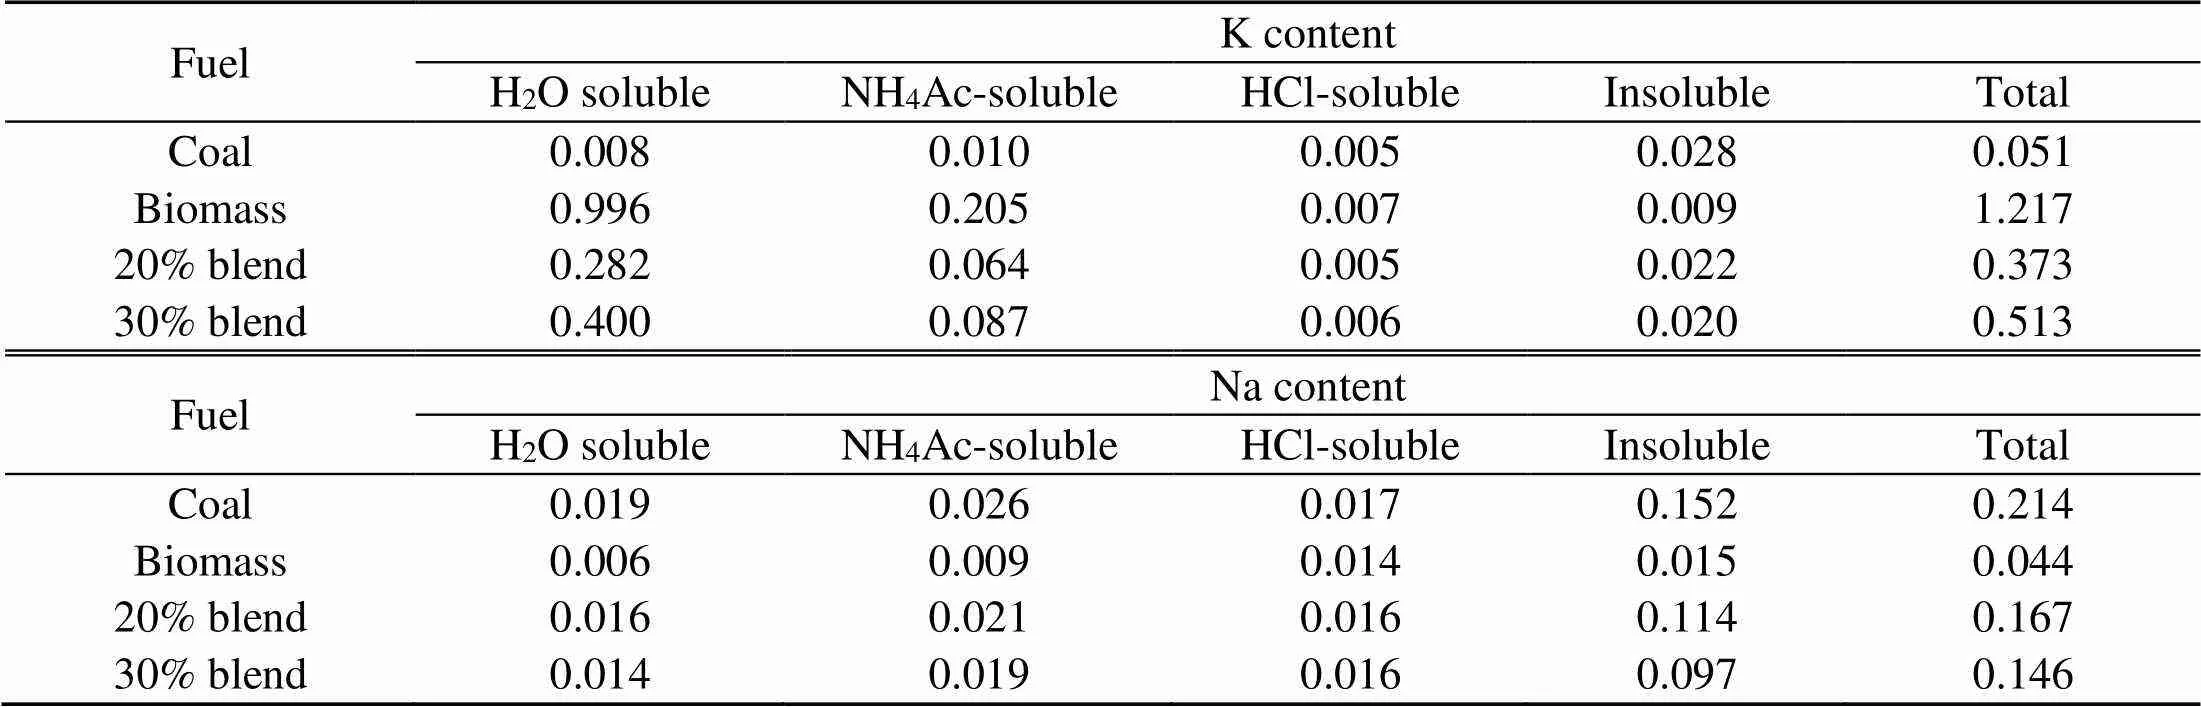
Table 3 Nature of alkali contained by chemical fractionation using the ICP-AES method (%, in weight, dry basis)
ICP-AES: inductively coupled plasma-atomic emission spectrometer
3.2 Ash properties
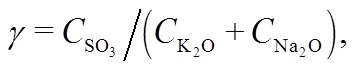
The combustion ashes are also analyzed for oxide and chloride composition (Silva et al., 2014). Table 2 shows the weight percentages from XRF analyses of the oxides and ion chromatography analyses of the chlorides in the fuel ashes. The slagging and fouling tendencies of the fuel ashes are evaluated with the help of information from Table 2 and are indicated in Table 4 (Munir et al., 2011). The slagging,, fouling, and viscosityindices show that the slagging tendency for coal is higher than that for biomass. Biomass shows a greater fouling tendency. On the other hand, the indices for the 20% and 30% blends show an inclination towards lower fouling and slagging.
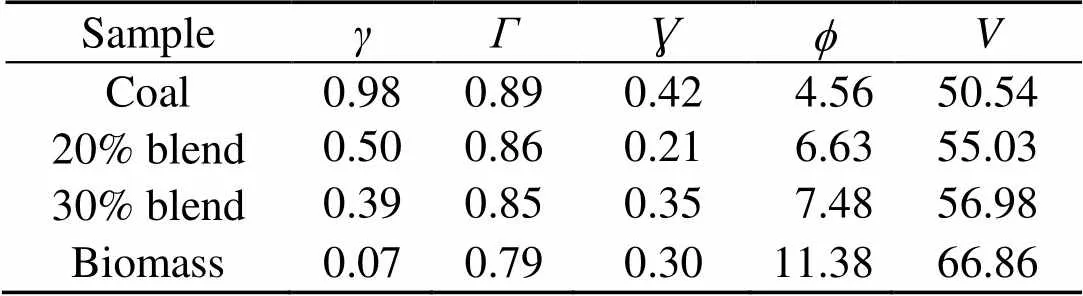
Table 4 Assessment of slagging and fouling tendencies of the fuel ash at 0.1 MPa
3.3 XRD and SEM/EDS analysis of the ash
An SEM with an electron acceleration voltage set to 25.0 kV at magnification of 2000 is used to observe the surface topography of the ash. SEM reviews the surface topography of ashes at 850 °C under pressures of 0.1 MPa and 0.5 MPa as shown in Fig. 2. The distinct ash structures show whitish and flake mineral formation clinging to the surface of crystalline minerals, especially for coal. As the blend ratio increases, more flake minerals appear, obscuring the crystalline structures as shown in Fig. 2 (blends). Ash samples are also exposed to a spot electron beam in the EDS (Wu et al., 2011). The EDS elemental characteristics of the X-ray energy spectrum were analyzed and expressed as an average percentage (in weight) of specific elements for 10 well-spaced spots on a particular ash sample, as shown in Fig. 3. The flake minerals given in Fig. 2 are presumed to be potassium-based alkalis because biomass is richer in K-based alkali minerals than coal. This is confirmed by the EDS results in Fig. 3, showing that the concentration of potassium increases with an increasing blend ratio while that of sodium decreases.
An XRD machine set in continuous scan mode for diffraction angles in the range of 2from 5° to 90° is used to obtain powder diffraction data for the mineral phases. The resulting powder diffraction data are further processed with JADE 6.0 software to obtain the most abundant minerals by matching. To quantify the crystalline phase in the samples, the percentage of crystallinity was defined by
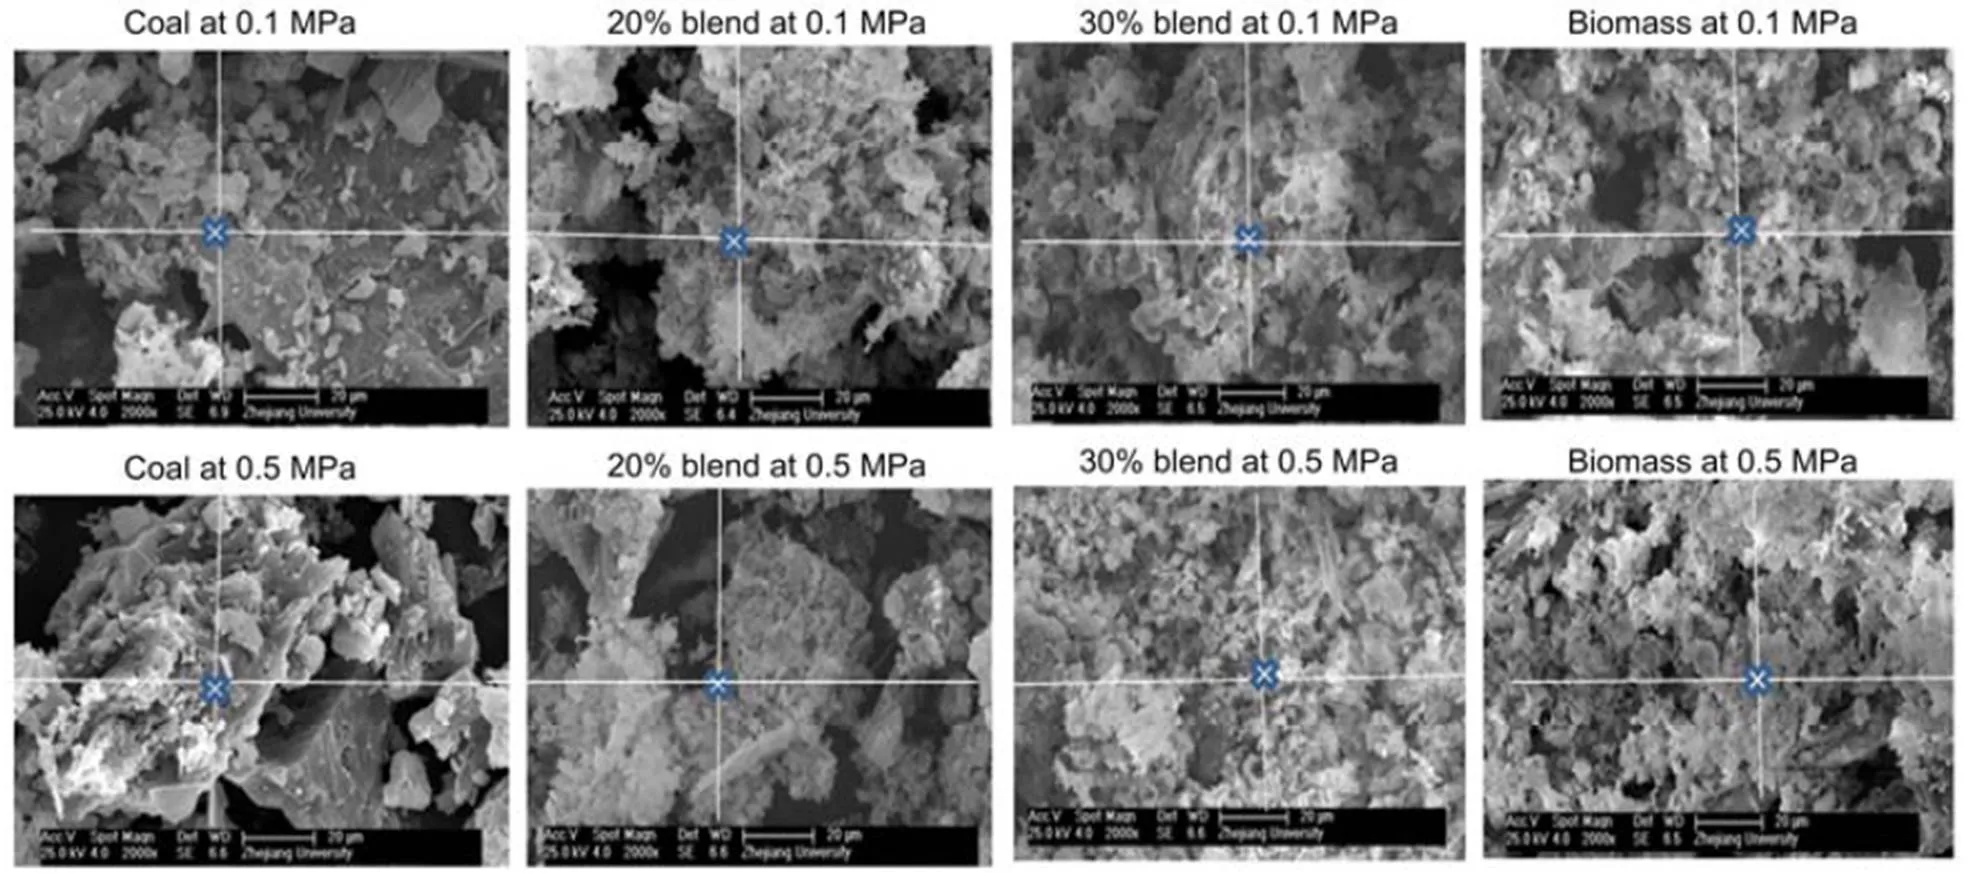
Fig. 2 SEM images of coal, 20% blend, 30% blend, and biomass under 0.1 and 0.5 MPa at 850 °C, respectively
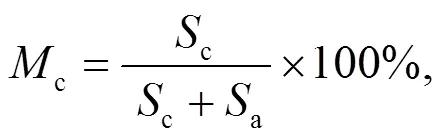
where Mc is the percentage of crystalline phase, and Sc and Sa are the areas of crystalline peak and amorphous peak, respectively. The crystalline phases were considered as the ones with narrower and higher intensities than amorphous phases (Yan et al., 2018). The peak areas are obtained by peak integration in Origin 9.0 as illustrated in Fig. S1 and Table S1 in the supplementary material. The calculated crystallinities for the 30% blend sample at 0.1 MPa and 0.5 MPa were 67.4% and 56.6%, respectively. This result indicates that an increase in pressure reduces the percentage of crystallinity in the sample although more results are needed to confirm that. The XRD results for 30% blend ash at 850 °C and at 0.1 and 0.5 MPa are presented in Fig. 4a, showing mineral contents as an example. XRD diffraction patterns for 20% and 30% blends ash at various temperatures are converted to a weight percentage of mineral distribution for the most matched minerals, which are plotted against temperature as shown in Figs. 4b and 4c.
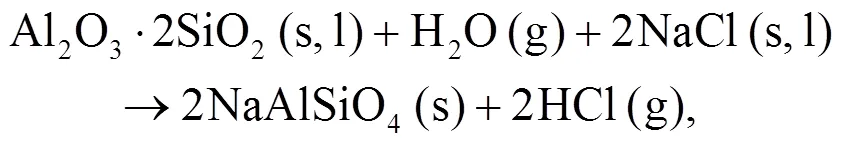
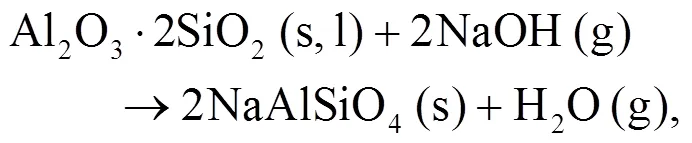
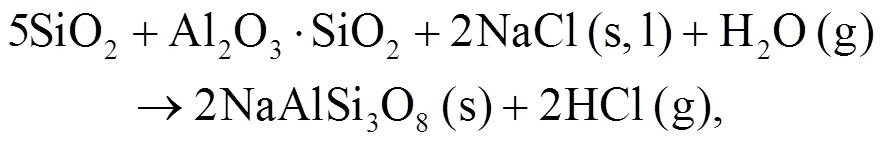
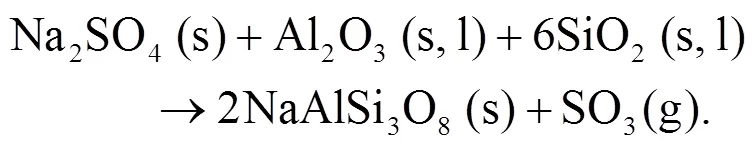
It can be seen that alkali mineral formation and distribution depend strongly on temperature and blend ratio. From XRD analyses, alkali minerals are identified as sodium- and potassium-based compounds. The formations of NaAlSiO4(s) and NaAlSi3O8(s) are achieved by the interaction of Na-Si-Al minerals with Cl/O/H/S as shown in Eqs. (5)–(8) (Vamvuka and Kakaras, 2011; Liu et al., 2018):
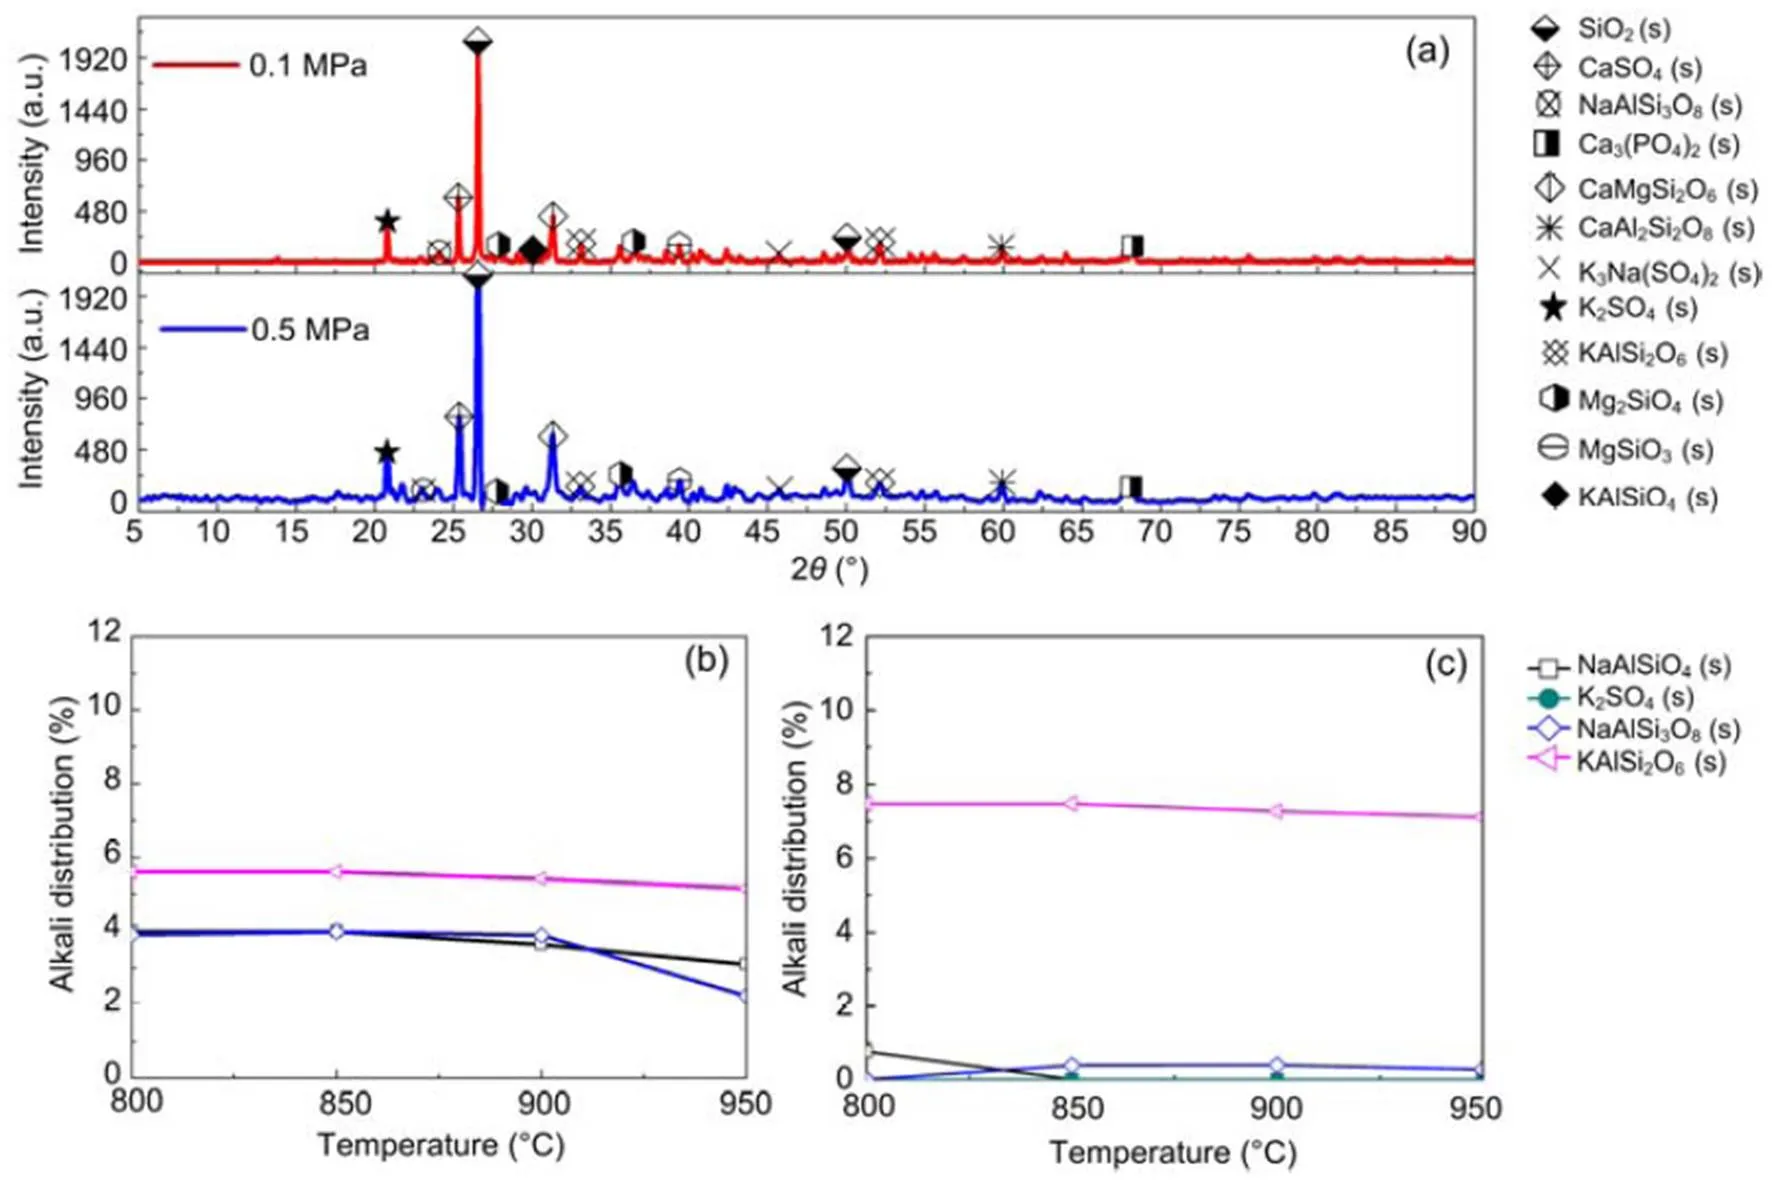
Fig. 4 XRD alkali mineral for 30% blend (a) and alkali distributions for 20% blend (b) and 30% blend (c)
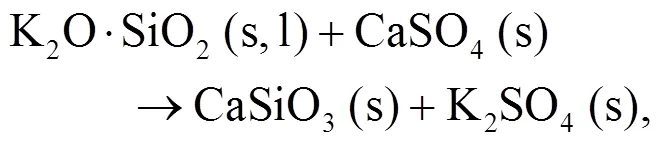
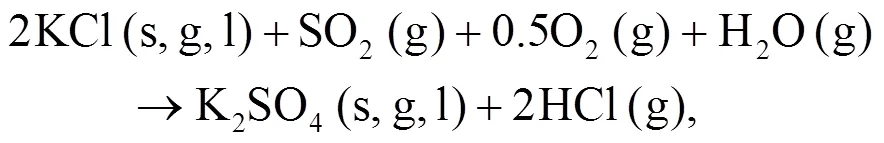
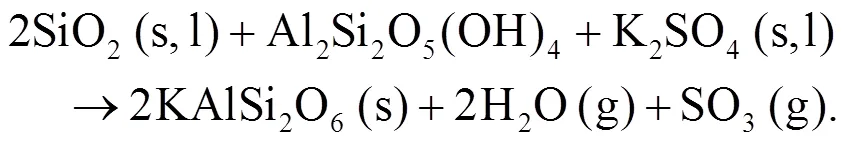
As shown in Figs. 4b and 4c, we can find more KAlSi2O6(s) than NaAlSi3O8(s) and NaAlSiO4(s) for 30% compared with 20% blend ash. K2SO4(s) is visible only in the 30% blend ash. In the range 400–1000 °C, the formation of K2SO4(s) is achieved by the interaction of K2SiO3and CaSO4as given by Eq. (9) (Xue et al., 2017). K2SO4(s) can also be formed by the sulfation of KCl in the presence of oxygen as in Eqs. (10) and (11) (Hansen et al., 2000; Zheng et al., 2007):
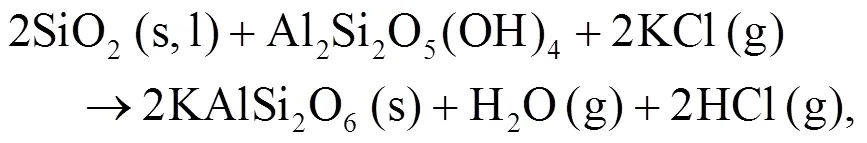
Oris et al. (2019) identified KAlSi2O6(s) as bound in the matrix and it is the most abundant alkali mineral in all biomass-coal blend ashes at 850°C. KAlSi2O6(s) can form from silica, kaolinite, and KCl as shown in Eqs. (12) and (13) (Steenari and Lindqvist, 1998):
4 Modeling and predictions
4.1 Equilibrium calculations

whereis the content.
4.2 Modeling of gaseous elementary reactions
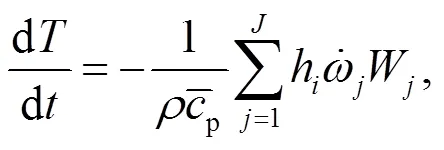
To understand the behavior of gaseous alkali compounds during oxy-fuel co-combustion of biomass and coal, a numerical model based on Chemkin is employed to solve the governing Eqs. (15) and (16) in the case of the cylindrical plug flow reactor presented in Fig. 1.

4.3 Alkali components in the ash
Table 3 indicates that the majority of alkalis in coal are bound in the matrix as insoluble. The equilibrium prediction results for the coal ash are presented in Fig. 5. Both the sodium and potassium minerals exist as solid, liquid, slag, or eutectic mixture, in agreement with other work (Liu et al., 2018). NaCl(l) and Na2SO4(g) in the coal ash are neglected. Na2SO4(s) turns to the liquid phase at about 850 °C which is the typical operating temperature for coal fluidized bed combustion. A slight shift over 850°C may give rise to a significant content of Na2SO4(l). As predicted in the present ash model, other reports on Zhundong coal combustion agree that NaCl(g) is the main sodium species volatized in the gas phase (Li et al., 2016).
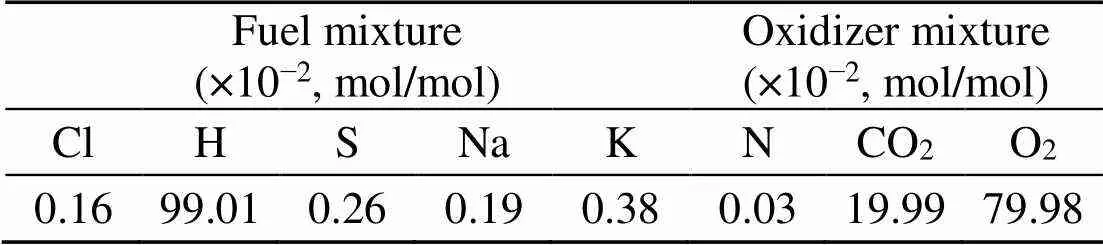
Table 5 Conditions considered for kinetic modeling of alkali compounds
Cl, Na, and K are chlorides, sodium, and potassium available for gas phase as obtained by difference between fuel and ash contents. Cl, Na, and K in the ash and fuel are obtained by a chemical fractionation procedure. N, S, and H are fuel nitrogen, sulfur, and hydrogen available for the gas phase. CO2and O2are obtained from volumetric flow settings to maintain oxy-fuel combustion
Biomass, however, shows the presence of the dominant K-based species as indicated in Fig. 6 and occurring mainly in water soluble compounds as shown in Table 1. This is in agreement with other studies (Steenari and Lindqvist, 1998; Liao et al., 2015). The K2Si2O5(K2O·2SiO2) content in the liquid phase is fairly low and can easily be transformed into a more stable eutectic compound, K2Si4O9(s, l) or K2O·4SiO2. K2Si4O9(l), which is present as a liquid above a low temperature of 760 °C, causes severe problems of ash agglomeration and slagging in biomass furnaces. That K2SO4(g) and KCl(g) are the main inorganic vapor from biomass flue gas is also indicated in other reports (Wiinikka et al., 2007).
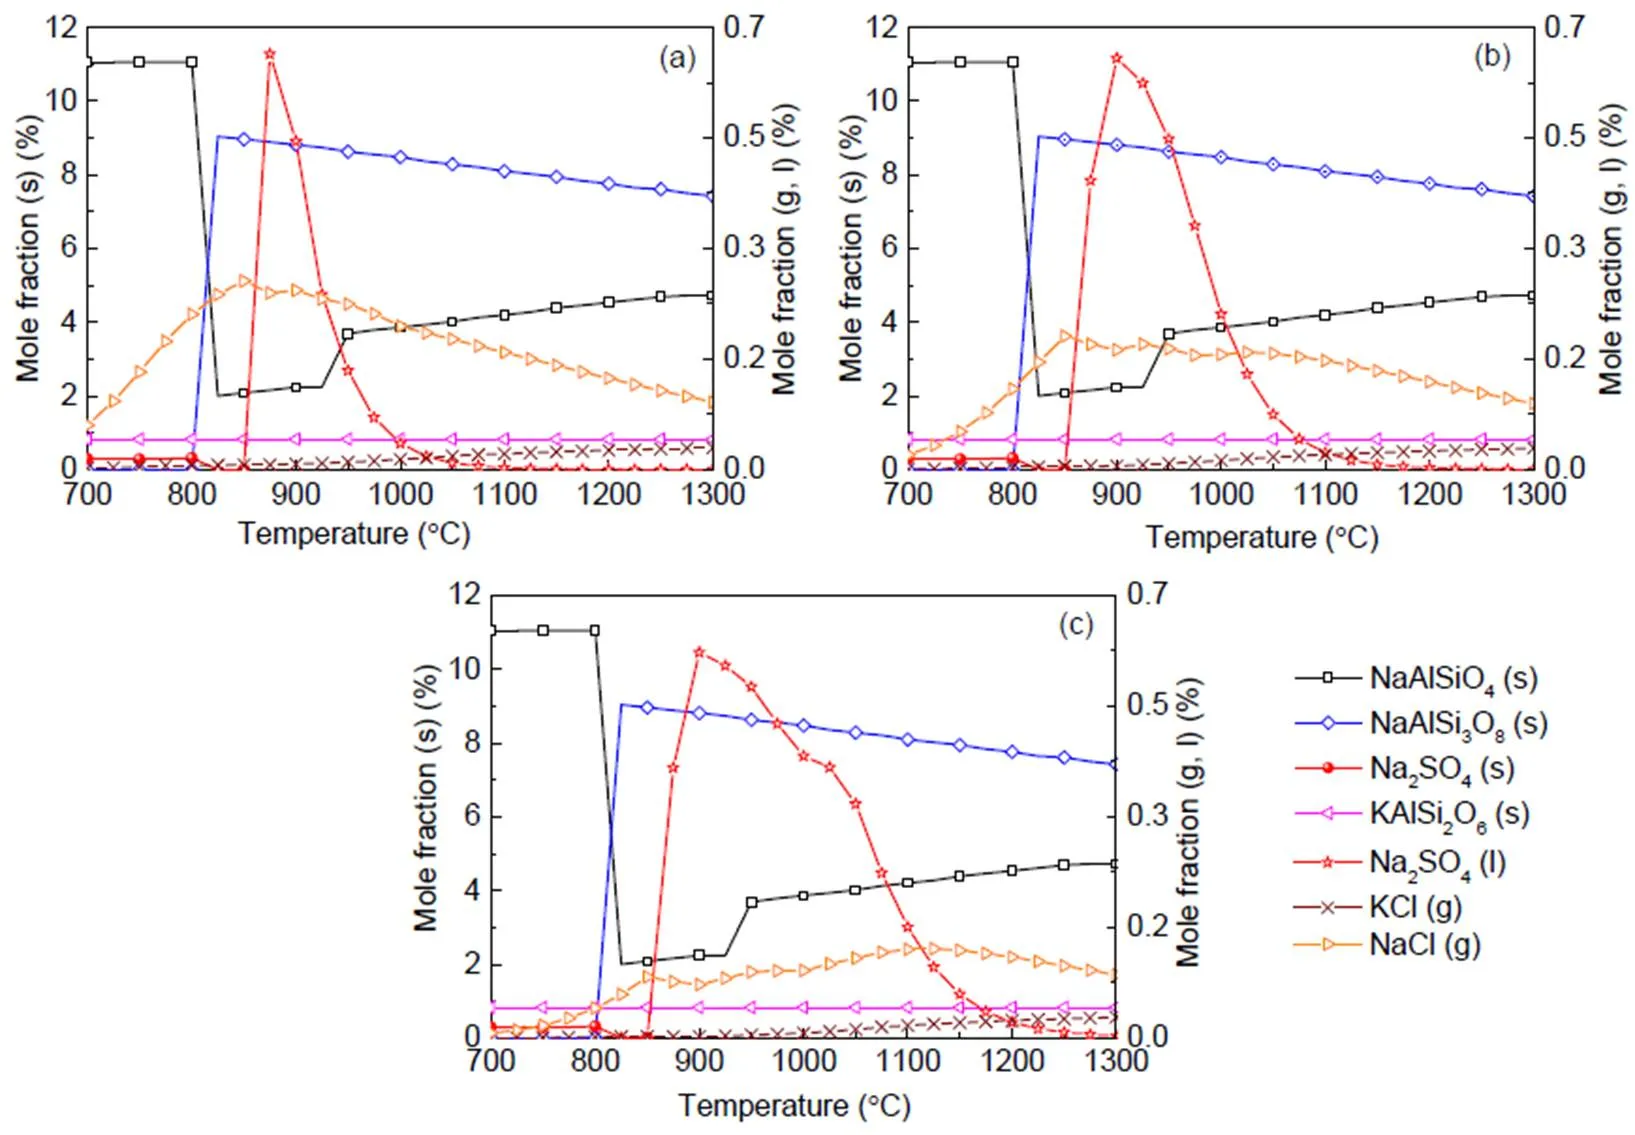
Fig. 5 Equilibrium predictions of K and Na minerals for coal under pressures of 0.1 MPa (a), 0.5 MPa (b), and 2.5 MPa (c), respectively
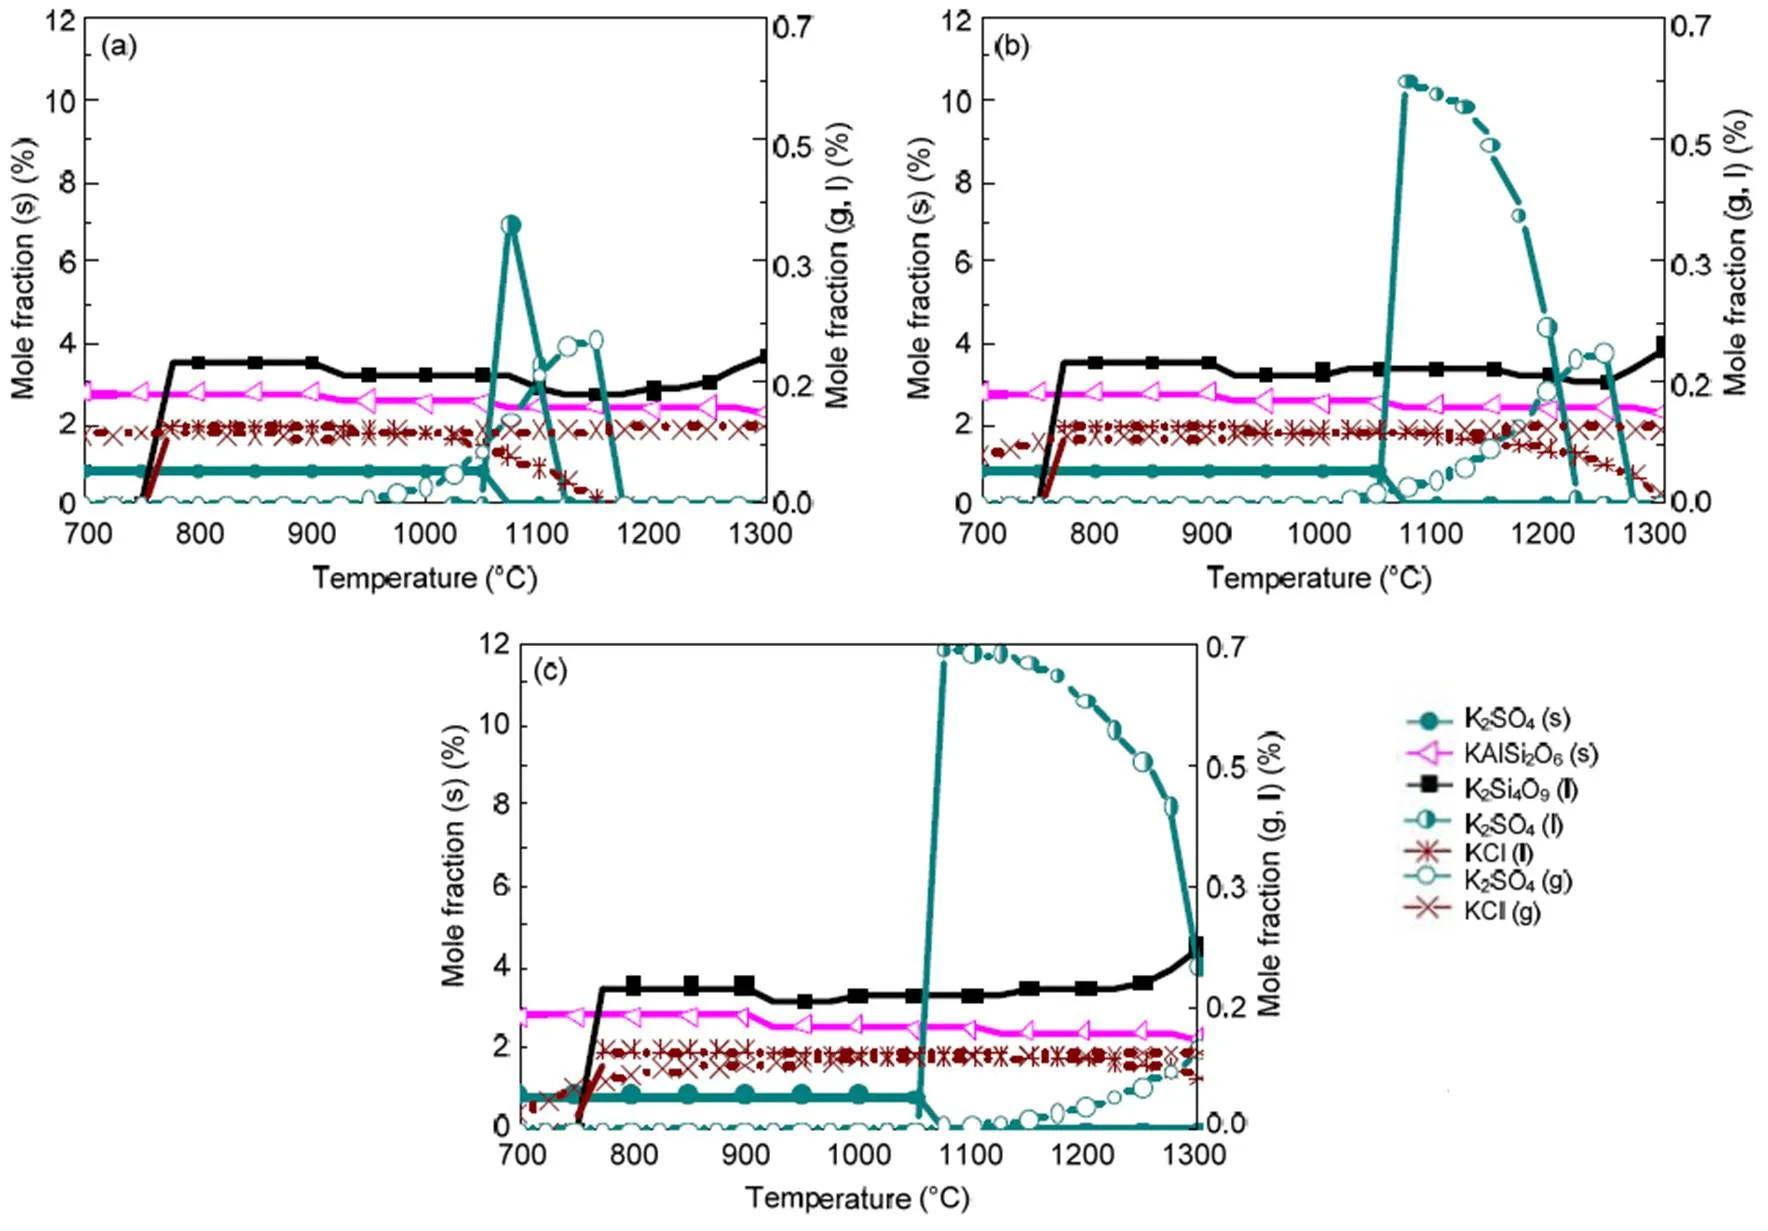
Fig. 6 Equilibrium predictions of K and Na minerals for biomass under the pressures of 0.1 MPa (a), 0.5 MPa (b), and 2.5 MPa (c), respectively
When coal and biomass are mixed, synergistic effects appear as shown in Figs. 7 and 8 for the 20% and 30% blends. A rise in blend ratio decreases the sodium-based minerals but increases the potassium- based minerals. For example, as the blend ratio increases from 20% to 30%, the maximum amount of NaAlSi3O8(s) reduces by 90% (from 4.5% to 0.4%), while KAlSi2O6(s) increases by 35% (from 6.3% to 8.5%). This is expected from the feedstock biomass which has much lower Na2O and much higher K2O content in its ash compared with coal ash (Table 2). In the 20% blend ash as shown in Fig. 7, K2Si4O9almost disappears, possibly replaced by KAlSi2O6(s), so that the ash agglomeration problem in the combustion application is mitigated by the synergetic effect of coal and biomass co-combustion. The gaseous potassium and sodium minerals considered in this study that may change the fly ash characteristics and ultimately affect the heat transfer performance of boilers are K2SO4(g), KCl(g), and NaCl(g). For the 30% blend ash, K2SO4(s) exists in the solid phase at temperatures up to 1070 °C above which it shifts to the gas phase as shown in Fig. 8 (0.1 MPa). The shift is clearer under higher pressure when it is in favor of liquid formation instead of gas. For biomass combustion, KCl(g) holds a high concentration level over a wide temperature range even down to 750 °C as shown in Fig. 6, but a much lower level for the 20% and 30% blends ash as in Figs. 7 and 8.
This suggests that KCl(g) may be significant in the gas phase under typical combustion conditions, while K2SO4(g) concentration is very much limited at temperatures below 1050 °C. As a result, less KCl(g) in thermo-chemical conversion will be condensed on the boiler heat transfer surface, and thus KCl- associated deposition, fouling and corrosion can be minimized by co-combustion of biomass and coal. In comparison to KCl(g), NaCl(g) is much lower as the blend ratio increases, which is shown in Figs. 7 and 8 at 2.5 MPa. For example, in a 30% blend, at 0.1 MPa and 1000°C, KCl (g) is released as high as 0.072%, while only 0.032% of NaCl (g) is released. It is observed that KCl (g) is reduced by 47% from biomass to 30% blend as shown in Figs. 6 and 8.
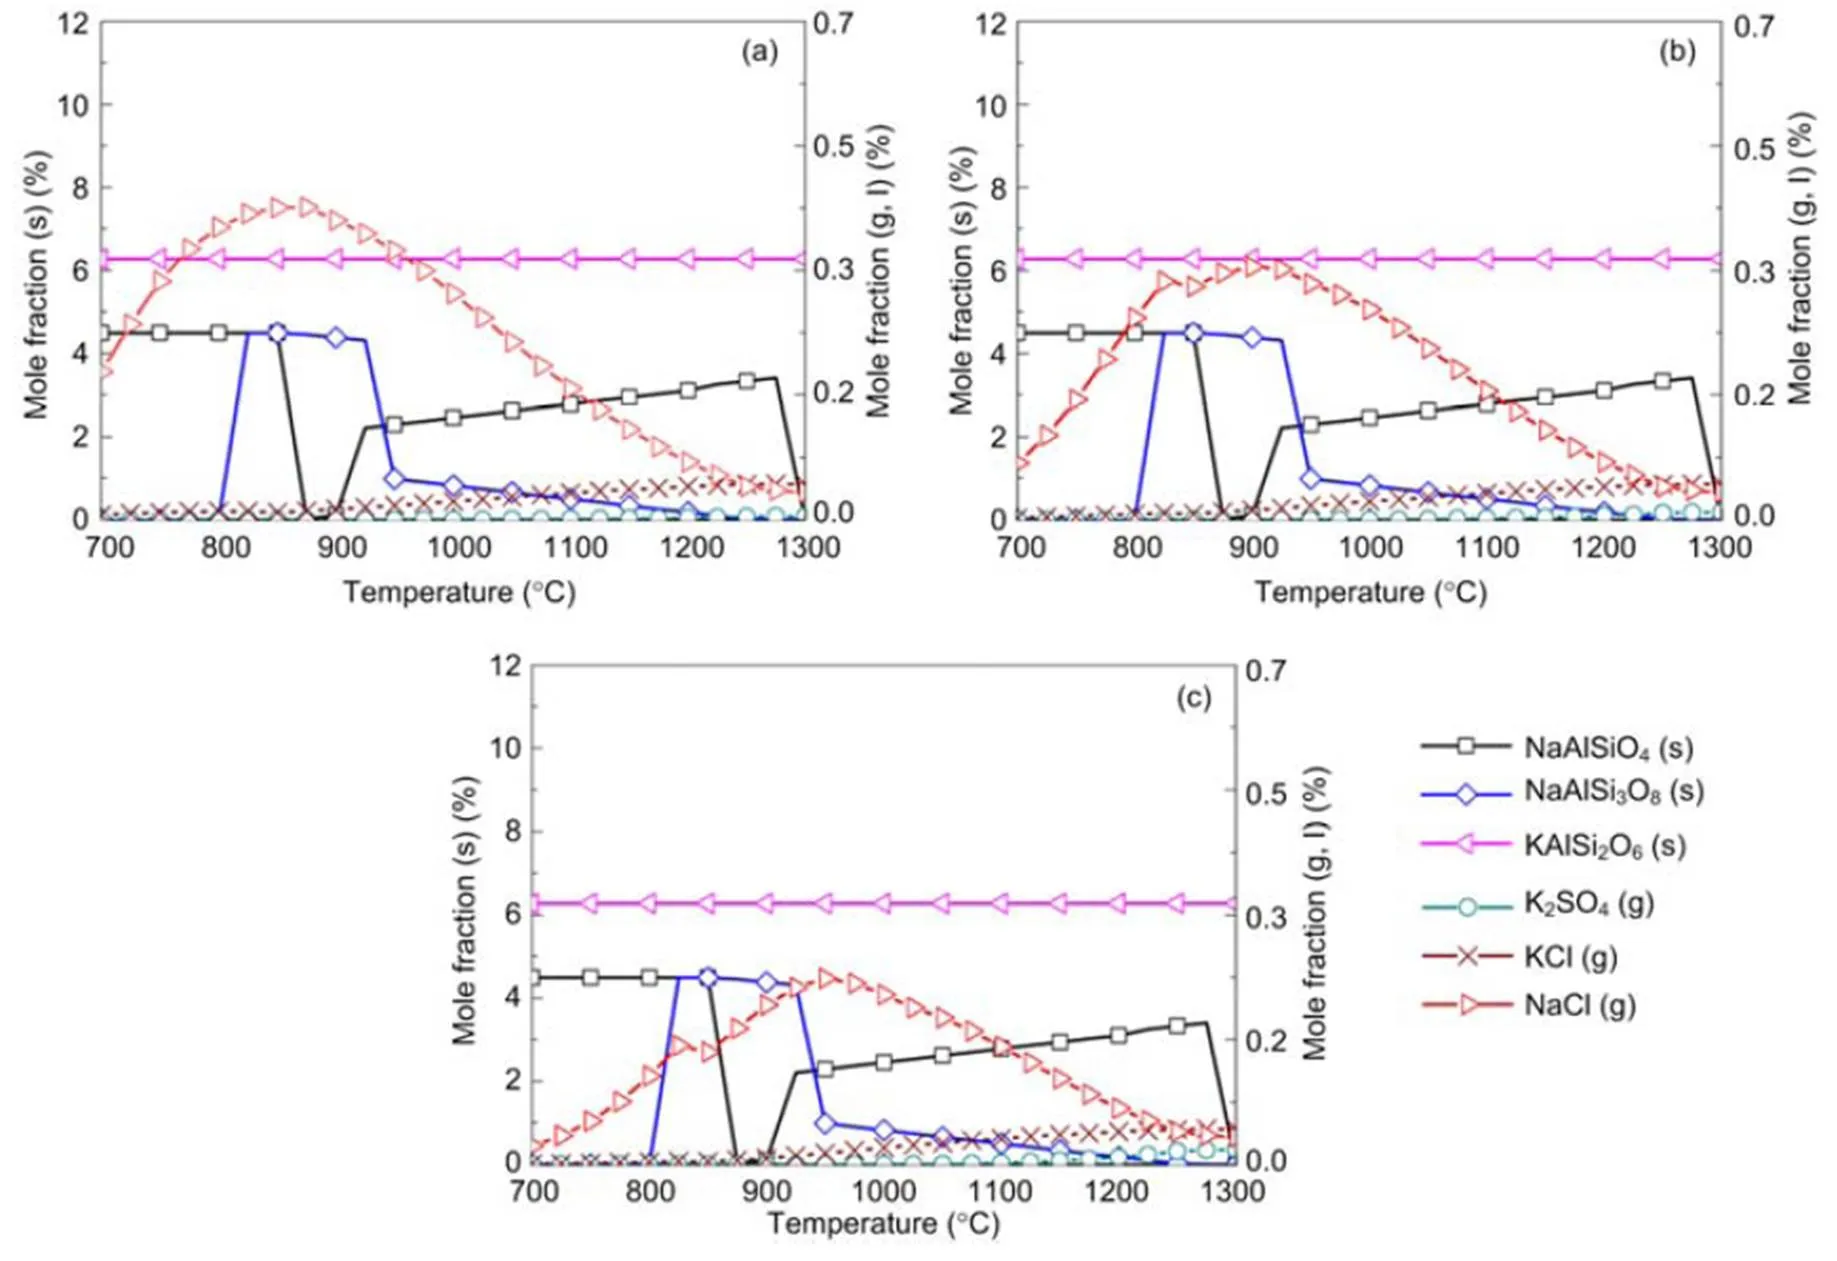
Fig. 7 Equilibrium predictions of K and Na minerals for the 20% blend under the pressures of 0.1 MPa (a), 0.5 MPa (b), and 2.5 MPa (c), respectively
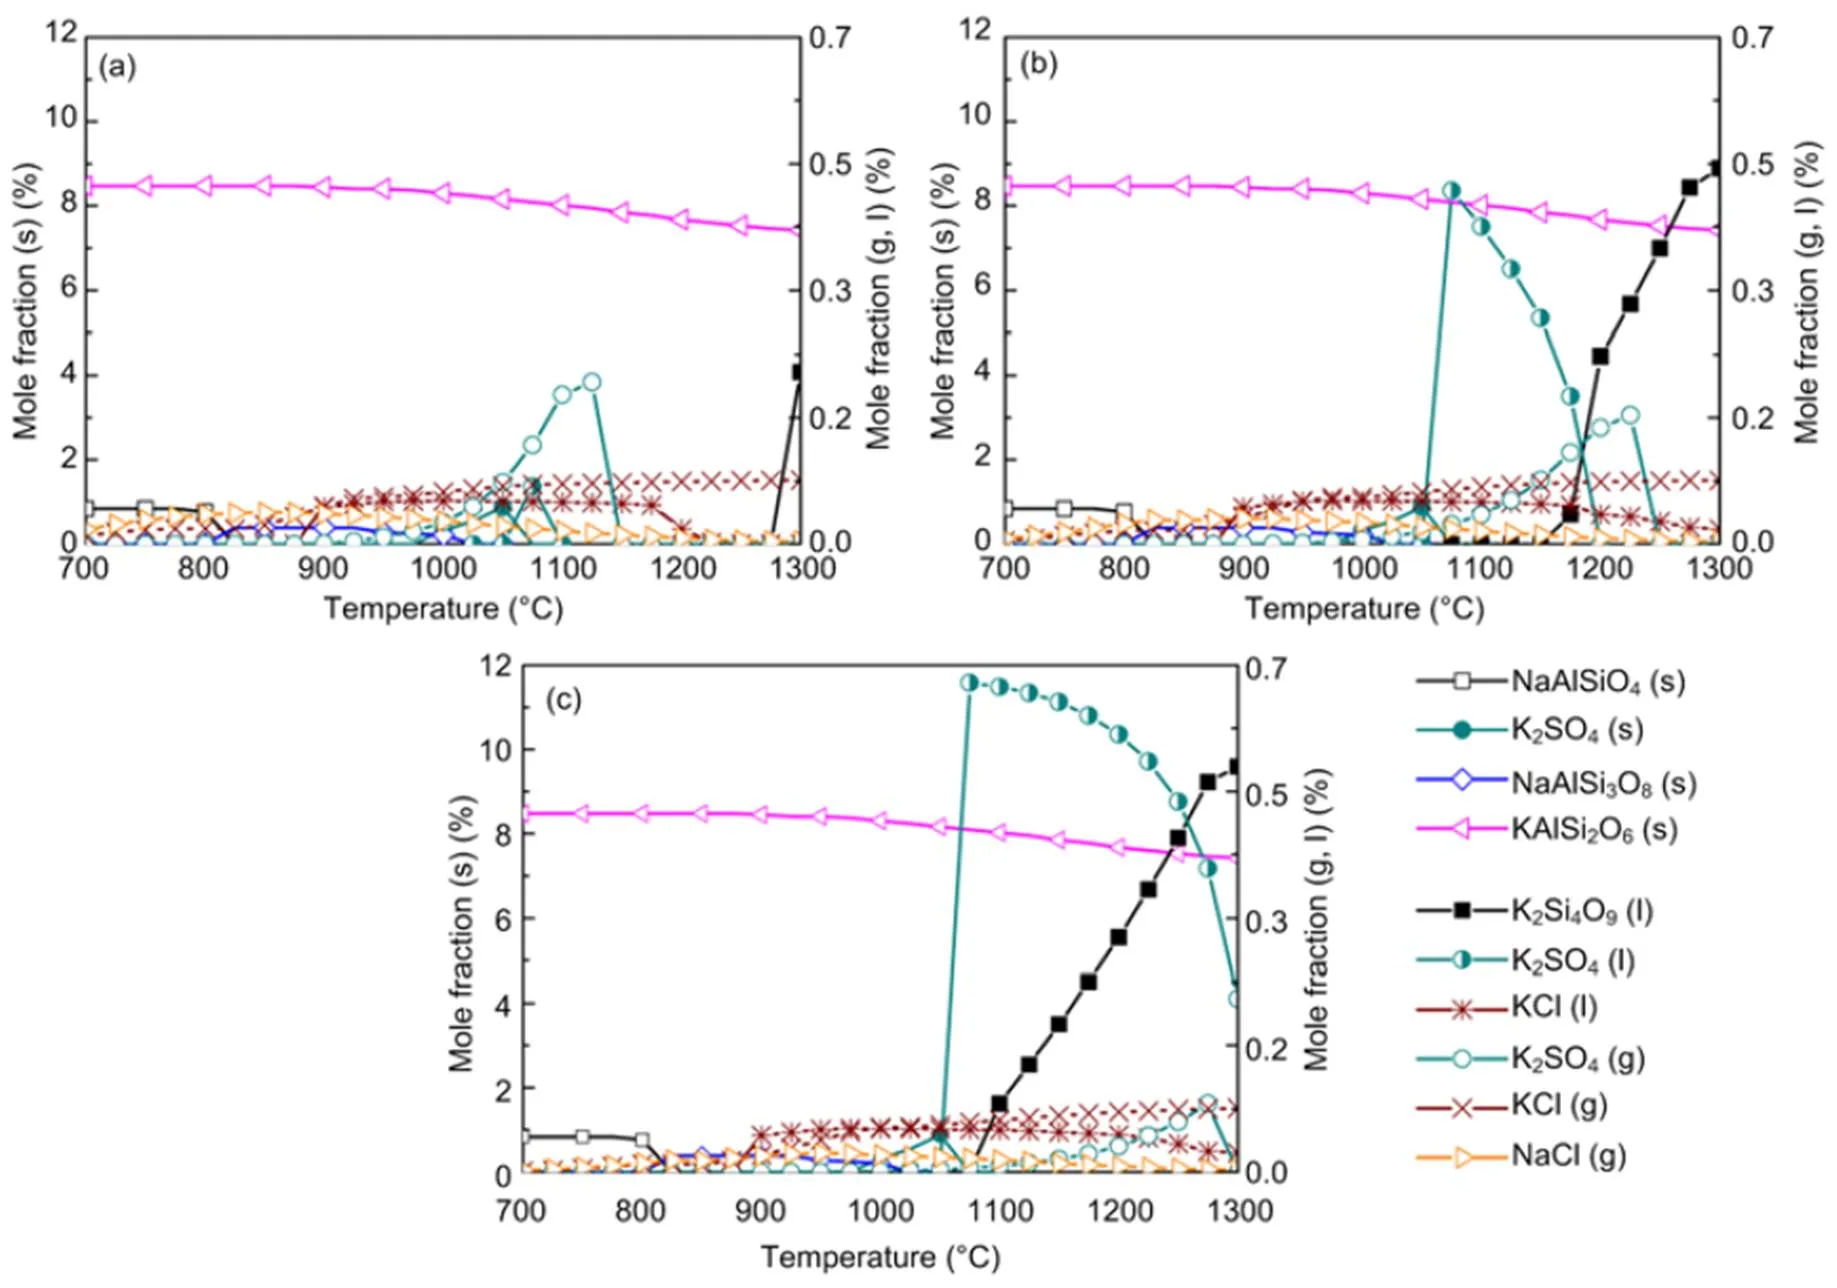
Fig. 8 Equilibrium predictions of K and Na minerals for the 30% blend under the pressures of 0.1 MPa (a), 0.5 MPa (b), and 2.5 MPa (c), respectively
To further understand this behavior in the gas phase, the sulfur to alkali ratio,, as defined in Table 4, is used. From biomass to 30% blend at 0.1 MPa and 900 °C,increases from 0.07 to 0.39. This increment leads to limited evolution of NaCl (g) and KCl (g) as in Fig. 8 and is in agreement with other reports (Yang et al., 2011). In reality, the co-combustion of potassium-rich biomass and sulfur-rich coal has an advantage over coal or biomass alone with respect to the fluidized-bed or pulverized-coal fired operation and maintenance. Based on the computation temperature range of 700–1300 °C in this work, the results are expected to be applicable mainly to fluidized-bed and partly to pulverized-coal fired that can operate at even higher temperatures than the range considered.
4.4 Transformation of gaseous alkali compounds
For a 30% blend, Fig. 9 shows the kinetic model prediction results by means of the Chemkin calculation for some gaseous alkali species that may significantly impact on boiler heat transfer tubes by ash deposition, fouling, and corrosion. It can be observed that the formation and distribution of gaseous alkali species are greatly dependent on temperature and pressure. Results indicate a reduction in amount of KCl(g) and NaCl(g) with rise in pressure, especially at temperatures lower than 900 °C. The kinetic model prediction shows higher concentration of gaseous alkali species than equilibrium calculations do. However, the predictions from the two models show closer results in the case of KCl(g) at the higher pressure of 2.5 MPa.Owing to the computation temperature range of 700–1300°C in this work, the results are more applicable to fluidized-bed than to pulverized-coal fired combustion because the latter can operate even at temperatures higher than the range considered. The pathways for the formation of K2SO4, Na2SO4, KCl, and NaCl from intermediate species are presented in Figs. 10 and 11 from Chemkin reaction mechanisms. The schematic diagrams are arranged in hierarchy of species formation from bottom to top. Generally, potassium-based compounds are formed in preference to sodium- based ones. As shown in Fig. 10a, the formation of K2SO4can be achieved by three possible pathways: (i) KSO3+KOÛK2SO4, (ii) KSO2+KO2ÛK2SO4, and (iii) KSO3Cl+KOHÛK2SO4+HCl.On the other hand, Na2SO4also has three possible formation routes:(iv) NaHSO4+NaClÛNa2SO4+HCl, (v) NaSO2+ NaO2ÛNa2SO4, and (vi) NaSO3Cl+NaOHÛNa2SO4+HCl. The oxidation of SO2to SO3appears to play a major role. That is in agreement with another research (Iisa et al., 1999), which identified it as a rate-limiting step. As the pressure rises to 0.5 MPa, K2SO4is only produced from the two major routes of (vii) and (viii) similar to (ii) and (iii), and more H2O (g) is produced from KOH (Fig. 10b). At 2.5 MPa in Fig. 10c, K2SO4is formed by a single major step of (xvi) KSO2+KO2ÛK2SO4. (xvi) KSO2+KO2ÛK2SO4requiring O2and the oxidation of SO2to SO3may play a role but its effect may be reduced. However, the production routes for Na2SO4at higher pressure remain unchanged.
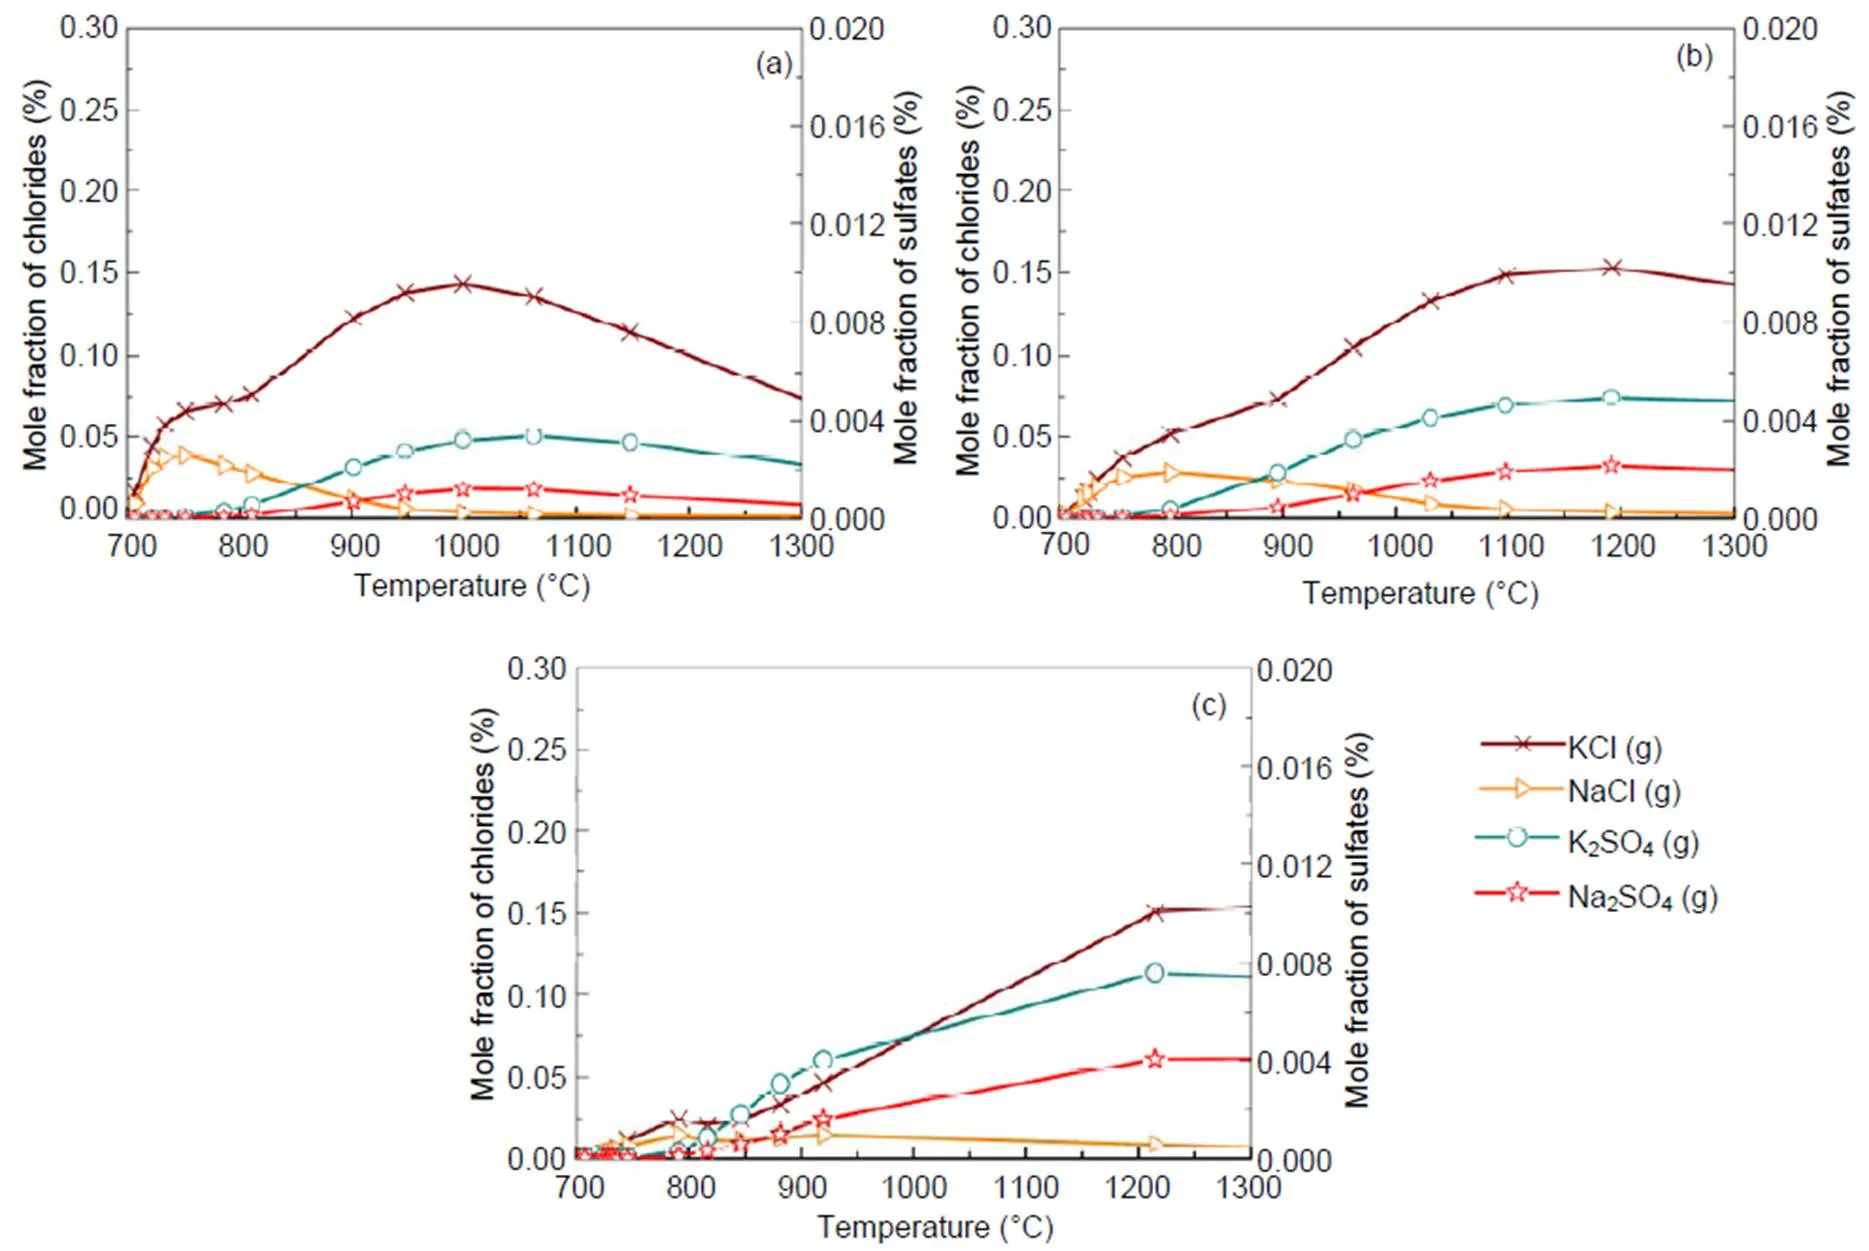
Fig. 9 Mole fractions of alkali species against temperature for the 30% blend under the pressures of 0.1 MPa (a), 0.5 MPa (b), and 2.5 MPa (c), respectively
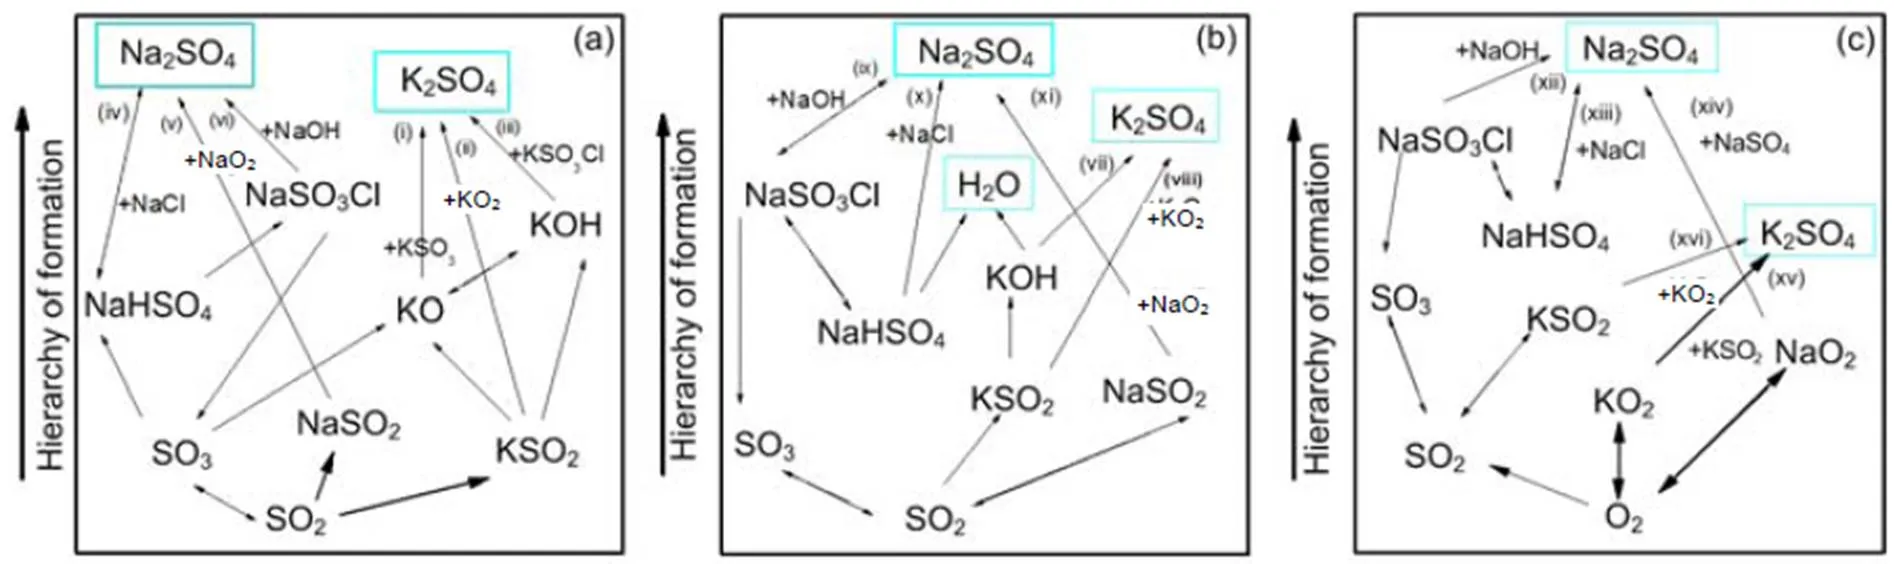
Fig. 10 Pathways for the formation of K2SO4 and Na2SO4 at 850 °C: 0.1 MPa (a), 0.5 MPa (b), and 2.5 MPa (c)
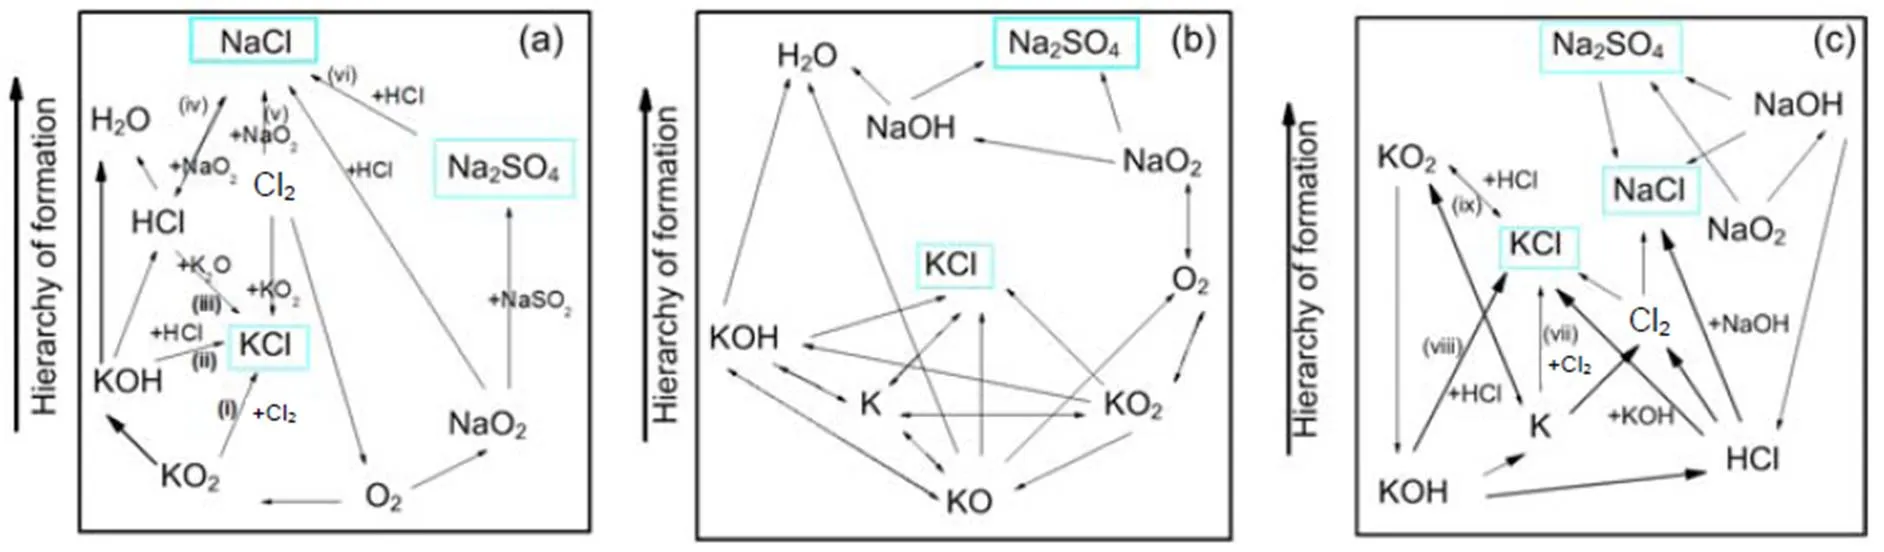
Fig. 11 Pathways for the formation of KCl and NaCl at 850 °C: 0.1 MPa (a), 0.5 MPa (b), and 2.5 MPa (c)
The chlorination of alkalis also takes place in the K/Na/O/H/S/Cl subsets as presented in Fig. 11.Generally, the formation of KCl and HCl preferentially takes place over NaCl. As shown in Fig. 11, for the case of 0.1 MPa pressure, the formation of KCl is achieved by three possible pathways: (i) 2KO2+Cl2Û2KCl+2O2, (ii) KOH+HClÛKCl+H2O, and (iii) K2O+HClÛKCl+H2O. NaCl is formed by the chlorination of NaO2and Na2SO4: (iv) HCl+NaO2ÛNaCl +HO2, (v) 2NaO2+Cl2Û2NaCl+2O2, and (vi) Na2SO4+HClÛNaHSO4+NaCl. The chlorination routes at 0.1 MPa agree with other works (Li et al., 2013). As shown from Fig. 11c at high pressure, the formation of KCl and NaCl are achieved by reactions of either, KOH or NaOH with HCl as: (vii) 2K+Cl2Û2KCl, (viii) KOH+HClÛKCl+H2O, (ix) KO2+HClÛKCl +HO2, or NaOH+HClÛNaCl+H2O.
4.5 Influence of pressure changes on the transformation of alkali minerals
The pressure rise appears to affect the topography of the crystal structure in that as the pressure rises to 0.5 MPa the grain structure appears smaller (Fig. 2). However, the effect of pressure on the atomic distributions of potassium, sodium, chloride, and sulfur is almost negligible, as can be seen in Fig. 3, implying that an increase in pressure is likely to have negligible effect on the equilibrium distributions of minerals in their solid phase. XRD analyses also indicate that a pressure rise to 0.5 MPa affects the distribution of solid alkali minerals to a negligible degree, so that the distribution curves in Figs. 4b and 4c are nearly the same for both pressures.
Equilibrium calculations in Section 4.3 indicate that, a rise in pressure to 2.5 MPa leads to higher equilibrium amounts of liquid species like Na2SO4and lower gaseous NaCl and KCl fractions, but solid species are affected negligibly, as can been seen in Fig. 5 at 0.5 and 2.5 MPa. It must be emphasized that the influence of pressure up to 2.5 MPa on the amounts of solid alkali minerals is negligible, so that the prediction curves in Figs. 5–8 for solid species are almost the same for all pressures. Nevertheless, a rise in pressure greatly affects the amounts of all liquid and gaseous species. At 30% blend ash where the sulfur to alkali ratio is 0.39 (Table 4), and as the pressure increases to 2.5 MPa as shown in Fig. 8c, KCl(g) is predicted to be more predominant than K2SO4(g) even at higher temperatures but in lower values as limited by pressure.
Chemical kinetic calculations in Section 4.4 show that, at temperatures lower than 900 °C, a rise in pressure decreases the amounts of KCl(g) and NaCl(g), which is in a good agreement with equilibrium calculations. However, at higher temperatures, gaseous alkali species increase with rise in pressure, leading to a big difference from the equilibrium calculation. This is likely to be due to the different dynamics that are involved when gases are formed from solids and melts as in the case of the equilibrium calculations. Reaction mechanisms in Fig. 10 indicate that the oxidation of SO2to SO3to produce K2SO4and Na2SO4is significant and maybe a limiting step, as identified in other work (Iisa et al., 1999). However, as the pressure increases to 2.5 MPa, the conversion of SO2to SO3plays a minor role as it competes with the formation route: (xv) O2→KO2+KSO2→K2SO4. It is also observed in Figs. 10 and 11 that an increase in pressure significantly reduces the number of possible formation mechanisms for the formation of potassium gaseous alkalis like KCl and K2SO4.
5 Conclusions
The behavior of alkali minerals for coal and biomass blends at high pressure is predicted by ash equilibrium calculations in this work. The gas phase reactions of alkali metals, O/H and Cl/S subsets are evaluated by a chemical kinetic model using high temperature species interactions. The existence of solid minerals is evaluated by XRD ash analyses from thermogravimetric oxyfuel combustion. Conclusions can be drawn as follows.
The formation and distribution of alkali species in gas phases greatly depend on temperature and the blend ratio. Increasing the blend ratio will increase the content of potassium-based minerals against a reduction of sodium-based minerals. The alkali- associated slagging in boilers can be minimized with a synergistic effect of co-combustion, which mainly due to the combination of rich sulfur in coal and rich potassium in biomass to form the stable compound K2SO4in the solid phase in the case of typical operation temperature of fluidized bed combustion.
Pressure rise will increase the amounts of all liquids, but not the solid alkali species. Within the operating temperature range of fluidized-bed boilers (850–900°C), the gaseous KCl concentration is significantly reduced when coal is burned with biomass and when the combustor is pressurized. Thus, less KCl(g) condenses on the boiler heat transfer surface, leading to less KCl-associated fouling and corrosion. Reaction mechanisms indicate that oxidation of SO2to SO3plays a major role in sulfate formation, but the contribution of this oxidation decreases with an increase in pressure especially for the formation of K2SO4.
Contributors
Oris CHANSA: conceptualization, methodology, software, original draft, and writing. Zhong-yang LUO: project administration, funding acquisition, and technical supervision. Wen-nan ZHANG: visualization, review, editing, and validation. Chun-jiang YU: general supervision, software, formal analysis, and investigation.
Conflict of interest
Oris CHANSA, Zhong-yang LUO, Wen-nan ZHANG, and Chun-jiang YU declare that they have no conflict of interest.
Ager III JW, Howard CJ, 1987. Rate coefficient for the gas phase reaction of NaOH with CO2.,92(D6):6675-6678.https://doi.org/10.1029/JD092iD06p06675
Bartolomé C, Gil A, 2013. Ash deposition and fouling tendency of two energy crops (cynara and poplar) and a forest residue (pine chips) co-fired with coal in a pulverized fuel pilot plant., 27(10):5878-5889.https://doi.org/10.1021/ef401420j
Chansa O, Luo ZY, Zhang WN, et al., 2019. Forms of potassium and chlorine from oxy-fuel co-combustion of lignite coal and corn stover., 2(2):103-110. https://doi.org/10.1016/j.crcon.2019.03.003
Chansa O, Luo ZY, Yu CJ, 2020. Study of the kinetic behaviour of biomass and coal during oxyfuel co-combustion., 28(7):1796- 1804 https://doi.org/10.1016/j.cjche.2020.02.023
Chen L, Yong SZ, Ghoniem AF, 2012. Oxy-fuel combustion of pulverized coal: characterization, fundamentals, stabilization and CFD modeling., 38(2):156-214.https://doi.org/10.1016/j.pecs.2011.09.003
Christensen KA, Stenholm M, Livbjerg H, 1998. The formation of submicron aerosol particles, HCl and SO2in straw-fired boilers., 29(4):421-444. https://doi.org/10.1016/S0021-8502(98)00013-5
Gazzino M, Benelli G, 2008. Pressurised oxy-coal combustion rankine-cycle for future zero emission power plants: process design and energy analysis. Proceedings of ASME 2nd International Conference on Energy Sustainability Collocated with the Heat Transfer, Fluids Engineering, and 3rd Energy Nanotechnology Conferences, p.269-278. https://doi.org/10.1115/ES2008-54268
Glarborg P, Marshall P, 2005. Mechanism and modeling of the formation of gaseous alkali sulfates., 141(1-2):22-39. https://doi.org/10.1016/j.combustflame.2004.08.014
Gopan A, Kumfer BM, Axelbaum RL, 2015. Effect of operating pressure and fuel moisture on net plant efficiency of a staged, pressurized oxy-combustion power plant., 39:390-396. https://doi.org/10.1016/j.ijggc.2015.05.014
Hansen LA, Nielsen HP, Frandsen FJ, et al., 2000. Influence of deposit formation on corrosion at a straw-fired boiler., 64(1-3):189-209. https://doi.org/10.1016/S0378-3820(00)00063-1
Hong J, Chaudhry G, Brisson JG, et al., 2009. Analysis of oxy-fuel combustion power cycle utilizing a pressurized coal combustor., 34(9):1332-1340. https://doi.org/10.1016/j.energy.2009.05.015
Hong J, Field R, Gazzino M, et al., 2010. Operating pressure dependence of the pressurized oxy-fuel combustion power cycle., 35(12):5391-5399. https://doi.org/10.1016/j.energy.2010.07.016
Hynes AJ, Steinberg M, Schofield K, 1984. The chemical kinetics and thermodynamics of sodium species in oxygen-rich hydrogen flames., 80(6):2585-2597. https://doi.org/10.1063/1.447052
Iisa K, Lu Y, Salmenoja K, 1999. Sulfation of potassium chloride at combustion conditions., 13(6):1184-1190. https://doi.org/10.1021/ef990057a
Jokiniemi JK, Lazaridis M, Lehtinen KEJ, et al., 1994. Numerical simulation of vapour-aerosol dynamics in combustion processes., 25(3):429-446. https://doi.org/10.1016/0021-8502(94)90062-0
Li B, Sun ZW, Li ZS, et al., 2013. Post-flame gas-phase sulfation of potassium chloride., 160(5):959-969. https://doi.org/10.1016/j.combustflame.2013.01.010
Li GY, Wang CA, Yan Y, et al., 2016. Release and transformation of sodium during combustion of Zhundong coals., 89(1):48-56. https://doi.org/10.1016/j.joei.2015.01.011
Li HF, Yu B, Wang GX, et al., 2019. Investigation on improve ash fusion temperature (AFT) of low-AFT coal by biomass addition., 191:11-19. https://doi.org/10.1016/j.fuproc.2019.03.005
Li RD, Kai XP, Yang TH, et al., 2014. Release and transformation of alkali metals during co-combustion of coal and sulfur-rich wheat straw., 83:197-202. https://doi.org/10.1016/j.enconman.2014.02.059
Liao YF, Yang G, Ma XQ, 2012. Experimental study on the combustion characteristics and alkali transformation behavior of straw., 26(2):910-916. https://doi.org/10.1021/ef2016107
Liao YF, Cao YW, Chen T, et al., 2015. Experiment and simulation study on alkalis transfer characteristic during direct combustion utilization of bagasse., 194:196-204. https://doi.org/10.1016/j.biortech.2015.06.121
Liu YQ, Cheng LM, Zhao YG, et al., 2018. Transformation behavior of alkali metals in high-alkali coals., 169:288-294. https://doi.org/10.1016/j.fuproc.2017.09.013
Munir S, Nimmo W, Gibbs BM, 2011. The effect of air staged, co-combustion of pulverised coal and biomass blends on NOemissions and combustion efficiency., 90(1):126-135. https://doi.org/10.1016/j.fuel.2010.07.052
Pronobis M, Mroczek K, Tymoszuk M, et al., 2017. Optimisation of coal fineness in pulverised-fuel boilers., 139:655-666. https://doi.org/10.1016/j.energy.2017.07.057
Silva RB, Fragoso R, Sanches C, et al., 2014. Which chlorine ions are currently being quantified as total chlorine on solid alternative fuels?, 128:61-67. https://doi.org/10.1016/j.fuproc.2014.07.003
Skinner T, Adams JB, Gama PT, 2006. The effect of mouth opening on the biomass and community structure of microphytobenthos in a small oligotrophic estuary., 70(1-2):161-168. https://doi.org/10.1016/j.ecss.2006.04.007
Srinivasachar S, Helble JJ, Ham DO, et al., 1990. A kinetic description of vapor phase alkali transformations in combustion systems., 16(4):303-309. https://doi.org/10.1016/0360-1285(90)90039-6
Steenari BM, Lindqvist O, 1998. High-temperature reactions of straw ash and the anti-sintering additives kaolin and dolomite., 14(1):67-76. https://doi.org/10.1016/S0961-9534(97)00035-4
Tang YX, Luo ZY, Yu CJ, 2019. Determination of biomass- coal blending ratio by14C measurement in co-firing flue gas., 20(7):475-486. https://doi.org/10.1631/jzus.A1900006
Tillman DA, Duong D, Miller B, 2009. Chlorine in solid fuels fired in pulverized fuel boilers—sources, forms, reactions, and consequences: a literature review., 23(7):3379-3391. https://doi.org/10.1021/ef801024s
Vamvuka D, Kakaras E, 2011. Ash properties and environmental impact of various biomass and coal fuels and their blends., 92(3):570-581. https://doi.org/10.1016/j.fuproc.2010.11.013
Wang XH, Feng ZM, 2004. Biofuel use and its emission of noxious gases in rural China., 8(2):183-192. https://doi.org/10.1016/j.rser.2003.09.002
Weng WB, Chen S, Wu H, et al., 2018. Optical investigation of gas-phase KCl/KOH sulfation in post flame conditions., 224:461-468. https://doi.org/10.1016/j.fuel.2018.03.095
Wiinikka H, Gebart R, Boman C, et al., 2007. Influence of fuel ash composition on high temperature aerosol formation in fixed bed combustion of woody biomass pellets., 86(1-2):181-193. https://doi.org/10.1016/j.fuel.2006.07.001
Wu DY, Wang YH, Wang Y, et al., 2016. Release of alkali metals during co-firing biomass and coal., 96:91-97. https://doi.org/10.1016/j.renene.2016.04.047
Wu H, Castro M, Jensen PA, et al., 2011. Release and transformation of inorganic elements in combustion of a high-phosphorus fuel., 25(7):2874-2886. https://doi.org/10.1021/ef200454y
Xue ZY, Zhong ZP, Zhang B, et al., 2017. Potassium transfer characteristics during co-combustion of rice straw and coal., 124:1418-1424. https://doi.org/10.1016/j.applthermaleng.2017.06.116
Yan KZ, Guo YX, Ma ZB, et al., 2018. Quantitative analysis of crystalline and amorphous phases in pulverized coal fly ash based on the rietveld method., 483:37-42. https://doi.org/10.1016/j.jnoncrysol.2017.12.043
Yang TH, Kai XP, Sun Y, et al., 2011. The effect of coal sulfur on the behavior of alkali metals during co-firing biomass and coal., 90(7):2454-2460. https://doi.org/10.1016/j.fuel.2011.02.031
Zeng XY, Ma YT, Ma LR, 2007. Utilization of straw in biomass energy in China., 11(5):976-987. https://doi.org/10.1016/j.rser.2005.10.003
Zheng YJ, Jensen PA, Jensen AD, et al., 2007. Ash transformation during co-firing coal and straw., 86(7-8):1008-1020. https://doi.org/10.1016/j.fuel.2006.10.008
Zhou H, Zhou B, Li LT, et al., 2013. Experimental measurement of the effective thermal conductivity of ash deposit for high sodium coal (Zhun Dong coal) in a 300 kW test furnace., 27(11):7008-7022. https://doi.org/10.1021/ef4012017
Zhou JB, Zhuang XG, Alastuey A, et al., 2010. Geochemistry and mineralogy of coal in the recently explored Zhundong large coal field in the Junggar Basin, Xinjiang province, China., 82(1-2):51-67. https://doi.org/10.1016/j.coal.2009.12.015
List of electronic supplementary materials
Fig. S1 Crystalline peak positions in the 30% blend sample at 0.1 and 0.5 MPa
Table S1 Summary of crystalline peak positions and areas in the 30% blend sample at 0.1 and 0.5 MPa
https://doi.org/10.1631/jzus.A2000039
TK6
*Project supported by the National Science Foundation Cooperation of China and USA (NSFC-NSF) (No. 51661125012) and Project of the State Key Laboratory of Clean Energy Utilization, Zhejiang University, China
#Electronic supplementary materials: The online version of this article (https://doi.org/10.1631/jzus.A2000039) contains supplementary materials, which are available to authorized users
© Zhejiang University 2021
Jan. 28, 2020;
June 11, 2020;
Jan. 10, 2021
 Journal of Zhejiang University-Science A(Applied Physics & Engineering)2021年2期
- Journal of Zhejiang University-Science A(Applied Physics & Engineering)的其它文章
- Modification of acidity in HZSM-5 zeolite for methane-methanol co-reaction#*
- Catalytic effects of V2O5 on oxidative pyrolysis of spent cation exchange resin#*
- Surface/Interfacial design and tailoring of polymeric membranes for liquid-phase separation*