GPR、XGBoost和CatBoost模拟江西地区参考作物蒸散量的适应性研究
刘小强,代智光,吴立峰,张富仓,董建华,陈志月
GPR、XGBoost和CatBoost模拟江西地区参考作物蒸散量的适应性研究
刘小强1, 2,代智光1,吴立峰1*,张富仓2,董建华3,陈志月4
(1.南昌工程学院 水利与生态工程学院,南昌 330099;2.西北农林科技大学 旱区农业水土工程教育部重点实验室,陕西 杨凌 712100;3.昆明理工大学 农业与食品学院,昆明 650500;4.河海大学 水文水资源学院,南京 210098)
【】提高机器学习模型模拟参考作物蒸散量在江西省适应性和精度。基于江西南昌等15个气象站2001—2015年日值气象数据(最高气温、最低气温、地表辐射、大气顶层辐射、相对湿度和2 m高风速),以FAO-56 Penman-Monteith(P-M)公式的计算结果作为对照,建立了计算0的高斯过程回归(GPR)、极限梯度提升(XGBoost)和梯度提升决策树(CatBoost)模型,并分别与经验模型进行比较。各气象参数对机器学习模型模拟0的精度影响由大到小依次为:s、max和min、、2,且采用max、min、s和气象参数组合的机器学习模型(0.2 mm/d)模拟0精度高。此外,3种机器学习模型在有限的气象数据时具有较好的适用性,且优于传统经验模型,其中GPR和CatBoost模型的预测精度高,但GPR模型稳定性最好。考虑到所研究模型调参的复杂性、预测精度和稳定性,GPR模型可作为江西地区参考作物蒸散量模拟的推荐方法。
参考作物蒸散量;高斯过程回归;极限提升增强;梯度提升决策树;经验模型
0 引言
【研究意义】作物需水量是农田土壤水分循环的关键因子,对水资源优化配置和灌溉制度的制定有重要意义,而计算作物需水量的关键是确定参考作物蒸散量(0)[1]。【研究进展】国内外通常将FAO-56 Penman-Monteith(P-M)作为估算0的标准方法[2],而P-M法需要的气象数据完整性高,多数气象观测数据无法达到该方法要求,使得P-M法的应用受到一定程度的限制,于是利用有限气象数据的经验法就得到了广泛应用,如基于辐射的Irmak法[3]和Makkink法[4]等。张倩等[5]比较了基于辐射和温度等9种方法在新乡的适用性,发现辐射法中Irmak模型的精度高于温度法。胡兴波等[6]在青海高寒地区发现Makkink法可直接用于计算极端干旱区以外的0。
近年来,神经网络方法[7]、支持向量机[8]、基因表达式编程[9]和随机森林[10]以及各种优化模型(蝙蝠算法优化极限学习机[11]和极限学习机优化遗传算法[12]等)由于输入参数组合灵活以及精度优于经验模型而得到广泛研究,并且在某些特定区域具有更高的精度[9-10]。【切入点】江西地处我国华东地区,水热资源丰富,但由于经常旱涝急转严重制约了作物的高产稳产。此外,江西不同区域气候差异较大,但具有长系列气象观测资料的气象站点却匮乏,无法满足农业生产对气象资料的需要。因此,确定适宜的0计算方法极其重要。而大多数学者运用机器学习模拟0时,以模型预测精度为研究对象较多[7-9],而综合考虑其精度和稳定性[13]的比较研究在江西地区还缺乏报道。
【拟解决的关键问题】为此,以FAO-56 P-M计算的0结果为对照,建立基于有限的气象数据的3种机器学习模型(GPR、XGBoost和CatBoost),分析不同气象要素对江西地区0预测精度的影响和稳定性;并将机器学习模型与Irmak和Makkink模型进行比较,评估机器学习模型的精度和稳定性,以便筛选出气象数据不足条件下江西地区最适宜的0估算替代方法,以期为江西地区灌溉制度制定和水资源优化配置提供科学指导。
1 材料与方法
1.1 试验区概况
江西省(24°29′—30°04′N,113°34′—118°28′E)位于长江中下游地区,属中亚热带湿润季风气候,全省多年年均气温为16.3~19.5 ℃,且一般自北向南递增。省内降水丰沛,主要集中在4—9月,多年平均降水量1 341~1 940 mm。降水的季节性变化大,汛期河水暴涨,易泛滥成灾。
1.2 数据收集与处理
选取江西省修水、宜春、吉安、遂川、赣县、庐山、鄱阳、景德镇、南昌、樟树、贵溪、玉山、南城、广昌、寻乌15个气象站2001—2015年的地面观测数据中的日值数据集(包括最高气温(max)、最低气温(min)、相对湿度()、2 m高风速(2)、大气顶层辐射(a)、地表辐射(s))。其中2001—2010年用于训练,2011—2015年用于验证。
1.3 研究方法
1.3.1 FAO-56 Penman-Monteith模型
FAO-56 Penman-Monteith(P-M)公式被联合国粮农组织推荐为最适宜估算参考作物蒸散量的方法[2],其具体表达式为:

式中:0为参考作物蒸散量;n为地表净辐射;为土壤热通量密度;为2 m高处的平均气温;2为2 m高处的风速;s和a分别为饱和水汽压和实际水汽压;为蒸汽压曲线的斜率;为温度计常数。
1.3.2 高斯过程回归模型
给定训练集={(x,y)|=1,2,…},其中为维输入向量,为输出的标量,为训练样本数,输入矩阵为×列的向量,为目标输出,因此记为=(,)。高斯过程回归模型(GPR)是给定输入向量时确定目标输出的联合高斯分布,由均值函数()和协方差函数(,')[14]给出:

1.3.3 极端梯度提升模型
极端梯度提升(XGBoost)是由Chen和Guestrin[15]于2016年提出的一个梯度增强机(GBMs)的新型算法。XGBoost模型旨在防止过度拟合,同时通过简化和正则化使预测保持最佳计算效率而降低计算成本。XGBoost算法源于“提升”的概念,它结合了一组弱学习者的所有预测,通过特殊训练培养强学习者。其计算式为:
, (3)
式中:f(x)为步骤的学习者;f(t)和f1是步骤为和1;x是输入变量。
1.3.4 梯度提升决策树模型
梯度提升决策树(CatBoost)是一种新的梯度提升决策树(GBDT)算法[16]。它成功地处理了分类特征,并利用训练过程中对分类特征处理,而不是预处理。该算法的另一个优点是它在选择树结构时用新模式计算叶值,这有助于减少过度拟合并允许使用整个训练数据集,即对每个示例数据集进行随机排列并计算该示例的平均值。该方法对于回归任务,需要将获取的数据平均值用于先验计算。

式中:为先验值;参数是先验值的权重。
1.4 统计指标
本研究使用了3个常用的统计指标,分别为平均绝对误差()、均方根误差()和决定系数(2)。
2 结果与分析
2.1 3种机器学习模型精度的比较
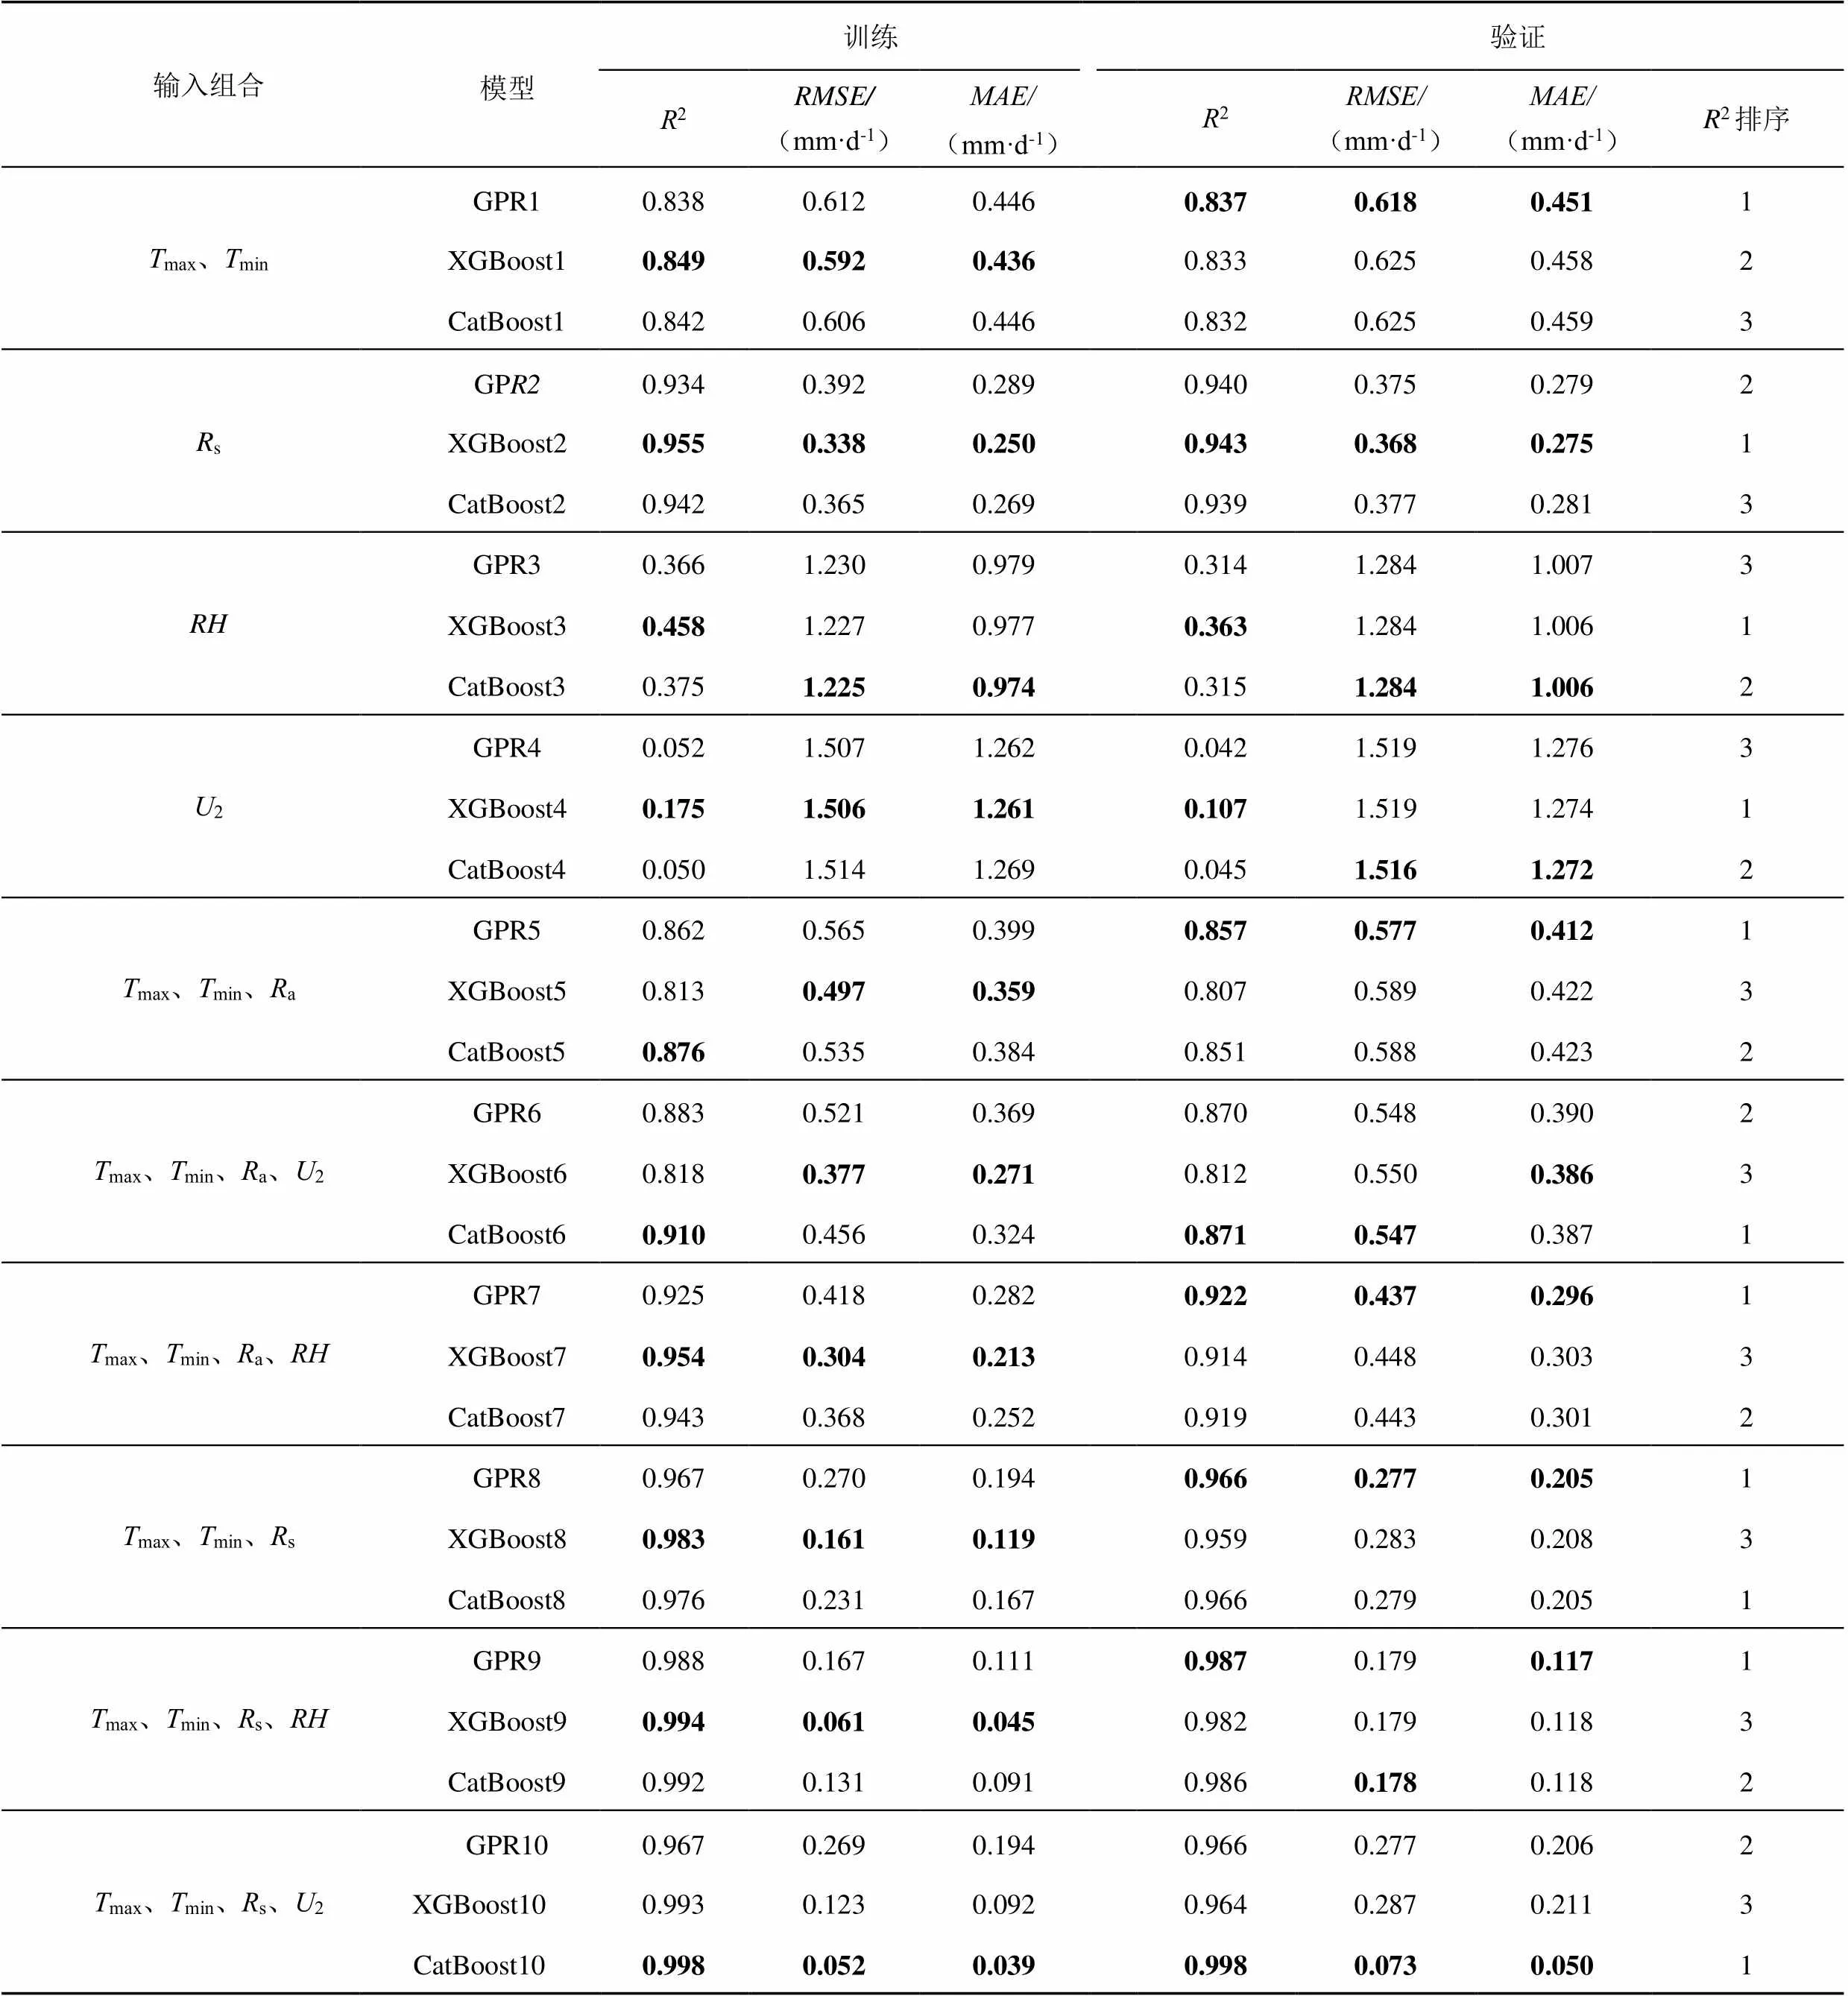
表1为3种机器学习模型不同输入组合下的预测0的性能评估结果。由表1可知,对于训练期,组合1~9的模型精度表现为XGBoost>CatBoost>GPR,而组合10表现为CatBoost>XGBoost>GPR。在验证期,由于多数组合的和的误差都在2.7%以内,故CatBoost和GPR模型具有相似的精度,整体上CatBoost和GPR模型预测0的精度比XGBoost模型高。
合理的输入参数组合对模型模拟的精度有显著提高,如采用max、min、s、,max、min、s、2和max、min、s作为输入参数的模型比采用max、min、a、,max、min、a、2和max、min、a模型模拟的效果好,这表明s比a对模型模拟效果影响大。另外,模型9和模型10的性能优于模型8,表明、2对模型模拟的精度有一定的影响。余下组合则展示s对于预测0的影响最大,max/min次之,2最小。在验证期,模型CatBoost10的和的值是最低的,2最高(2=0.998,=0.073 mm/d,=0.050 mm/d),与上述情况一致。因此考虑到组合8仅有温度和地表辐射资料就可获得较高的模拟精度,推荐模型8作为该地区0适宜模型。

表1 GPR、XGBoost和CatBoost模型的平均统计指标
本研究通过分析2的大小比较3种机器学习模型的差异(表1),可得,GPR模型中有5个组合预测0的2最高,其中组合max、min、R、U的最高2为0.987;XGBoost模型有3个组合预测0的2最高,这些组合包含s、、2,而最高2为0.943;CatBoost模型含有风速时预测0的2最高,其2为0.998。此外,有5个组合预测0的2排在第2位。总体上看,在验证期中,XGBoost模型2排序最大,排第3位,CatBoost模型排第2位,而GPR模型2的排序最小,排第1位。
2.2 3种机器学习模型的稳定性比较
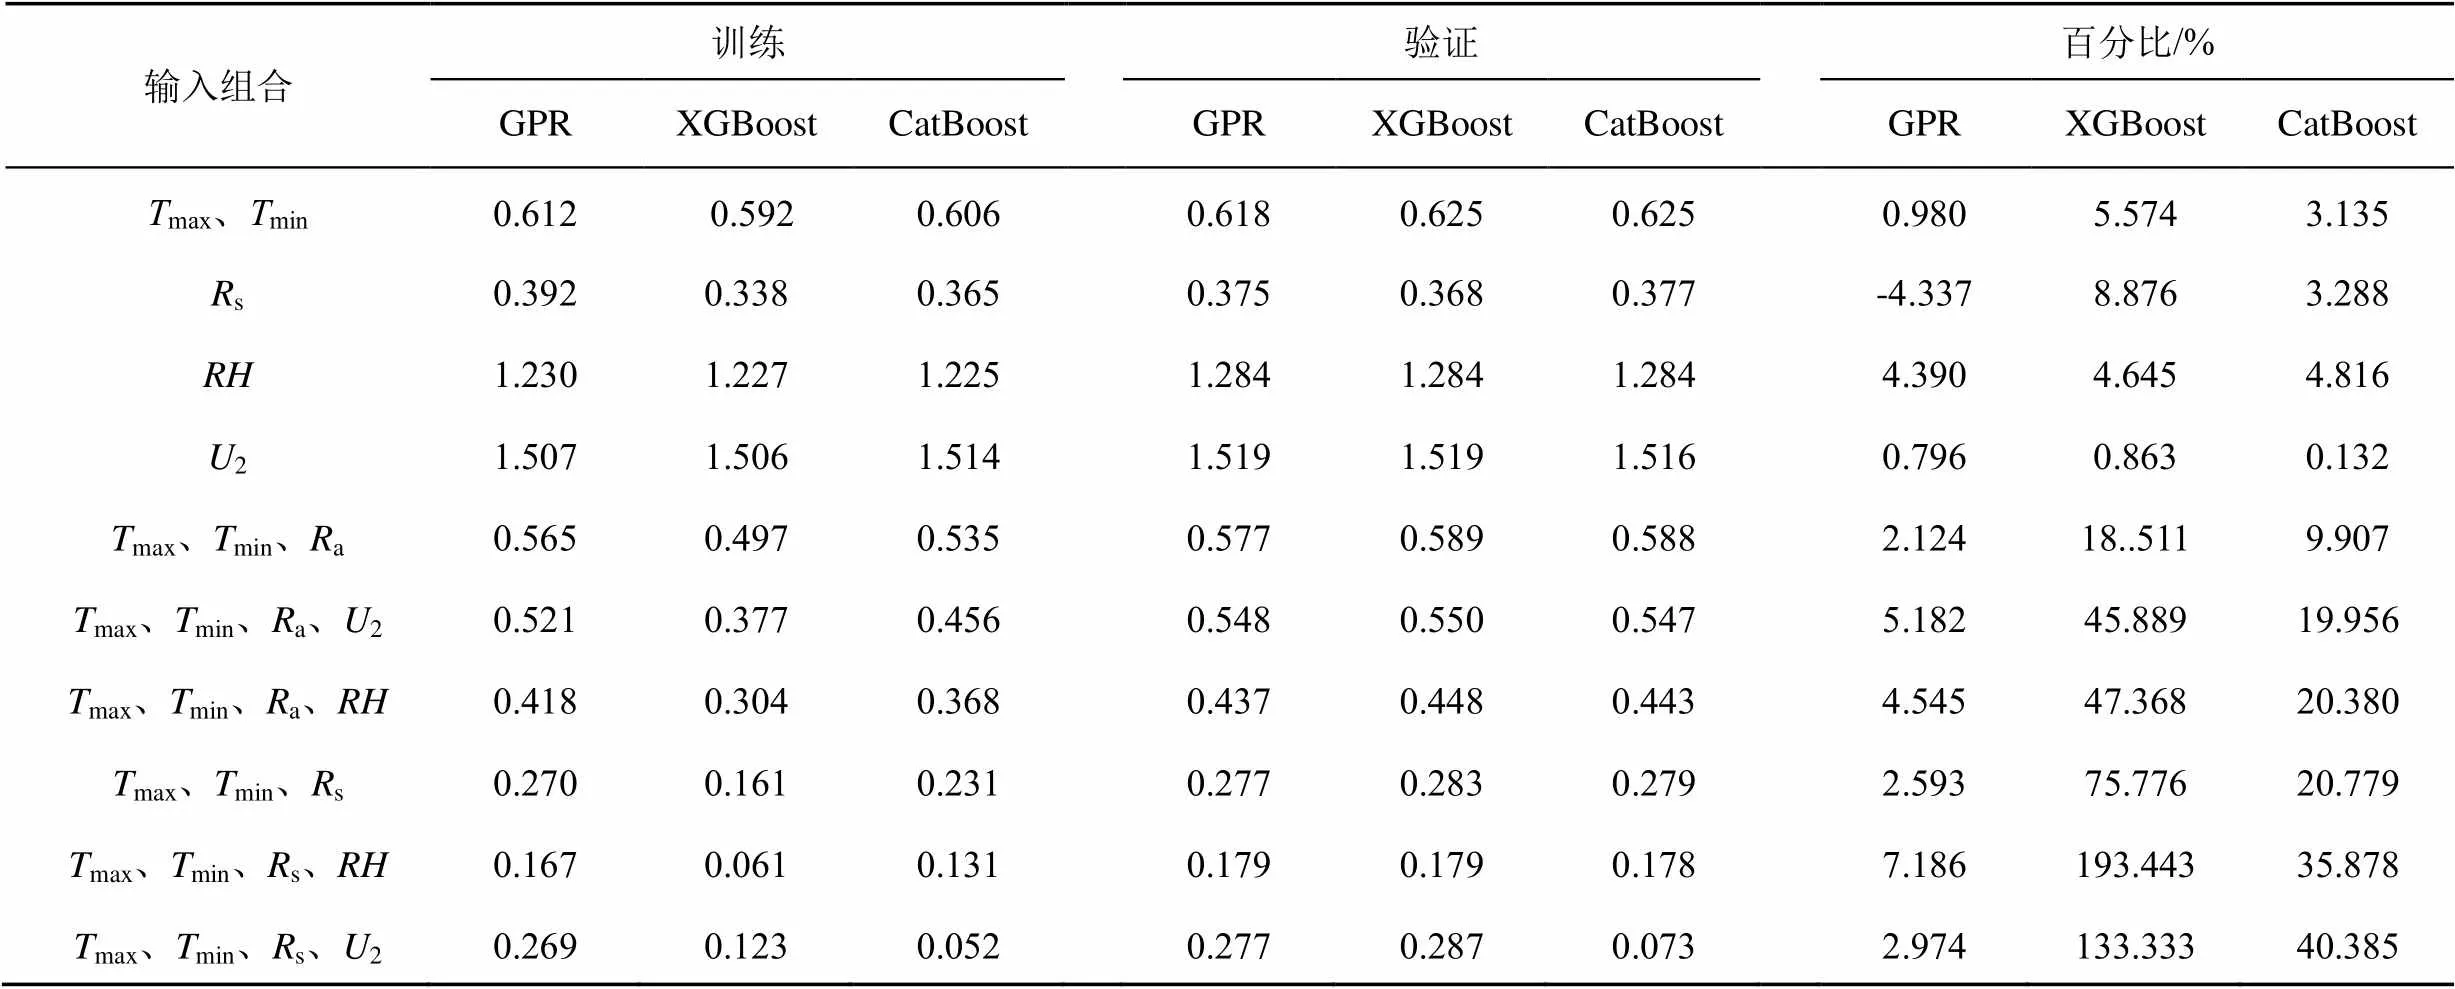
由表1加粗字体可知,在训练期,总体上XGBoost模型优于GPR和CatBoost模型,然而验证期,GPR模型却优于CatBoost和XGBoost模型。通过分析机器学习模型验证期相对训练期的平均及其百分比(表2)可知:对于3种机器学习模型,XGBoost模型验证期平均的百分比在各个组合均最大,其最大百分比是193.4%;而GPR模型其百分比增长幅度最小,都在8%以内;对于CatBoost模型,在前5个组合中,其百分比在10%以内,而后5个组合中其介于20%~41%之间,说明GPR模型模拟时稳定性最好,其次是CatBoost模型,而XGBoost模型最差。
表2 机器学习模型验证期相对训练期的平均及其百分比

Table 2 The average RMSE and percentage of machine learning models during the texting period relative to the training period

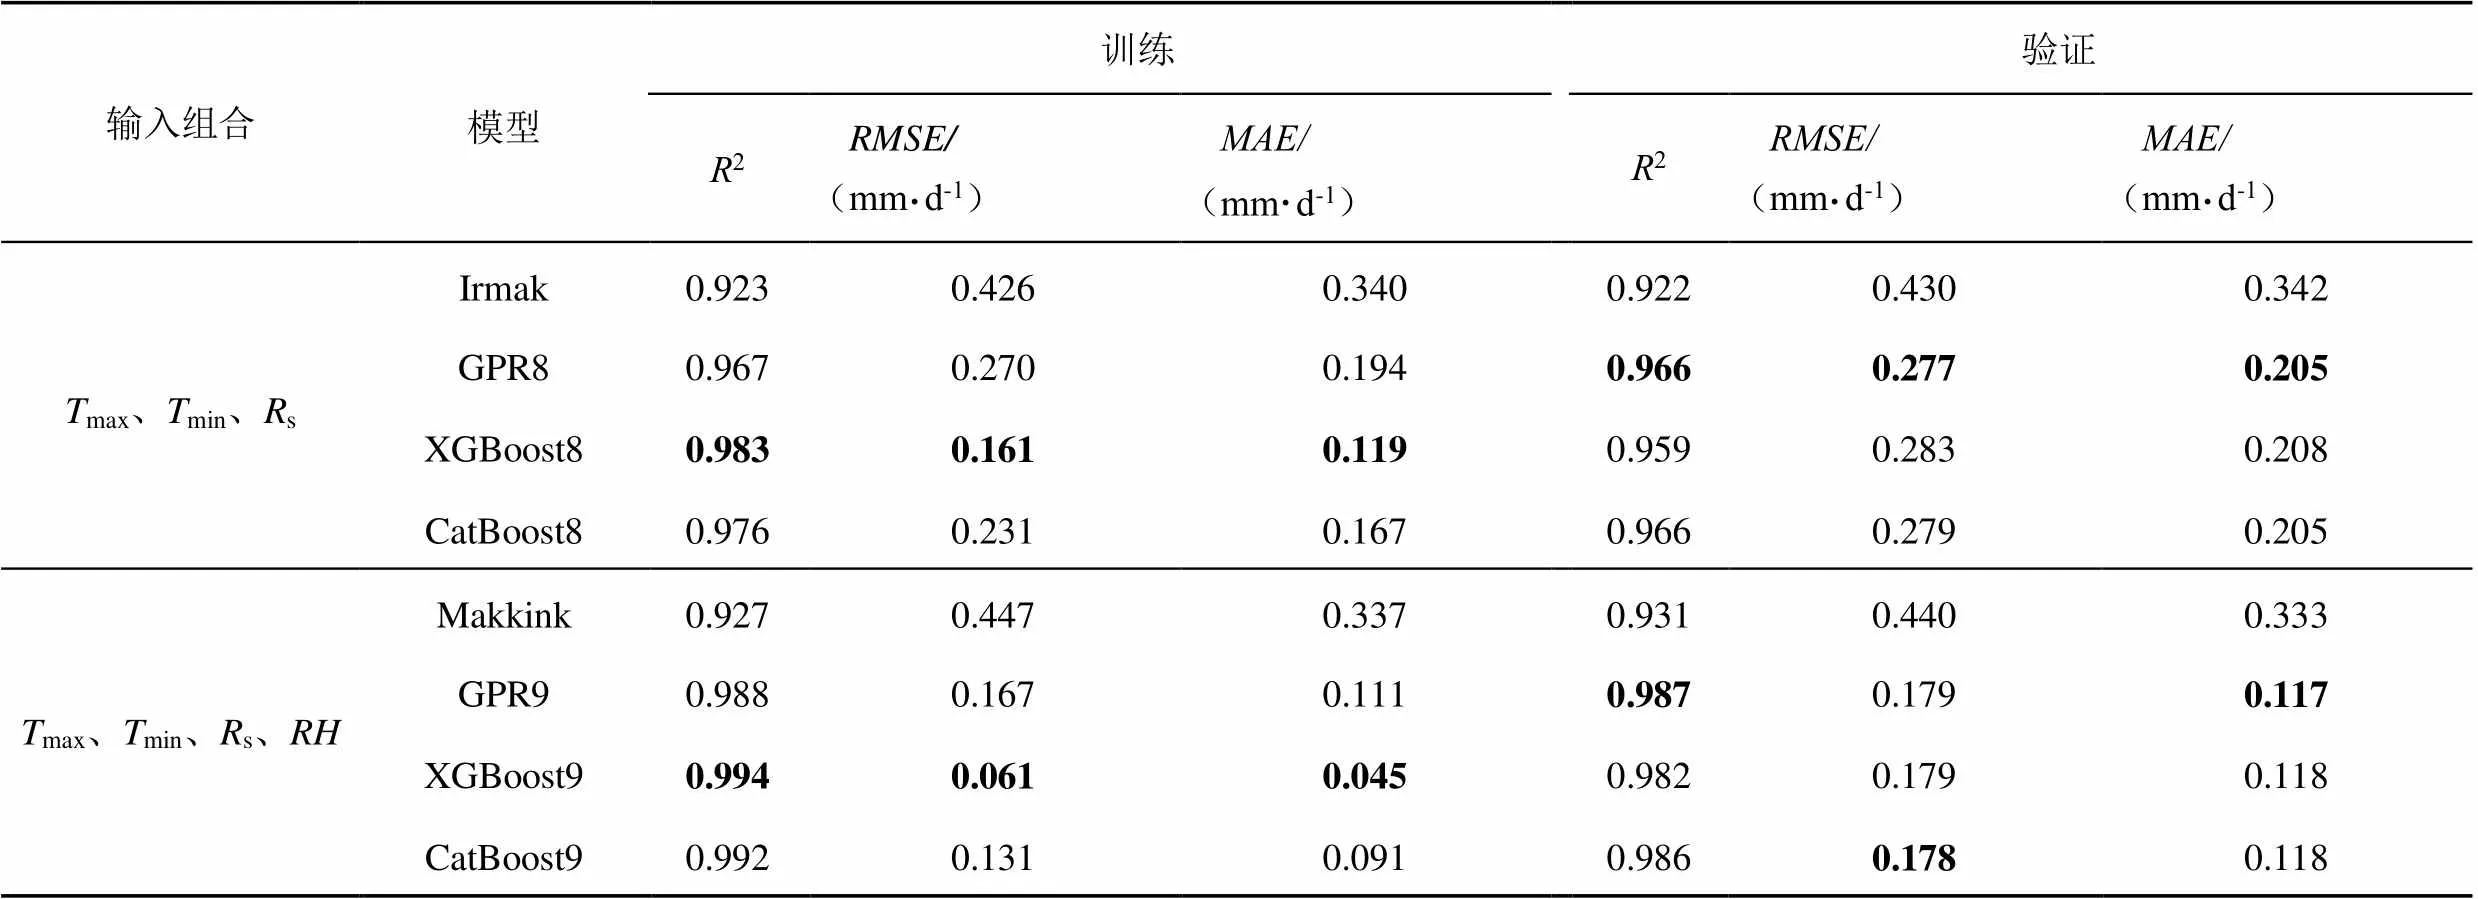
表3 经验模型和机器学习模型的平均统计指标
2.3 3种机器学习模型与经验模型的比较
本研究分析了经验模型与相同输入参数的机器学习模型预测0的平均统计指标(表3),可得机器学习模型的精度都高于经验模型。在max、min和s的输入组合下,Irmak模型预测精度最低(验证期2=0.922,=0.430 mm/d,=0.342 mm/d),而GPR8模型预测精度最高(验证期2=0.966,=0.277 mm/d,=0.205 mm/d);在max、min、s和的输入组合下,验证期中Makkink模型预测0的精度最低(2=0.931,=0.440 mm/d,=0.333 mm/d)。
3 讨论
3.1 气象参数输入组合方式
输入气象参数组合方式是机器学习模型预测高精度的0的关键因子。本研究中,当使用相对湿度和风速时,机器学习模型的模拟值与世界粮农组织推荐的标准方法[2]计算值偏差最大,然而使用温度(max/min)和辐射数据时,机器学习模型的模拟值精度高,与Fan等[10]和Feng等[17]在亚热带季风性湿润地区基于温度和地表辐射的机器学习模型预测0的精度高和基于温度和大气顶层辐射模拟精度较高的结果一致。主要是因为在作物生长过程中,太阳辐射和温度是不可替代的关键因素。当使用组合max、min、s、2时,2与s的耦合作用对CatBoost模型预测精度影响巨大,具体出现的原因还有待进一步研究。此外,模型预测精度随着输入气象参数个数增加而提高,与前人研究[18-20]结果一致。
3.2 机器学习模型的预测精度
本研究GPR模型在验证期预测0的精度高。Holman等[14]发现,在高原地区高斯过程比最小二乘回归的精度高。Karbasi等[21]研究表明:GPR模型随着使用时间序列的增长其预测的精度越高,但具体能否在江西地区获得相同的结果,还有待进一步验证。Jhaveri等[22]在其他领域也应用CatBoost和XGBoost模型,由于XGBoost模型存在过度拟合的问题,故XGBoost模型精度较差。Huang等[23]发现,由于CatBoost模型是将该模型获得最佳的训练精度来获得最优结果,故CatBoost模型的精度较高,但本研究中GPR和CatBoost模型在max、min、s、的组合下和的误差都在0.9%以内,当输入3个参数时,和的误差都在2.7%内而输入1个参数的和的误差都在0.7%内,表明GPR模型模拟江西地区0的精度高。
3.3 机器学习模型的稳定性
机器学习模型的稳定性是预测0时需要考虑的关键因素。研究表明,在机器学习模型中,XGBoost模型验证期相对训练期的百分比增长最大,其次是CatBoost模型,GPR模型可能是因为能够处理非线性关系使其增长最小,但具体原因还有待后续研究。此结果揭示了XGBoost模型极不稳定,且随着使用气象参数个数的增加,XGBoost模型预测稳定性出现显著下降,与Fan等[24]利用XGBoost模型预测太阳辐射时,验证期增长幅度比其他模型大,而CatBoost模型对早期预测不正确的点赋予额外的权重后进行加权预测使CatBoost模型的百分比增加幅度比XGBoost模型小的结果一致。
4 结论
机器学习模型提高了江西地区参考作物蒸散量的精度,且各气象要素对机器学习模型模拟效果的影响由大到小依次为:s、max/min、、2。
使用max、min和s作为输入组合的GPR模型,验证期2=0.966,=0.277 mm/d,=0.205 mm/d,为江西地区适宜的参考作物蒸散量模型。
[1] MEHDIZADEH S. Estimation of daily reference evapotranspiration (0) using artificial intelligence methods: Offering a new approach for lagged0data-based modeling [J]. Journal of Hydrology, 2018, 559: 794-812.
[2] ALLEN R G, PEREIRA L S, RAES D, et al. Crop evapotranspiration (guidelines for computing crop water requirements) [M]. Rome: FAO, 1998.
[3] IRMAK S, IRMAK A, ALLEN R G, et al. Solar and net radiation-based equations to estimate reference evapotranspiration in humid climates[J]. Journal of Irrigation and Drainage Engineering, 2003, 129(5): 336-347.
[4] MAKKINK G F. Testing the Penman formula by means of lysimeters [J]. Journal of the Instition of Water Engineers, 1957, 11(3): 277-288.
[5] 张倩, 段爱旺, 高阳, 等. 基于温度资料估算参考作物腾发量的方法比较[J]. 农业机械学报, 2015, 46(2): 104-109.
ZHANG Qian, DUAN Aiwang, GAO Yang, et al. Comparative analysis of reference evapotranspiration estimation methods using temperature data [J]. Transactions of the Chinese Society for Agricultural Machinery, 2015, 46(2): 104-109.
[6] 胡兴波, 芦新建, 董梅, 等. 简化参照作物蒸散量(0)计算公式在青海省高寒区的适用性分析[J]. 西北农林科技大学学报(自然科学版), 2013, 41(11): 201-208.
HU Xingbo, LU Xinjian, DONG Mei, et al. Applicability of simplified reference crop evapotranspiration equations in high altitude and cold area of Qinghai Province[J]. Journal of Northwest A & F University (Natural Science Edition), 2013, 41(11): 201-208.
[7] 赵文刚, 马孝义, 刘晓群, 等. 基于神经网络算法的广东省典型代表站点0简化计算模型研究[J]. 灌溉排水学报, 2019, 38(5): 91-99.
ZHAO Wengang, MA Xiaoyi, LIU Xiaoqun, et al. Using neural network model to simplify0calculation for representative stations in Guangdong Province[J]. Journal of Irrigation and Drainage, 2019, 38(5): 91-99.
[8] YAO Y J, LIANG S L, LI X L, et al. Improving global terrestrial evapotranspiration estimation using support vector machine by integrating three process-based algorithms[J]. Agricultural and Forest Meteorology, 2017, 242: 55-74.
[9] WANG S, FU Z Y, CHEN H S, et al. Modeling daily reference ET in the Karst area of northwest Guangxi (China) using gene expression programming (GEP) and artificial neural network (ANN)[J]. Theoretical and Applied Climatology, 2016, 126(3): 493-504.
[10] FAN J L, YUE W J, WU L F, et al. Evaluation of SVM, ELM and four tree-based ensemble models for predicting daily reference evapotranspiration using limited meteorological data in different climates of China[J]. Agricultural and Forest Meteorology, 2018, 263: 225-241.
[11] DONG J H, WU L F, LIU X G, et al. Estimation of daily dew point temperature by using bat algorithm optimization based extreme learning machine[J]. Applied Thermal Engineering, 2020, 165: 114569.
[12] WU L F, ZHOU H M, MA X, et al. Daily reference evapotranspiration prediction based on hybridized extreme learning machine model with bio-inspired optimization algorithms: Application in contrasting climates of China[J]. Journal of Hydrology, 2019, 577: 123960.
[13] HASSAN M A, KHALIL A, KASEB S, et al. Exploring the potential of tree-based ensemble methods in solar radiation modeling[J]. Applied Energy, 2017, 203: 897-916.
[14] HOLMAN D, SRIDHARAN M, GOWDA P H, et al. Gaussian process models for reference ET estimation from alternative meteorological data sources[J]. Journal of Hydrology, 2014, 32: 28-35.
[15] CHEN T, GUESTRIN C. Xgboost: A scalable tree boosting system. In Proceedings of the 22nd acmsigkdd international conference on knowledge discovery and data mining [EB/OL], 2016(8): 785-794.
[16] DOROGUSH A V, ERSHOV V, GULIN A. CatBoost: gradient boosting with categorical features support [EB/OL]. 2018: arXiv: 1810.11363[cs.LG]. https://arxiv.org/abs/1810.11363
[17] FENG Y, PENG Y, CUI N B, et al. Modeling reference evapotranspiration using extreme learning machine and generalized regression neural network only with temperature data[J]. Computers and Electronics in Agriculture, 2017, 136: 71-78.
[18] TORRES A F, WALKER W R, MCKEE M. Forecasting daily potential evapotranspiration using machine learning and limited climatic data[J]. Agricultural Water Management, 2011, 98(4): 553-562.
[19] TABARI H, KISI O, EZANI A, et al. SVM, ANFIS, regression and climate based models for reference evapotranspiration modeling using limited climatic data in a semi-arid highland environment[J]. Journal of Hydrology, 2012, 444: 78-89.
[20] ANTONOPOULOS V Z, ANTONOPOULOS A V. Daily reference evapotranspiration estimates by artificial neural networks technique and empirical equations using limited input climate variables[J]. Computers and Electronics in Agriculture, 2017, 132: 86-96.
[21] KARBASI M. Forecasting of multi-step ahead reference evapotranspiration using wavelet- Gaussian process regression model[J]. Water Resources Management, 2018, 32(3): 1 035-1 052.
[22] JHAVERI S, KHEDKAR I, KANTHARIA Y, et al. Success Prediction using Random Forest, CatBoost, XGBoost and AdaBoost for Kickstarter Campaigns[C]//2019 3rd International Conference on Computing Methodologies and Communication (ICCMC). IEEE, 2019(2): 1 170-1 173.
[23] HUANG G M, WU L F, MA X, et al. Evaluation of CatBoost method for prediction of reference evapotranspiration in humid regions[J]. Journal of Hydrology, 2019, 574: 1 029-1 041.
[24] FAN J L, WU L F, MA X, et al. Hybrid support vector machines with heuristic algorithms for prediction of daily diffuse solar radiation in air-polluted regions[J]. Renewable Energy, 2020, 145: 2 034-2 045.
Comparing the Performance of GPR, XGBoost and CatBoost Models for Calculating Reference Crop Evapotranspiration in Jiangxi Province
LIU Xiaoqiang1,2, DAI Zhiguang1, WU Lifeng1*, ZHANG Fucang2, DONG Jianhua3, CHEN Zhiyue4
(1.College of water conservancy and ecological engineering, Nanchang Institute of Technology, Nanchang 330099, China; 2. Key Laboratory of Agricultural Soil and Water Engineering in Arid and Semiarid Areas, Ministry of Education, Northwest A&F University, Yangling 712100, China; 3. Faculty of Agriculture and Food, Kunming University of Science and Technology,Kunming 650500, China; 4. College of Hydrology and Water Resources, Hohai University, Nanjing 210098, China)
【】Alternate drought and waterlogging increasingly occurring in Jiangxi province means that rational irrigation strategies are required to safeguard its agricultural production.【】The objective of this paper is to select a suitable machine learning model to calculate reference crop evapotranspiration across the province.【】Meteorological data - including daily maximum (max) and minimum (min) ambient temperature, global solar radiation, extra-terrestrial solar radiation(s), relative humidity (RH) and 2m-height wind speed (U2) - were measured from 2001 to 2015 at 15 stations across the province; they were then used to train and test three models: Thegaussian process regression (GPR), the extreme gradient boosting (XGBoost), and the gradient boosting with categorical features support (CatBoost). We compared accuracy with empirical model for estimating the reference evapotranspiration.【】The meteorological factors that impacted the accuracy of the machine learning model for estimating0was ranked in the descending order as follows based on their significance:s>max>min>>2. Models usingmax,min,sand2gave the most accurate0estimate with0.2 mm/d. All three models have a good applicability by using limited meteorological data, and are superior to the traditional empirical model. In particular, GPR and CatBoost were more accurate, and GPR was most stable.【】In terms of complexity, accuracy and stability, GPR was the most suitable model for estimating reference crop evapotranspiration in Jiangxi province.
reference crop evapotranspiration; gaussian process regression; extreme gradient boosting; gradient boosting with categorical features support; empirical model
S274.1;S274.4
A
10.13522/j.cnki.ggps.2020056
1672 - 3317(2021)01 - 0091 - 06
2020-02-10
江西省教育厅研究项目青年基金项目(GJJ180952);江西省科技厅自然科学基金项目(20171BAB216051)
刘小强(1995-),男,江西进贤人。硕士研究生,主要从事节水灌溉理论与技术研究。E-mail: liuxiaoqiangyx@163.com
吴立峰(1985-),男,黑龙江阿城人。讲师,博士,研究方向为节水灌溉理论与技术研究。E-mail: china.sw@163.com
刘小强, 代智光, 吴立峰, 等. GPR、XGBoost和CatBoost模拟江西地区参考作物蒸散量的适应性研究[J]. 灌溉排水学报, 2021, 40(1): 91-96.
LIU Xiaoqiang, DAI Zhiguang, WU Lifeng, et al. Comparing the Performance of GPR, XGBoost and CatBoost Models for Calculating Reference Crop Evapotranspiration in Jiangxi Province[J]. Journal of Irrigation and Drainage, 2021, 40(1): 91-96.
责任编辑:韩 洋

