Evaluation of Ecological Environment Competitiveness of Hunan Province Based on Prefecture Level Cities
CAO Jian, LIU Wen-xiang, YANG Wen-lin, FU Xiao-hua*
1. Central South University of Forestry and Technology, College of Environmental Science and Engineering, Ecological Environment Management and Assessment Center, Changsha 410004, PRC;
2. Hunan Institute of Agricultural Information and Engineering, Changsha 410125, PRC
Abstract Based on the data of 13 eco-environmental indicators of 14 prefecture level cities in Hunan Province from 2014 to 2018, this paper quantitatively evaluated the eco-environmental competitiveness and its advantages and disadvantages by principal component analysis (PCA). The results showed that: (1) the overall ecoenvironmental competitiveness of Hunan Province was relatively high, whereas the competitiveness level of each city and prefecture was quite different. The comprehensive score of eco-environmental competitiveness of Changsha City was 2.96, ranking the first, and Zhangjiajie city ranking the last with a score of -1.60, which indicated that there was an obvious difference in the level of eco-environmental competitiveness among different regions. (2) The overall eco-environmental competitiveness of cities and prefectures in Western Hunan Province was weak. Among the 14 prefectures and cities in Hunan Province, the comprehensive scores of eco-environmental competitiveness of 6 prefectures and cities were negative, whereas the scores of Zhangjiajie, Xiangxi and Huaihua in Western Hunan were all lower than the others. In the face of increasingly serious environmental problems, cities and prefectures should adjust measures according to local conditions and put forward specific measures to enhance environmental competitiveness. In particular, cities and prefectures in Western Hunan should give full play to their advantages in ecological resources, take the path of green development, enhance the competitiveness of ecological environment, and provide support for local economic development.
Key words Hunan Province; Ecological environment competitiveness; Index system; Evaluation research
1. Introduction
With the rapid development of economy and society and the deepening of industrialization, the development and utilization of natural resources, pollution discharge and ecological damage were increasing day by day, resulting in the contradiction between ecological environment and economic as well as social development. Nowadays, the eco-environmental competitiveness had become the core competitiveness of the region. The key issues of regional development were to correctly understand and evaluate the regional ecoenvironmental competitiveness and formulate development strategies according to local conditions. Based on the existing research results, this paper collected the eco-environment related index data of 14 prefectures and cities in Hunan Province, improved the eco-environmental competitiveness model, and quantitatively evaluated its eco-environmental competitiveness with statistical methods, so as to provide reference for the formulation of ecoenvironmental policies in Hunan Province.
2. Research Methods, Data Sources and Index Selection
2.1. Research methods
The research on modern competitiveness started in the 1960s and 1970s. After more than 50 years of accumulation, the research field of competitiveness had been expanding and deepening, and had achieved fruitful results, especially in the comprehensive index system and analysis model, the research results were relatively mature[1]. However, the research on ecoenvironmental competitiveness had not yet formed a recognized and mature index system, and the index integration in water, soil, air and other aspects was relatively missing or with weak correlation[2]. Since the beginning of the new century, more and more scholars had paid attention to the study of ecoenvironmental competitiveness[3]. Domestic research had gradually moved from qualitative analysis to quantitative evaluation, from single method to a variety of means[4-11]. The more common methods were analytic hierarchy process (AHP)[12], intuitionistic fuzzy comprehensive evaluation, factor analysis[13], cluster analysis and principal component anal- ysis[14-17].
Combined with the existing literature research results and comprehensive comparison, according to the regional geographical characteristics and industrial status of Hunan Province, the principal component analysis method was selected and SPSS 23.0 was used for statistical analysis.
2.2. Data sources
The original data in the five years from 2014 to 2018 were mainly from the statistical departments of Hunan Province, cities and prefectures and various government bulletins. If there was no direct data, the calculation method was adopted. For example, if some cities and prefectures didn’t publish the urbanization rate of that year, the ratio of urban population to total population was used.
2.3. Index selection
5 first-class indicators including ecological resources (X1), environmental status (X2), economic society (X3), management response (X4), environmental protection potential (X5), and 13 second-class indicators including forest coverage rate (X1), actual cultivated land area at the end of the year (X2), water resources (X3), excellent rate of urban air quality (X4), output rate of land resources (X5), urbanization rate (X6), resident population (X7), proportion of annual income of environmental protection industry in GDP (X8), storage capacity of large and medium-sized reservoirs (X1), proportion of tertiary industry (X10), number of employees in environmental protection industry (X11), public transport (X12) and nature reserve area (X13), constituted the ecological environment competitiveness evaluation index system of prefectures and cities in Hunan Province.
3. Calculation Steps and Data Processing
3.1. Calculation steps
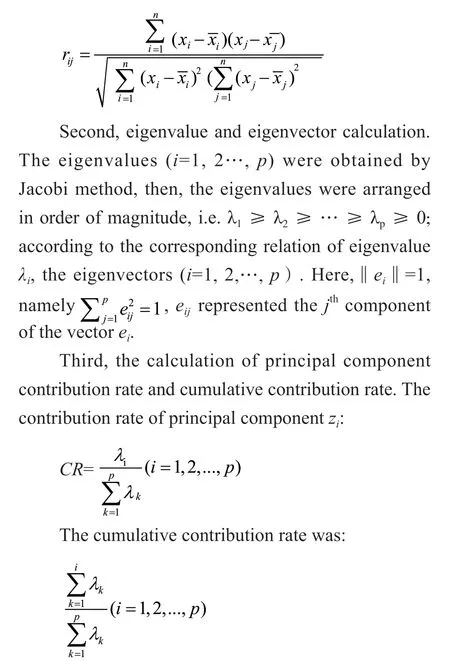
First, correlation coefficient calculation. The correlation coefficient was calculated according to the Pearson product moment correlation coefficient calculation method[18-19], and the calculation formula was as follows:

The selection of eigenvalues: generally, the eigenvalues with cumulative contribution rate above 85% were selected, and λ1, λ2, …λmcorresponded to the first, second, …, mth(m ≤p) principal component.
Fourth, principal component load calculation.


3.2. Data processing
3.2.1. Data description statistics and correlation matrix processing
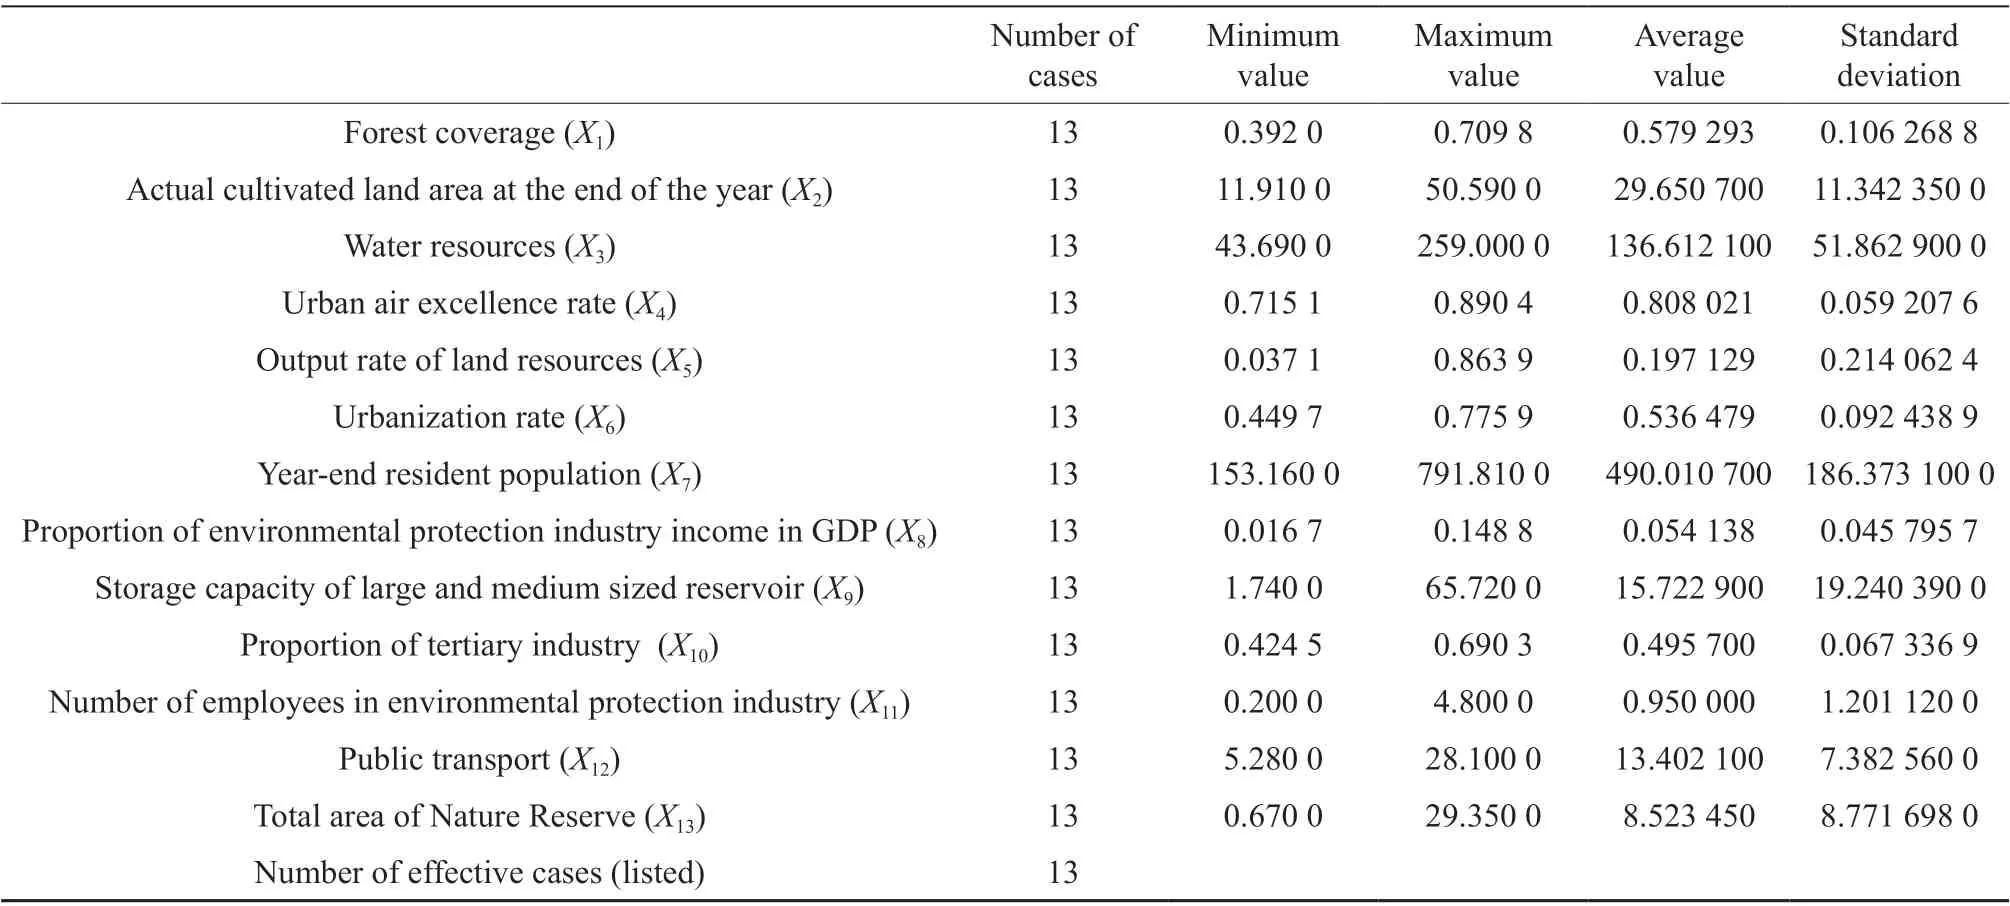
The original data were described and counted, then the data (variable values) were standardized, next, the dimension was reduced to get the correlation coefficient matrix of the original variables, and then the factor was extracted by principal component analysis (Table 1 and 2).
The closer the KMO value was to 1, it meant that the correlation between variables was stronger, and the original variables were more suitable for factor analysis; the smaller theSigvalue of Bartlett sphericity test was, the higher the significant level was (less than 0.05), the more the correlation between variables was (Table 3).
3.2.2. Calculation of common factor variance
The common factor variance represented how much information of each index was extracted in principal component analysis. Principal component analysis was was used to extract the information of each index.
3.2.3. Calculation of total variance
It can be seen from Table 4 that the cumulative superposition variance contribution rate of the first4 principal components was 80.781%, hence these 4 principal components would be used as comprehensive variables to evaluate the eco-environmental competitiveness of 14 prefectures and cities in Hunan Province.

Table 1 Data description statistics

Table 2 Correlation matrix

Table 3 KMO and Bartlett test
3.2.4. Construct component matrix
The component matrix (Table 5) was also called the factor load matrix, in which the factor load reflected the correlation importance of variables and common factors. The greater the absolute value was, the higher the degree of correlation was. The factor load matrix represented the coefficients of the expressions of all the original variables and common factors, and expressed the influence of the extracted common factors on the original variables, that was, the component matrix or factor load matrix.
3.2.5. Naming of principal components
The first principal component had a strong positive correlation with the output rate of land resources, urbanization rate, the number of employees in environmental protection industry, public transportation and other indicators, and had a strong negative correlation with the excellent rateof urban air, which was called social environmental competitiveness; the second principal component was positively correlated with the area of nature reserve, the area of cultivated land at the end of the year, the permanent population at the end of the year, and the amount of water resources, which was called resources and environment competitiveness; the third principal component had a strong positive correlation with the water storage capacity of large and medium-sized reservoirs and forest coverage rate, which was called environmental strength competitiveness; the fourth principal component was positively correlated with the proportion of the tertiary industry and negatively correlated with the income of environmental protection industry in GDP, which was called environmental benefits competitiveness.

Table 4 Explanation of total variance

Table 5 Composition matrix a
3.2.6. Component score calculation
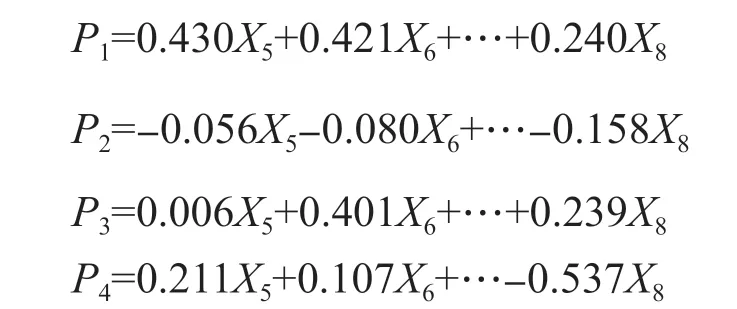
The component score coefficient matrix was obtained by dividing the principal component load matrix by their respective variances. According to the component score coefficient, the function of principal component score of 14 prefectures and cities in Hunan Province was obtained as follows:

Using the above scoring function, the principal component scores of sample areas could be calculated respectively:

4. Results and Analysis
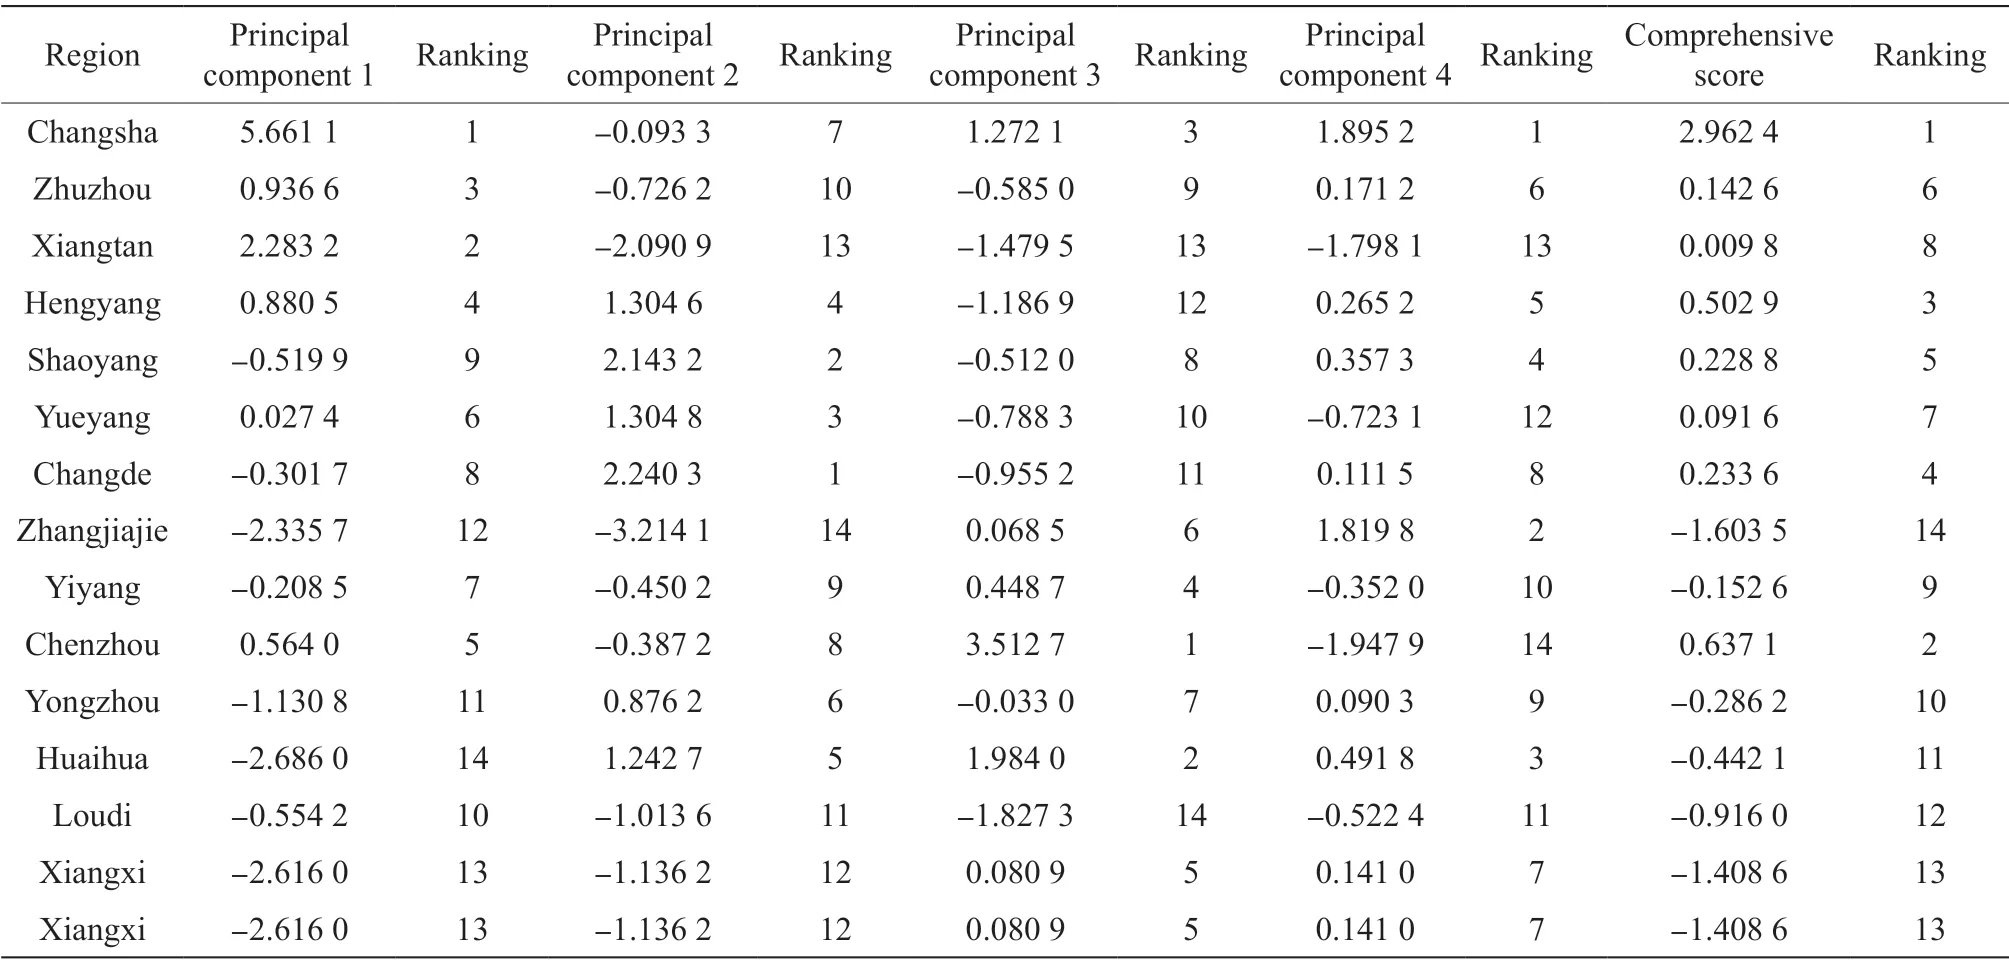
According to Table 6, Changsha, Chenzhou and Hengyang ranked the top, and there were more of the four principal components scored positive, indicating that the eco-environmental competitiveness of these three regions was higher than that of other regions in the province. As the capital of Hunan Province, Changsha had the highest score because of its high score of social and environmental competitiveness, obvious advantages in indicators such as land resource output rate, urbanization rate, number of employees in environmental protection industry, public transportation,etc., and the weight of the first principal component was as high as 35.94%, hence the comprehensive score was higher and ranking the top of the list; Chenzhou scored the highest in environmental strength competitiveness, indicating that it had obvious advantages in large and mediumsized reservoir water storage capacity and forest coverage rate; Hengyang had higher scores in social environment competitiveness, resources and environment competitiveness and environmental benefits, which indicated that its overall environmentalquality was high, whereas its environmental strength competitiveness score was low, which indicated that its reservoir space was small and its ability to resist natural disasters was poor.

Table 6 Score and ranking of ecological environment competitiveness in Hunan Province
Changde, Shaoyang, Zhuzhou, Yueyang, Xiangtan and Yiyang ranked in the middle, indicating that their overall environmental competitiveness was not so good. Changde scored the highest in the competitiveness of resources and environment, indicating that its natural resources were in good condition, and its advantages in the area of nature reserves and the total amount of water resources were obvious; Shaoyang scored higher in the competitiveness of resources and environment and environmental benefits, whereas lower in the competitiveness of social environment and environmental strength, indicating that Shaoyang lacked in environmental governance, development and investment; as a famous transportation hub city in China, Zhuzhou ranked top in terms of social and environmental competitiveness, it had outstanding industrial output value, high output rate of land resources and developed public transportation; Yueyang ranked higher in terms of resources and environment competitiveness, Yueyang City was close to Dongting Lake, with good natural resources, abundant water resources and numerous nature reserves; Xiangtan had a high score in the aspect of social environmental competitiveness. In the process of the integration of Changsha, Zhuzhou and Xiangtan, Xiangtan’s social economy had developed rapidly, and its high land resource output rate and urbanization rate had laid a foundation for its comprehensive environmental competitiveness; Yiyang had a higher score in environmental strength, and its achievements in water conservancy facilities construction were remarkable.
Yongzhou, Huaihua, Loudi, Xiangxi and Zhangjiajie ranked lower in terms of comprehensive scores, indicating that their overall environmental competitiveness was weak.Yongzhou and Huaihua did not rank high in the overall environmental competitiveness, and they had obvious disadvan- tages in the output rate of land resources, urbanization rate and public transportation, resulting in low scores in social environmental competitiveness, which directly affected their comprehensive environmental competitiveness. Loudi’s overall environmental competitiveness ranking was relatively low, and its industrial output value was high. It was necessary to change the mode of economic development, adhere to sustainable development, and enhance the score of social environmental competitiveness. Xiangxi had a low score in social environment and resource environment, nevertheless it ranked in the middle in environmental strength and environmental benefits. For Xiangxi, it was quite necessary to change the thinking of economic development and increase the proportion of tertiary industry in GDP. Zhangjiajie had a higher score in environmental benefits, whereas it had a lower proportion in the evaluation of environmental competitiveness, while it had a lower score in the social environment and resource environment which accounted for a relatively high proportion. Therefore, the overall score of its environmental competitiveness was not high.
5. Discussion
(1) The overall eco-environmental competi- tiveness of Hunan Province was relatively high, however, the competitiveness level of each city and prefecture was quite different. Changsha ranked first in terms of eco-environmental competitiveness, with a score of 2.962 4, and Zhangjiajie City scored -1.603 5; as the economic, political and cultural center of Hunan Province, Changsha City had developed high-tech industry and service industry. Zhangjiajie City mainly focused on tourism, and the tertiary industry was developed. Nevertheless, its area was small, the population was small, and other resources were relatively scarce. Therefore, its comprehensive environmental competitiveness was weak. The overall eco-environmental competitiveness of Western Hunan Province was weak. Cities and prefectures in Western Hunan should give full play to their advantages in ecological resources, enhance the competitiveness of ecological environment, and take the path of characteristic development to provide support for local economic development.
(2) The competitiveness of ecological environ- ment was closely related to the level of economic development. It was not difficult to see that the ecological environment competitiveness of Changsha ranked first in terms of its comprehensive competiti- veness, which was closely related to its higher economic development. Zhangjiajie, Xiangxi and Loudi ranked lower in the economic development of Hunan Province, which also had an important impact on their ecological environment competitiveness ranking; Zhangjiajie had a small area, a single economic development model, mainly tourism, small economic aggregate, and relatively low comprehensive ranking. Therefore, the economic development level of each region had an important impact on its ecoenvironmental competitiveness.
Facing the increasingly serious environmental problems, the cities and prefectures of Hunan Province should adjust measures to local conditions, put forward specific measures to enhance environmental competitiveness, and suit the remedy to the case. In the study, we can see that the number of employees in the environmental protection industry, the output rate of land resources, the urbanization rate, public transportation, the excellent rate of urban air were relatively high in the study, it was necessary for each region to adjust the industrial development mode, change the extensive economic development path, and improve the output rate of land resources. Increasing the number of employees in the environmental protection industry, enhancing the livability and comfort of residents, improving the urbanization rate, improving the public transportation and improving the urban air quality could not only promote the sustainable development of regional economy, but also play an important role in improving the local environment and enhancing the overall ecological environment competitiveness of the region.
 Agricultural Science & Technology2020年3期
- Agricultural Science & Technology的其它文章
- A Study on Combining Ability and Heritability of Agronomic Trait of Indica Hybrid Rice
- Breeding of High Quality Indica CMS Line Xinlong A
- Effects of Biological Bacterial Fertilizer on Carbon Metabolism Characteristics of Rhizosphere Soil Bacteria in Rice
- Feasibility of Wheat Bran as the Sole Nutrient Source of Platymonas helgolandica var. tsingtaoensis
- Effects of Different Phosphorus Application Rate on the Growth and Development, Yield and Quality of Tobacco in Yongzhou Area
- Influence of Shape and Size of Threshing Frame and Tobacco Grade on Leaf Strip Structure
