Ship speed power performance under relative wind profiles in relation to sensor fault detection
Lokukaluge P.Perera ,B.Mo
a UiT The Arctic University of Norway, Tromso, Norway
b SINTEF Ocean, Trondheim, Norway
Abstract
Keywords: Speed power performance;Data anomaly detection;Sensor fault identification;Weather routing;Statistical data analysis;Ship wind profile.
1.Introduction
The international Maritime Organization (IMO) and other related authorities have enforced to implement energy efficient ship operational conditions under various emission control measures [1,2] in the shipping industry.The main objective of these emission control based energy efficiency approaches is to reduce a considerable amount of bunker fuel usage by improving vessel performance [3].That can eventually minimize ship emissions and related environmental pollutants due to the shipping industry.Pre-planned ship routing with respect to weather forecast plays an important role in reducing the respective fuel consumption of vessels (IMO,1999),often categorized as "Weather routing" [4].That has also been considered as another emission control based energy efficiency measure.Weather routing is often planned in modern electronic chat display and information systems (ECDISs) under integrated bridge systems (IBSs) with respect to weather forecast,i.e.decision support systems [5-7].In general,the weather forecast used by such systems consists of predicting the state of the atmosphere for a given location at a given period (i.e.6 to 16 days).Such weather predictions are calculated by various atmospheric mathematical models associated with meteorological statistical analyses [8].As the first step of this process,the past and present atmospheric pressure data that are collected by various satellites and global weather observation centers are used to derive the respective global wind maps.As the second step,the same global wind maps are used to derive the required weather forecast by considering the respective mathematical models of wave,ocean and tidal current,ice,atmospheric pressure and temperature conditions.The erroneous data conditions in wind information can introduce additional challenges in weather forecast.e.g.an initial error of 16% in wind speed can accumulate a final error of 25-30% in predicted wave heights [9],therefore accurate weather forecast can only be achieved by reliable wind information.Weather forecast can consist of various parameters,such as wave heights,mean/peak periods and directions,mean wind speed and direction,mean tidal/current speed and direction,ice and temperature conditions.Weather routing uses such weather parameters with ship performance models to calculate optimal ship routes under estimated time of departure (ETD) and estimated time of arrival (ETA) values.One should note that the global wind distribution plays the most important role in forecasting such weather parameters and that can influence on pre-planned ship routes (i.e.weather routing).
2.Ship performance and navigation conditions
2.1.Ship performance quantification
Several important ship performance measures that relate to weather routing type applications are considered in this section.Not only hull and superstructure resistance but also undesirable vessel motions due to various weather conditions degrade ship performance.Hence,weather routing focuses on reducing both ship hull and superstructure ship resistance and undesirable vessel motions.However,many weather routing applications can be limited to ship resistance calculations due to the complexities in capturing un-desirable vessel motions under various mathematical models.In general,ship resistance consists of four main components:frictional and residual resistance,encounter wave resistance and wind resistance.Frictional and residual resistance relates to the underwater section and air resistance relates to the overwater section of the vessel.Furthermore,ship resistance further increases due to encounter wave conditions and undesirable vessel motions.Wind resistance contributes 2-10% of total ship resistance[10] and relates to ship speed,superstructure area of the vessel,relative wind (i.e.apparent wind) speed and direction[11,12].Even though wind resistance calculations have been considered under weather routing type applications,the respective effects on ship resistance can be minimal compared to wave resistance.There is less attention on wind profiles under weather routing type applications due to the same reasons.
Wind profiles (i.e.global wind maps) are used to create the environmental models of wave,ocean and tidal current,ice,atmospheric pressure and temperature conditions as mentioned before.Therefore,this study also proposes to use the relative wind profile along a ship route to evaluate vessel speed and power performance under weather routing type applications by assuming the respective sea states relate to relative wind conditions.These weather routing type applications use various optimization algorithms,which estimate the required speed power profile under weather forecast in pre-voyage conditions [13].Since this study proposes to use only the relative wind profile along the ship route to calculate vessel speed power performance,that approach can also reduce the computational complexities in the respective optimization algorithms.Hence,such simplified optimization algorithms can lead to better results in predicting ship speed and power performance.In addition,ship speed and power performance under the respective wind profiles can be complemented with model tests and sea trial results.
In general,ship model tests and sea trials are conducted under calm water conditions,where the required ship power/thrust levels for a selected range of ship speeds are calculated.The same experiment results can be extrapolated into rough weather situations,where the respective vessel speed reductions due to the variations in ship resistance,power/thrust conditions and propulsion efficiency can be calculated.Furthermore,the same results can be verified under actual sea trail results and that consist of measuring the required ship speed and power values under various wave and wind conditions.Ship navigation under wind and wave conditions is often identified as seakeeping,where various interactions among ship power,speed,motion and weather conditions are encountered.Ship performance and navigation data under various weather conditions are collected by onboard sensors and data acquisition systems to observe the actual sea keeping capabilities of vessels [14,15].
The respective weather effects in ship speed and power performance can be identified realistically by these sea trial data.Wind and wave conditions are the primary factors that influence on ship speed power variations as mentioned before.In general,head wind and wave conditions reduce ship speed and following wind and wave conditions can improve ship speed slightly in some navigation situations.However,high absolute wind and wave conditions around a vessel can reduce the propeller thrust and increase the drag from steering corrections.Therefore,wave and wind forecast around a ship is an essential part in predicting accurate ship speed and motion conditions (i.e.heave,pitch and roll motions) along a voyage.Such situations are further investigated in this study.
2.2.Recent studies
Many challenges can be encountered in handling ship performance and navigation data that are collected under onboard sensors and data acquisition systems.These challenges are often presented in the recent literature under various data analyses.Data analysis for an inland river ship in relation to its operational energy efficiency is presented in [16].A performance evaluation approach for a steam-propelled merchant ship by collecting the respective data is presented by[17].In addition,several studies on data analyses of fuel usage for ship operations are presented by [18-20].A study on statistical analysis performed on the data sets collected from sea trials of a small training ship is presented in [21].A study on full-scale data analysis for a passenger ferry to evaluate its performance is presented in [22].Furthermore,these studies are integrated with port performance evaluation systems in some situations [23].However,these studies ignore the challenges that are associated with the respective sensors and data handling approaches.e.g.the scattering effects and other data anomalies due to rough weather conditions [24].If these issues (i.e.erroneous data conditions) in the sensors and data handling approaches have not been identified properly,that can degrade the results of ship performance and navigation data analysis.Hence,this study not only presents the outcome of statistical data analysis of ship performance and navigation data but also the issues that are associated with sensors and data handling approaches.Furthermore,the solutions to such situations,i.e.data anomalies,in vessels are also proposed,where various methodologies to overcome erroneous data conditions are illustrated.That can be done by introducing appropriate data visualization methods to capture proper and abnormal data regions.The proper data regions can be used to identify the respective ship performance and navigation conditions and the abnormal data regions can be used to identify various data anomalies.
2.3.Data visualization
A considerable amount of work in this study focuses on various visualization methods due to the same reason.There are several contributions that can be observed from data visualization approaches [25].The main contribution is the information extraction that can capture proper and abnormal regions from ship performance and navigation data sets.One should note that a considerable amount of domain knowledge in shipping may require to do this data classification:proper and abnormal data regions.The proper and abnormal data regions can be used to identify ship performance and navigation conditions and various data anomalies,respectively.The main contribution of this study is to visualize proper data regions and extract relevant information to quantify ship performance and navigation conditions [26,27].Furthermore,data anomaly detection can also be considered as another contribution in this study and such anomalies can further be divided into sensor faults and system abnormal events [28,29].Therefore,this study focuses to develop data visualization methods for ship performance and navigation data sets to support the required analyses.The outcomes of such data analyses can be used to evaluate ship performance and reduce respective emissions.
2.4.Ship emission considerations
Chemical energy in bunker fuel is converted to mechanical energy by marine engines (i.e.marine power plant) that drive ship propellers to generate required ship speeds.These marine engines consist of various mechanical and electrical energy losses,therefore energy recovery and emission reduction approaches (i.e.exhaust recirculation and heat recovery)have been considered to improve ship performance.Exhaust emissions is the outcome of the combustion process of marine engines,where various external exhaust gas cleaning systems are used.In general,these external exhaust gas cleaning systems can be categorized as scrubber technology to reduce SOx emissions and selective catalytic reduction (SCR) technology for NOx emissions.Exhaust gas recirculation (EGR)and heat recovery applications improve ship performance and low temperature combustion processes with multi-fuel engine technology (i.e.various fuel types) have also been considered to reduce exhaust emissions.Multi-fuel engine technology (i.e.with liquefied natural gas (LNG),heavy fuel oil(HFO) or marine diesel oil (MDO)) can also be a flexible solution that extensively uses to satisfy various emission control requirements in shipping [30-34].
Mechanical energy generated by marine engines transfers to ship propellers to create required ship speeds.However,additional mechanical energy losses can occur due to the propeller efficiency because of its fouling and cavitation conditions.The propulsion thrust generates the required ship speeds.Ship resistance can be categorized as the net force opposing to this propulsion thrust and that relates to vessel speed,draft and trims values and wind,wave,ocean and tidal current conditions.Furthermore,additional environmental factors (i.e.water depth and river banks) can also influence on this ship resistance especially in confined waters.Therefore,ship resistance in such situations can also introduce additional energy losses in vessels and the same along a vessel navigation path should be considered to develop appropriate data driven models [35],where that can be used towards weather routing type applications.It is believed that data visualization can be the first step that should be implemented to develop such models.Furthermore,the classification between proper and abnormal data regions can also play an importance role in developing such models,where the quality of the respective data sets can influence the model accuracy [36].The proper data regions can be used to derive various relationships among ship performance and navigation parameters and that can make the basic foundation for such models that often have been categorized as digital models due to their discreteness in system states [35].However,the maturity of such data driven models to capture energy efficient vessel operational conditions is yet to be achieved in the future.Vessel performance and navigation parameters along a navigation path that relate to ship speed power conditions with respect to relative wind profiles are considered in this study and that can be an initial step towards such data driven models.These parameters are statistically analyzed,and the results are presented appropriately to evaluate vessel performance,even under various data anomalies,i.e.erroneous data conditions.
3.Data analysis
3.1.Vessel information
A data set of ship performance and navigation parameters from a selected vessel is analyzed in this study.The vessel is a bulk carrier with following approximate particulars:ship length:230 (m),beam:30 (m),gross tonnage:40(tons),deadweight at max draft:73 (tons).The vessel is powered by 2-stroke main engine (ME) with maximum continuous rating (MCR) of 7600 (kW) at the shaft rotational speed of 100 (rpm).Furthermore,the vessel has a fixed pitch propeller diameter 6 (m) with 4 blades.The data points are collected with 15 (min) sampling intervals with instance values.
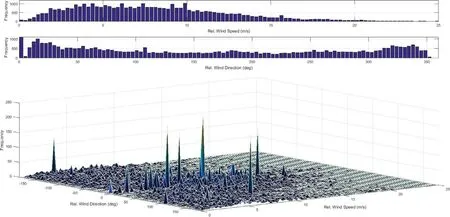
Fig.1.Relative wind profile of the ship.
3.2.Relative wind distribution
To consider ship speed power performance with respect to relative wind conditions,the following vessel parameters are considered [37,38]:speed through water (STW),speed over ground (SOG),main engine (ME) power and relative wind speed and direction.It is assumed that the respective relative wind profiles (i.e.speeds and directions) relate to the encountered sea conditions of the vessel as mentioned before,therefore added ship resistance increases due to high wind and wave conditions in such situations.The relative wind profiles relate to the encountered sea states as described in Beaufort scale [39].These high wind conditions can often create high waves,therefore the wind distribution along a ship route can be used to evaluate vessel speed power performance.However,the respective data should be visualized,appropriately to extract the respective information in ship performance and navigation conditions.Firstly,statistical data analysis of the relative wind distribution of the vessel is visualized.The respective histograms for relative wind speeds and directions are presented in the top two plots of Fig.1.The relative wind speed and direction profiles vary from 0 (m/s) to 25(m/s) and 0 ° and 360 °,respectively.The combined histogram(i.e.two dimensional) of the same parameters is presented in the bottom plot of the same figure.One should note that a two-dimensional histogram approach of the relative wind (i.e.apparent wind) profile of this vessel improves the information visibility,considerably.Such approach has not been used by the shipping industry,previously to the author’s knowledge.The starboard and port relative wind directions are presented from 0 ° to 180 ° and 0 ° to −180 °,respectively.One should note that 0 ° represents mean head winds.Several data peaks are noted especially around 0 ° relative wind angle in this visualization approach and that has been categorized as possible data anomaly regions.Further details on such data anomalies have been presented in the future sections of this study.
The top views of the same plot with respect to ship STW and SOG values are presented in the left and right plots of Fig.2.A majority of high STW and SOG values are located near the zero relative wind angle,i.e.head-wind conditions,due to relative motions of the vessel.The respective contours are also presented in these plots,where the same data peaks that are categorized as possible data anomalies can also be noted.One should note that these data peaks may also relate to data scattering effects that are discussed,previously.As the next step of this study,the respective reasons for these data peaks are investigated.The sensor data of the relative wind direction range from (0 ° to 2 °) with the respective wind speed values (i.e.with respect to the number data points)are presented in top and bottom plots of Fig.3.The results show that the relative wind speed values are often repeating within this wind direction range.In general,the wind speed values should not repeat for such long time periods due to the sensor noise.One should note that sensor noise can introduce small parameter variations into the respective measurements and that can eliminate the possibility of having repeated values.It is believed that high vibration conditions encountered by the wind sensor may have resulted in these repeated data points.Therefore,the wind speed values may have been frozen in such situations and the digital data acquisition system has repeated the same values.
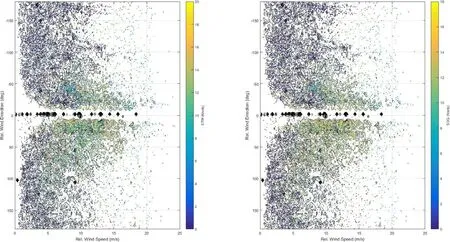
Fig.2.Relative wind profile with STW and SOG.

Fig.3.Erroneous data wind sensor data.
However,the wind sensor is the only sensor that has encountered this type of data anomalies.These repeated values are noted as data anomaly regions and those data intervals are removed from the respective data set,where an algorithm is developed to remove such data intervals.One should note that combined histograms can be used to observe such sensor related data anomalies and that cannot be observed under single parameter histograms.Therefore,the identification of such sensor related anomalies is one contribution of data visualization,as mentioned before.It is assumed that the vessel is symmetrical around the centerline,therefore the wind profile data without data anomalies from both starboard and port side are combined in the following step.The resulted combined histogram for relative wind speeds and directions is presented in Fig.4.As presented in the figure the respective data peaks disappeared and a smooth surface compared with the pervious plot can be noted.Furthermore,a higher gird size in the data plot is also selected to improve the information visibility.The top view (i.e.contour plot) for the same figure with the respective STW is presented in Fig.5.One should note that high and low relative wind speed values are allocated towards head (i.e.0 °) and following (i.e.180 °) relative wind directions of the vessel,respectively.Since this study evaluates ship speed power performance under relative wind profiles,vessel slow moving situations (i.e.maneuvering) are ignored from the data analysis.E.g.ship speed values less than 3 (knots) are considered as maneuvering situations,and those values are removed from this data set to improve the information visibility.Hence,the same data plot with ship speed values greater than 3 (knots) is presented in Fig.6.The same situation as a combined histogram of relative wind directions and speeds is presented in Fig.7.A smooth data surface compared with Fig.4 is noted in this figure and a considerable number of data points are allocated near ship heading (i.e.0 °) relative wind direction.Furthermore,relative wind speeds approximately 5 (knots) or above are encountered by the vessel (i.e.encounter angle is less than 90 °) in a number of ship navigation situations.Therefore,this vessel feels head wind conditions in such ship navigation situations.

Fig.4.One sided relative wind profile (cleaned data).
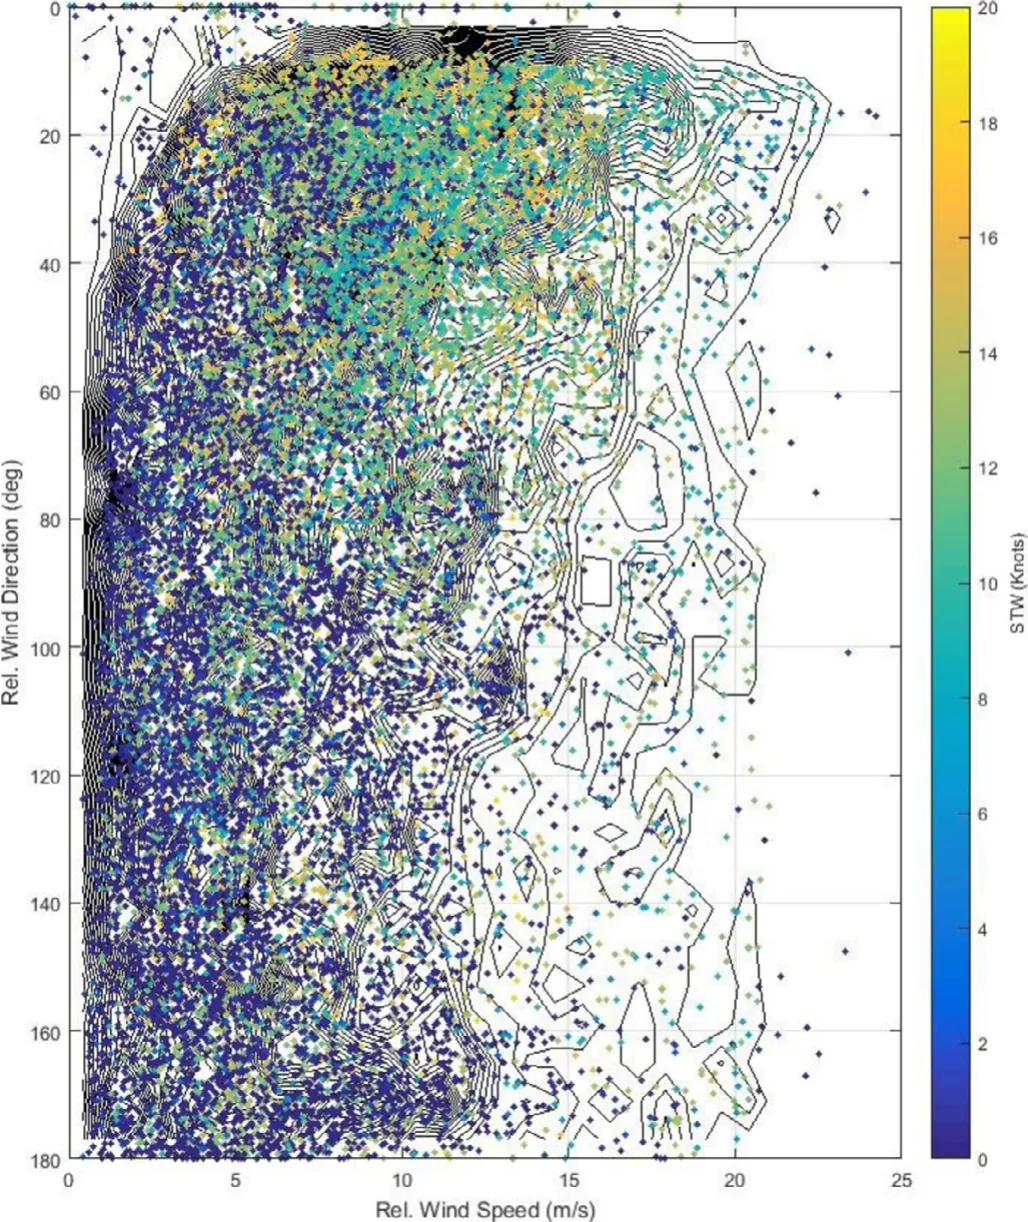
Fig.5.One sided relative wind profile with STW.
3.3.Ship speed power performance
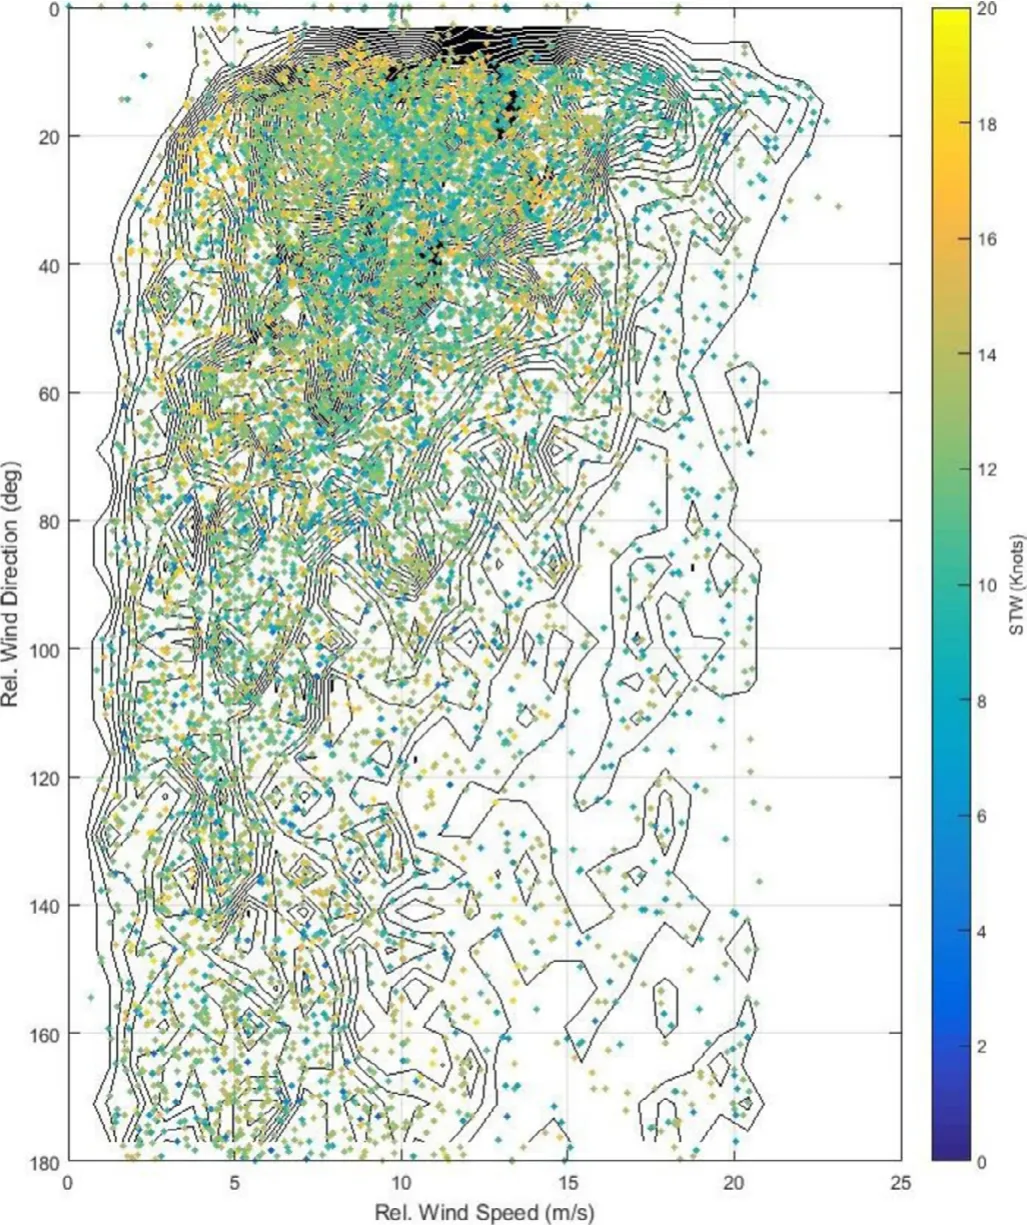
Fig.6.One sided relative wind profile (cleaned data).
The next step in this statistical data analysis starts with ship speed power performance parameters [40].The histograms for STW and SOG for the same vessel are presented in the top and middle plots of Fig.8.Considerable variations among STW and SOG data distributions are noted in these results and tidal and ocean currents may influence on these ship speed variations.The histogram for the respective speed differences (i.e.STW-SOG) is presented in the bottom plot of Fig.8.The result shows two continuous statistical distributions approximately from −8 (knots) to −5.5 (knots) as a minor distribution and −5.5 (knots) to 6 (knots) as a major distribution in the same figure.In general,the main statistical distribution from −5.5 (knots) to 6 (knots) (i,e,window P)is a reasonable distribution,if the vessel is navigation under tidal and oceans current conditions.However,the minor statistical distribution from −8 (knots) to −5.5 (knots) is a possible but highly improbable situation,where tidal and oceans currents may have influenced.It is concluded that either this ship was navigating under high tidal current conditions or the STW sensor was creating a data anomaly region in this situation.

Fig.7.One sided relative wind profile (cleaned data).

Fig.8.Ship speeds:STW,SOG and STW-SOG.

Fig.9.Speed power profile with Rel.Wind speed and angle.
The combined histogram for STW and ME power values is presented in Fig.9.A general speed power profile for a vessel is noted in this figure with several unusual data regions.It is observed that the unusual data region P relates to the minor statistical distribution (approximately from −8 (knots)to −5.5 (knots)) in the bottom plot of Fig.8.Therefore,this region is also marked as data window P in Fig.9.One should note that the vessel is navigating relatively slow STW with high ME power conditions in this data region.

Fig.10.STW-SOG vs.Rel.Wind speed and direction.
The speed differences between STW and SOG values vs.respect to relative (Rel.) wind direction with respect to relative (Rel.) wind speed are presented in Fig.10.This data plot is created to further investigate data region P (i.e.−8(knots)<STW-SOG<−5.5 (knots)).The results show that a majority of data points,located in region P,appears under starboard beam relative wind conditions (i.e.moderate relative wind speeds).This is an unusual situation,therefore that is categorized as a sensor fault situation,where the ship speed sensor is reading some erroneous values due to specific wind conditions.One should note that such wind conditions can also relate to specific wave conditions and that may have created such sensor fault situations.Therefore,this data region(i.e.window P) is considered as an erroneous data condition and removed from the selected data set.This erroneous region is ignored from the general speed power calculations,i.e.a reasonable approximation.
The respective top view (i.e.contour plot) for the same distribution with relative wind speeds is presented in Fig.11.The top view of the same plot as a modified data set (i.e.without data anomaly region,window P) with relative wind speeds is presented in Fig.12.As presented in the figure,the unusual data region (i.e.data window P) is disappeared from this data set.Both plots consist with relative wind speeds.The results show that vessel speeds decrease due to high relative wind speeds for the same ME power levels,i.e.due to the increased ship resistance in rough sea conditions.The same figure with a higher grid scale for STW and ME power values is presented in Fig.13.A smooth data surface is observed in this figure compared to Fig.9 due to the removal of data anomaly regions.Therefore,this wind profile along the voyage can be used to identify engine power requirements and evaluate the performance of the vessel.This is based on appropriate data visualization approaches,where the respective ship performance and navigation parameters can be observed with respective the relative wind conditions.Furthermore,such wind conditions can be a good representation for the respective weather conditions encountered by vessels.Furthermore,favorable weather conditions along ship routes can be selected in voyage planning type applications by considering the same information.
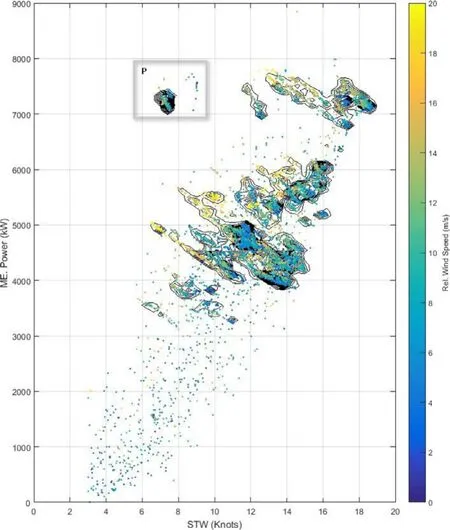
Fig.11.Ship speed power profile with relative wind speed.
A comparison between STW and SOG values is considered in Fig.14.A combined histogram for STW and SOG values is presented in the bottom plot.The respective contour plot and the same with ME power are presented in the top left and right plots of the same figure.Data window P is also noted in these plots and one should note that higher ME power values are associated with the same region.Similarly,this data region (i.e.data window P) is associated with lower STW values for higher SOG values.Therefore,this data region is observed as a sensor fault situation,i.e.data anomaly regionand it is further confirmed since the same region is associated with higher fuel consumption.An approximately linear relationship between STW and SOG values is noted until 12 (knots) of STW values in the same figure.An approximately constant SOG values for STW from 12 (knots) to 14 (knots) is also observed in the same plot.Another approximately linear relationship between STW and SOG values is noted from 14 (knots) to 20 (knots) of STW values.The SOG values are lower than the respective STW values in these regions,where the vessel is navigating against ocean and tidal current conditions with higher engine power.One should note that higher STW/SOG values are associated with higher ME power values for this vessel (see top right plot of the same figure).These SOG and STW discreate linear relationships are marked as line segments in the top left plot of the same figure and that can be a representation of the respective parameter correlations.Such parameter correlations can be used to develop an appropriate mathematical model for ship performance monitoring,as discussed before [41].
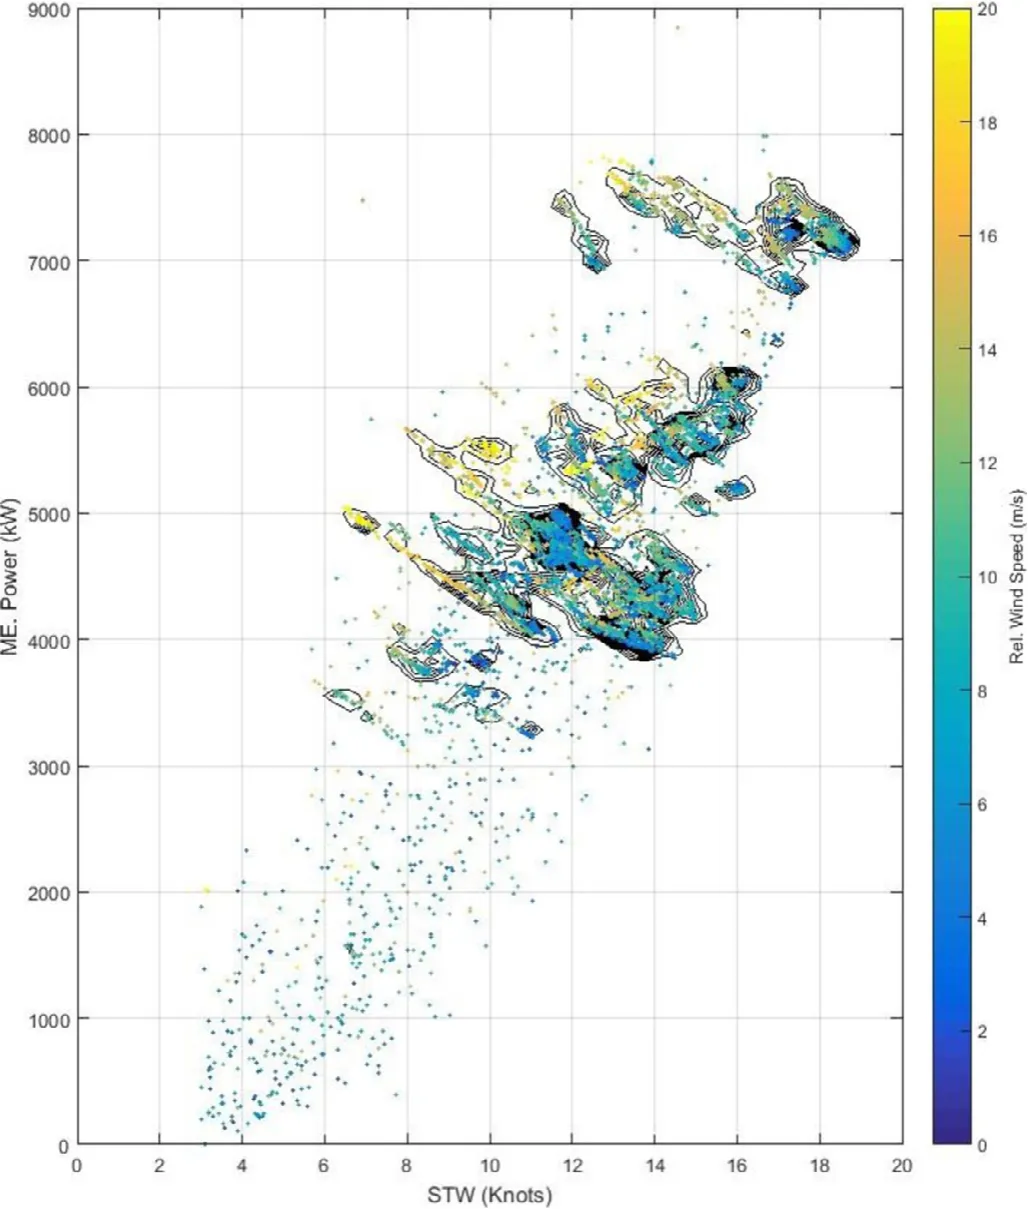
Fig.12.Ship speed power profile with relative wind speed |STW-SOG| < 5.5 (knots).

Fig.13.Modified Speed power profile.
Finally,the modified data set (i.e.erroneous data intervals(data anomalies) are removed) of ship performance and navigation parameters is presented in Fig.15.The total number of data points is divided into four plots to improve data visualization,where adequate information on ship performance and navigation conditions can be observed and the same observations,i.e.parameter relationships,can be used to develop appropriate mathematical models.The figure consists of the following ship speed power parameters:STW,SOG,rel.wind speed and ME power (i.e.scaled).One should note that less data scattering situations are observed in these plots due to the proposed data anomaly identification and isolation,i.e.data cleaning,approaches.Therefore,a better overview of ship speed-power performance can be visualized in these results.The vessel is maintaining constant ME power values for these voyage segments resulted in constant STW values.Hence,the vessel is also maintaining constant SOG values due to the same reason in some navigation situations.The results show possible relationships among the respective parameters at the selected data windows (A,B,C,and D) and such relationships are further elaborated in the following section.
The first part of data window A represents a constant ME power situation with respect to STW and SOG values under low relative wind speeds.Hence,the STW values are lower than the SOG values in this situation due to calm weather conditions.The second part of the same data window has relatively low ME power values,where reduced STW and SOG values are noted.However,the STW and SOG values for the same ME power level are reduced considerably in the last part of the same data window due to high wind speeds,i.e.rough weather conditions.The first part of data window B represents an approximately constant high ME power level with respect to the STW and SOG values under high relative wind speeds.Reduced relative wind speeds are noted in the last part of the same window,where the respective STW and SOG values are also improved,considerably due to calm weather conditions.A considerable increase in relative wind speeds is observed in data window C,therefore the respective STW and SOG values are decreased due to the related rough weather conditions.However,the ME power level has also been increased by the vessel in this situation to improve ship speeds.Similarly,data window D represents a situation,where the relative wind speed values are changed from low to high values,therefore the respective STW and SOG values are also decreased.Hence,the figure summarizes the parameter relationships among STW,SOG,rel.wind speed and ME power values and the results can be used to develop appropriate mathematical models.Such model will eventually support weather routing type applications,where the wind profiles along ship routes can be used to identify the engine power requirements and evaluate the performance of the vessel [42].
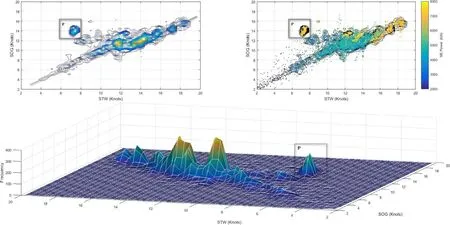
Fig.14.SOG and STW profiles.
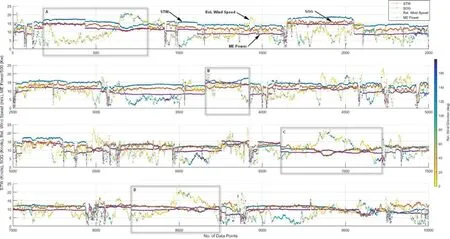
Fig.15.Ship performance data.
4.Conclusions
In general,the parameter of ME power is proportional to the cube of the ship speed,i.e.STW and SOG values.The STW and SOG values decrease,significantly for the same ME power under high relative wind speeds and that may further complicate ship speed-power relationships as visualized in the results.Such complex relationships among ship performance and navigation parameters (i.e.STW,SOG,ME power and relative wind speeds) are observed in this data analysis.Furthermore,data anomaly detection and isolation,i.e.sensor fault detection and data cleaning,have also been implemented during the same analysis to improve the information visibility.Therefore,those approaches can be considered as the main contribution of this study.Even though various data analyses are presented in the literature with respective to ship navigation under ocean wind and wave conditions [43],the combined approach (i.e.statistical data analysis and sensor fault identification) has not been illustrated in those studies,adequately.It is also believed that such a combined approach can be used to detect the respective anomaly conditions,specially.
This study has investigated the relationships among vessel performance and navigation parameter and the relative wind profile by assuming relative wind conditions represent the sea state in the respective ship navigation area.Relative wind speed influences on the ship speed power requirement and such relationships can be used to develop appropriate mathematical models,as mentioned previously,to evaluate vessel performance.Furthermore,associated data anomalies can also be identified and removed from the respective ship performance and navigation data sets and that can further improve the respective mathematical models [44].Such models can be used in weather routing type applications [45,46] and that may simplify the computational complexity in the optimization algorithms.One should note that the vessel wind profile along the respective ship route can be used to estimate required ship STW,SOG and ME power values,approximately in weather routing type approach.Similarly,the same results can also be used to determine optimal ship routes,orientations,and suitable engine power configurations by considering ship design characteristics under forecasted and actual weather conditions in the same applications [47,48].
Acknowledgements
This work has been conducted under the project of “SFI Smart Maritime (237917/O30)-Norwegian Centre for improved energy-efficiency and reduced emissions from the maritime sector” that is partly funded by the Research Council of Norway.An initial version of this paper is presented at the 3rd International Conference on Maritime Technology and Engineering (MARTECH 2016),Lisbon,Portugal,July 2016.
 Journal of Ocean Engineering and Science2020年3期
- Journal of Ocean Engineering and Science的其它文章
- Development of current-induced scour beneath elevated subsea pipelines
- Optimization approach for a climbing robot with target tracking in WSNs
- The effect of gravity and inclined load in micropolar thermoelastic medium possessing cubic symmetry under G-N theory
- New analytic solutions of the space-time fractional Broer-Kaup and approximate long water wave equations
- Efficient numerical scheme based on the method of lines for the shallow water equations
- Comparing the force due to the Lennard-Jones potential and the Coulomb force in the SPH Method
