
Strategies for PET imaging of the receptor for advanced glycation endproducts(RAGE)
2020-11-09 01:05:40LinsyDrkAllnBrooksJnllStuffPhillipShrmnJnnArtgRobrtKoppAimTimothyMontvonMrSknPtrSott
Linsy R.Drk,Alln F.Brooks,Jnll Stuff,Phillip S.Shrmn,Jnn Artg,Robrt A.Kopp,Aim R,Timothy J.Montvon,Mr B.Skn,Ptr J.H.Sott,*
aDepartment of Radiology,University of Michigan,Ann Arbor,MI,48109,USA
bDepartment of Medicinal Chemistry,University of Michigan,Ann Arbor,MI,48109,USA
cAbbVie Process Chemistry,North Chicago,IL,60064,USA
dAbbVie Centralized Medicinal Chemistry,North Chicago,IL,60064,USA
eAbbVie Translational Imaging,North Chicago,IL,60064,USA
Keywords:
RAGE
Neuroimaging
Positron emission tomography
Radiochemistry
Neuroin flammation
ABSTRACT
The implication of the receptor for advanced glycation end-products(RAGE)in numerous diseases and neurodegenerative disorders makes it interesting both as a therapeutic target and as an inflammatory biomarker.In the context of investigating RAGE as a biomarker,there is interest in developing radiotracers that will enable quantification of RAGE using positron emission tomography(PET)imaging.We have synthesized potential small molecule radiotracers for both the intracellular([18F]InRAGER)and extracellular([18F]RAGER)domains of RAGE.Herein we report preclinical evaluation of both using in vitro(lead panel screens)and in vivo(rodent and nonhuman primate PET imaging)methods.Both radiotracers have high affinity for RAGE and show good brain uptake,but suffer from off-target binding.The source of the off-target PET signal is not attributable to binding to melatonin receptors,but remains unexplained.We have also investigated use of lipopolysaccharide(LPS)-treated mice as a possible animal model with upregulated RAGE for evaluation of new imaging agents.Immunoreactivity of the mouse brain sections revealed increases in RAGE in the male cohorts,but no difference in the female groups.However,it proves challenging to quantify the changes in RAGE due to off-target binding of the radiotracers.Nevertheless,they are appropriate lead scaffolds for future development of 2nd generation RAGE PET radiotracers because of their high affinity for the receptor and good CNS penetration.
1.Introduction
The receptor for advanced glycation end-products(RAGE)is a 35 kDa transmembrane receptor in the immunoglobulin-G family that has been recently investigated for its possible role in inflammatory cascades in both the central nervous system(CNS)and periphery.It was described based on its first recognized ligands,advanced glycation end-products(AGEs)[1].AGEs are nonenzymatically glycated macromolecules such as proteins,peptides,deoxyribonucleic acid(DNA)and lipids,and the modificationsoccur in oxidative environments in the presence of glucose,which provides a logical explanation for involvement of the receptor in diabetes and related neuropathies.RAGE dysfunction has also been implicated in chronic obstructive pulmonary disease(COPD),Alzheimer’s disease(AD),cancer and other diseases associated with inflammation[2].Cellular experiments,using both endothelial and smooth muscle cells with lipopolysaccharide(LPS)stimulation,confirmed that the RAGE gene is regulated by NF-κB[3].
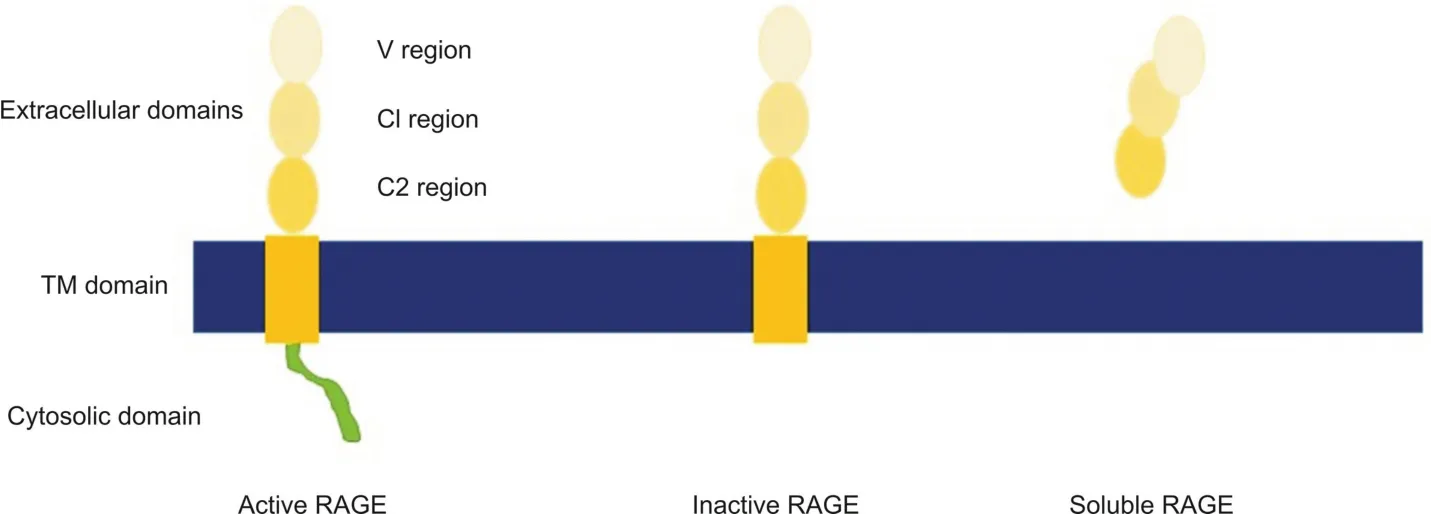
Fig.1.RAGE domains and common isoforms.The active form of the receptor contains all three extracellular domains,a transmembrane region,and a short,disordered intracellular domain.The intracellular domain is required for signaling.An inactive form of this receptor contains all the extracellular domains;however,the cytosolic domain has been cleaved.Ligand binding to this form does not result in intracellular signaling.The soluble form of RAGE lacks the transmembrane and cytosolic domains.It is considered to be a “decoy”or scavenger receptor.
There are 22 documented isoforms of RAGE in humans,12 of which are found in the brain[4].These isoforms vary by alternative splicing and include soluble forms in addition to the cell membrane bound receptors(Fig.1).While the majority of the isoforms remain uncharacterized and their functions unknown[5],RAGE is known to be a pattern recognition receptor and recognizes a variety of ligands:amyloid-beta(Aβ)peptide,insulin,HMGB1,S100 proteins and others.Ligand binding to RAGE homodimers or RAGE-Toll-like receptor heterodimers results in activation of a variety of downstream signaling pathways,though the only known intracellular RAGE ligand is diaphanous 1(Diaph-1).Through intracellular signaling,NF-κB is activated,which initiates transcription of cytokines and other proinflammatory mediators,as well as a positive feedback loop in which RAGE expression is increased[6].Microglia have also been documented as overexpressing RAGE in hippocampal neurons,an area of the brain strongly associated with neurodegeneration[7-9].
The implication of RAGE in numerous diseases and neurodegenerative disorders makes the receptor of interest both as a therapeutic target and as an inflammatory biomarker[2].For example,azeliragon is a RAGE inhibitor evaluated for treatment of AD in phase II and phase III clinical trials[10,11].Investigation of RAGE as an inflammatory biomarker has focused upon developing imaging agents to enable quantification of RAGE using positron emission tomography(PET)or single photon emission computed tomography(SPECT)imaging.Prior efforts to produce radioligands for in vivo RAGE quantification have yielded a number of radiotracers,all of which target the extracellular domain,including a99mTc monoclonal antibody[12],18F-labeled S100 protein[13],and64Cu-labeled nanoparticles[14-16].While these probes have shown value imaging RAGE outside of the central nervous system,macromolecules and nanoparticles are too large to efficiently cross the blood-brain barrier(BBB)and their properties generally preclude them from use in neuroimaging applications.As such,we and others have investigated developing small molecule RAGE radiotracers for PET imaging.Given that the role of the different isoforms of RAGE is currently unclear(vide supra),questions remain over whether PET radiotracers should target the membrane bound form,or the soluble form.As such,we are developing PET radiotracers for both the intracellular domain of membrane bound RAGE,as well as the extracellular domain present in both membrane bound and soluble RAGE.For example,our laboratory recently reported the synthesis and initial evaluation of[18F]RAGER([18F]3)[17],a PET radiotracer based upon FPS-ZM1(2)[18]that binds to the extracellular domain(Fig.2),and confirmed brain uptake in rodents and nonhuman primates as well as increased retention of the radiotracer in autoradiography experiments with AD brain samples.Subsequent evaluation of[18F]RAGER,as well as11C-labeled FPSZM1([11C]2),were reported by Kong et al.[19,20]and Luzi et al.[21],respectively.In the present study,we build upon these initial reports and describe our further evaluation of RAGER and FPS-ZM1 as potential radiotracers targeting the extracellular domain of RAGE.In addition,we report development and initial evaluation of InRAGER and InRAGER2,recently reported RAGE inhibitors[22],as potential leads for developing PET radiotracers targeting the intracellular domain of RAGE.Lastly,we are also desirous of having access to an appropriate neuroinflammatory animal model to evaluate new radiotracers for RAGE developed in our program.With this in mind,we have investigated RAGE expression in LPS-treated mice,one of the most widely-used animal models of induced neuroinflammation[23],to determine their suitability for pre-clinical assessment of new RAGE radiotracers.

Fig.2.Small-molecules targeting RAGE.
2.Experimental
2.1.Chemistry
2.1.1.General considerations
All chemicals employed in syntheses were sourced commercially and without further purification.Microwave reactions were conducted using a CEM Discover/Explorer Hybrid System(CEM,Matthews NC,USA).1H NMR spectra were obtained at 400 MHz on a Varian NMR spectrometer in CD3OD solutions at room temperature with tetramethylsilane(TMS,δ= 0)as an internal standard.13C NMR spectra were obtained at 100 MHz;19F NMR spectra were obtained at 376 MHz.Chemical shifts(δ)are reported in ppm and coupling constants are reported in Hertz.Multiplicity is defined by s(singlet),d(doublet),t(triplet),q(quartet),and m(multiplet).High performance liquid chromatography(HPLC)was performed using a Shimadzu LC-2010A HT system(Shimadzu,Columbia MD,USA)equipped with a Bioscan/Eckert and Ziegler B-FC-1000 radiation detector(Eckert and Ziegler,Berlin,Germany).Mass spectra were performed on a Waters Micromass VG 60-250-S magnetic sector mass spectrometer(Waters Corporation,Milford MA,USA),Waters Micromass AutoSpec Ultima magnetic sector mass spectrometer,or Agilent Q-TOF HPLC-MS(Agilent Technologies,Santa Clara CA,USA)using the electrospray ionization(ESI)method or electron impact(EI)method.
2.1.2.N-Benzyl-N-cyclohexyl-4-chlorobenzamide(FPS-ZM1 unlabeled reference standard,2)
FPS-ZM1 reference standard 2 was prepared via 4 through adaption of previously described chemistry,and spectral data were consistent with prior reports[17,18].
2.1.3.N-Benzyl-N-cyclohexyl-4- fluorobenzamide(RAGER unlabeled reference standard,3)
RAGER reference standard 3 was prepared via 4 as previously described and spectral data were consistent with prior reports[17].
2.1.4.Preparation of 4-(Benzyl(cyclohexyl)carbamoyl)-N,N,N-trimethyl-benzenaminium Iodide(RAGER precursor,5)
RAGER precursor 5 was prepared as previously described and spectral data were consistent with prior reports[17].
2.1.5.3-((4-(2,4-di fluorophenyl)thiazol-2-yl)amino)phenol(InRAGER unlabeled reference standard,6)
2-Bromo-2′,4′-di fluoro-acetophenone(235 mg,1 mmol)was added to N-(3-hydroxyphenyl)thiourea(168 mg,1 mmol)dissolved in ethanol(10 mL),and the reaction was heated at 50°C in a microwave(100 W)for 5 min using a procedure adapted from Kabalka and Mereddy[24].Water(5 mL)was added to the reaction vessel and the resultant precipitate was collected,without further purification.1H NMR(400 MHz;MeOD/δppm)6.55(2H,m),6.89(1H,m)6.92(1H,m),7.08(2H,m),7.22(1H,m),8.11(1H,m);13C NMR(100 MHz;MeOD/δppm)102.4,102.7,105.0,110.4,111.6,119.1,119.3,130.7,130.9,143.8,147.8,159.3,159.9,160.6,161.1;19F NMR(376 MHz;MeOD/δppm)-111(1F,s),-109(1F,s).HPLC:98%,retention time=38 min,column:Phenomenex Gemini C18,250 mm×4.6 mm,mobile phase,10 mM NH4HCO3in 45% MeCN at pH 7.4,flow rate=2.0 mL/min,wavelength=254 nm,tR=38 min;HRMS calculated for[M+H]+(M = C15H10F2N2OS)305.0555,was found 305.0563.
2.1.6.4-Amino-5-chloro-2-methoxybenzoyl chloride(8)
Acetic anhydride(6.033 mmol,0.57 mL)was added to 4-amino-5-chloro-2-methoxybenzoic acid(5.0 mmol,1.008 g)dissolved in pyridine(2.5 mL).The reaction was stirred at room temperature for 5 h and then the solvent was removed by rotary evaporation.Water(10 mL)was added and the resulting solution was acidified to pH 2 with concentrated HCl.The precipitate was further washed with water,dried,and used without purification in the subsequent step.Thionyl chloride(10 mmol,10 mL)was added to the dried intermediate and the reaction proceeded at reflux for 3 h.The reaction was neutralized by the addition of cold methanol,and removal of volatile material in vacuo gave the title compound that was used directly in the next step.1H NMR(400 MHz;MeOD/δppm)7.26(m,2H),5.30(s,3H),and 1.25(s,3H).
2.1.7.4-Acetamido-5-chloro-2-methoxy-N-(thiazol-2-yl)benzamide(InRAGER2 unlabeled reference standard,7)
Triethylamine(1.48 mmol,205μL)was added to intermediate 8(0.496 mmol,130 mg)dissolved in dichloromethane(DCM)at 0°C.To this was added thiazole-2-amine(0.595 mmol,60 mg),with stirring.The solution was stirred overnight and warmed to room temperature.The reaction mixture was washed with water and brine,and then purified by flash chromatography(2%-10% MeOH/DCM gradient;10g SiO2).1H NMR(400 MHz;MeOD/δppm)8.57(m,1H),7.99(m,1H),7.70(m,1H),6.94(m,1H),4.06(s,3H)and 1.25(s,3H).HRMS was calculated for[M+H]+(M = C13H12ClN3O3S)326.0361,found 326.0360.
2.2.Fluorine-18 radiochemistry
2.2.1.General considerations
Unless otherwise stated,reagents and solvents were commercially available and used without further purification.Hospira sodium chloride,0.9% USP,and sterile water for injection,USP,were purchased from P fizer(Lake Forest IL,USA).Ethanol was purchased from American Regent(Shirley NY,USA).HPLC grade acetonitrile was purchased from Fisher Scientific(Waltham MA,USA).Other synthesis components were obtained as follows:sterile filters were obtained from MilliporeSigma(Burlington MA,USA);sterile product vials were purchased from Hollister-Stier(Spokane WA,USA);QMA-light and C18-light Sep-Paks were purchased from Waters Corporation.Sep-Paks were conditioned with ethanol(10 mL),followed by water(10 mL)prior to use.QMA cartridges were conditioned with 10 mL each of ethanol,0.5 M NaHCO3and,lastly,Milli-Q water prior to use.
2.2.2.[18F]RAGER([18F]3)
[18F]RAGER was synthesized from precursor 5,as previously described[17],in satisfactory radiochemical yield(1.6±0.4 GBq,44±10 mCi);2.9% non-decay-corrected based upon 1.5 Ci of[18F]fluoride),excellent radiochemical purity(RCP)(>99%),and high molar activity(138±18 TBq/mmol,3740±495 Ci/mmol);n=6.
2.2.3.[18F]InRAGER([18F]6)
[18F]Fluoride was produced via the18O(p,n)18F nuclear reaction using a 16 MeV General Electric PETTrace cyclotron(GE Healthcare,Chicago IL,USA)(40μA beam for 30 min generated 55.5 GBq(1500 mCi)of[18F] fluoride).The[18F] fluoride was delivered to a GE TracerLab FXFNsynthesis module(in a 1.5 mL bolus of[18O]water)and trapped on a QMA-light Sep-Pak to remove[18O]water.[18F]Fluoride was eluted into the reaction vessel using K2CO3(3.5 mg in 0.5 mL of water)to generate[18F]KF.A solution of K2.2.2(15 mg in 1 mL of acetonitrile)was added to the reaction vessel,and the resulting solution was azeotropically dried.InRAGER standard 6(2.5 mg dissolved in 0.5 mL of DMF)was delivered to the reaction vessel,and the reactionwas heated to 130°C and stirred for 30 min.Afterwards the reactor was cooled to 55°C and 2 mL of semipreparative HPLC solvent(vide infra)was added to the crude reaction mixture.The mixture was injected onto a semi-preparative HPLC column(Phenomenex Gemini C18,250 mm×10 mm;mobile phase 10 mM NH4HCO3in 45% MeCN,pH 7.4,flow rate=4 mL/min).The peak corresponding to[18F]InRAGER(tR=38 min)was collected and diluted in a round-bottomed flask containing 50 mL of water.The slow elution provided the product with high chemical and radiochemical purity,but has scope for further optimization in the future.The solution was passed through a C-18 extraction disk to remove organic solvent and trap[18F]InRAGER([18F]5).The disk was washed with 5 mL of sterile water,and the product was eluted with 0.5 mL of ethanol and diluted with 4.5 mL of saline.The final formulated dose was passed through a 0.22μm sterile filter into a sterile dose vial to provide[18F]InRAGER([18F]6)(radiochemical yield= 17.6 MBq(475μCi),0.032% uncorrected yield,RCP>99%,pH=5.5 and molar activity=41 GBq/mmol(1104 mCi/mmol);n=1).
2.2.4.Quality control
Quality control of radiopharmaceuticals was conducted as previously described [17] using the following tests: visual inspection,dose pH,and HPLC analysis.Doses were visually examined to confirm that they were clear,colorless,and free of particulate matter.The pH of the dose was analyzed by applying a small amount to pH-indicator strips and comparison to the provided scale.Radiochemical purity was assessed using Shimadzu LC-2010A HT system equipped with UV and radioactivity detectors.For convenience,mobile phases and column stationary phases used for HPLC analysis were based upon those used for semi-preparative HPLC ([18F]RAGER-column:Phenomenex Gemini C18,250 mm × 4.6 mm; mobile phase,10 mM NH4HCO3in 58% MeCN,pH 9 adjusted with 2 mL/L sat.NH4OH solution; flow rate: 1.5 mL/min; wavelength: 254 nm; room temperature; retention time: ~12.5 min; [18F]InRAGER-column:Phenomenex Gemini C18:250 mm× 4.6 mm; mobile phase: 10 mM NH4HCO3in 45% MeCN; flow rate: 1.5 mL/min; wavelength: 254 nm;room temperature; retention time: ~13.5 min).
2.3.Tritium radiochemistry
2.3.1.[3H]Azeliragon ([3H]1)
A 20 mL vial equipped with a stirbar was charged with 3-(4-(2-butyl-1-(4-(4-chlorophenoxy)phenyl)-1H-imidazole-4-yl)phenoxy)-N,N-diethylpropan-1-amine (azeliragon (1) 9.2 mg,0.017 mmol) and acetonitrile (4.0 mL).Tri fluoromethanesulfonamide(48.6 mg,0.173 mmol) was added and the reaction mixture was stirred at room temperature for 15 min.N-iodosuccinimide(23.34 mg,0.104 mmol) was added and the reaction mixture was stirred at room temperature overnight.The reaction mixture was quenched by addition of saturated NaHCO3(3.0 mL) and saturated Na2S2O3(3.0 mL).The mixture was extracted with dichloromethane(3 × 5 mL),and the organic layers were combined and washed with brine (5 mL).The organic layer was dried with sodium sulfate filtered over an Isolute phase separator (Biotage,Uppsala,Sweden).The filtrate was concentrated to dryness by rotary evaporation and the residue was dried further under vacuum providing a mixture of triand tetra-iodinated products (15.0mg).A sample of the crude product was analyzed by HPLC-MS using Method A (see Section 2.3.2).Two analytes (retention time = 14.1 min,MS (ESI+) m/z 910 0.8 [M+H] and retention time = 15.0 min,MS (ESI+) m/z 1018 0.8 [M+H]) were observed.The crude iodinated product was used without further purification.
The crude product was dissolved in THF (2.0 mL),and an aliquot of the solution (1.0 mL) was transferred to a round bottom flask containing 30% (m/V) Pd/C (5.0 mg).Triethylamine (5.7 μL,0.041 mmol) was added,the flask was attached to a tritiation manifold (Trisorber),and the mixture was degassed by subjection to three freeze-pump-thaw cycles.The reaction mixture was frozen with liquid nitrogen,the manifold was evacuated under vacuum,and tritium gas (2.0 Ci,200 mmHg) was charged to the reaction vessel.The mixture was warmed to room temperature and stirred overnight.The reaction mixture was frozen using liquid nitrogen and excess tritium gas was transferred to a charcoal trap.The crude mixture was warmed to room temperature,helium gas (450 mm Hg) was introduced,and the reaction vessel was removed from the manifold.The reaction was diluted with ethanol (2.0 mL) and the mixture was filtered over a pad of Celite.The flask was rinsed with additional ethanol (2.0 mL),the rinse was filtered,and was combined with the above filtrate.The mixture was concentrated to dryness by rotary evaporation.Additional labile tritium was removed by evaporation with ethanol (2 × 5 mL).The residue was dissolved in ethanol (5.0 mL) providing 8.1 GBq (218 mCi) of crude product.An aliquot was analyzed by HPLC-MS using Method A (see Section 2.3.2).The major analyte had a retention time of 9.73 min,consistent with that of the unlabeled standard.The crude product exhibited a radiochemical purity of 29.4%.To purify the product,approximately 0.8 GBq(21.7 mCi)of[3H]azeliragon was injected onto an Agilent Poroshell 120 EC column(50 mm×9.4 mm,2.7μm)using an Agilent 1100 series HPLC system.[3H]Azeliragon was eluted at a flow rate of approximately 4.8 mL/min with an isocratic solvent flow of 35% mobile phase B for 20 min,where mobile phase A=0.1% TFA/water and mobile phase B=0.1% TFA/acetonitrile.Peaks were detected and chromatograms were obtained using an Agilent variable wavelength UV detector set at 254 nm and Agilent ChemStation software.The fraction containing[3H]azeliragon([3H]1)was collected at~14 min using an Agilent fraction collector.The solvent was evaporated in vacuo and dissolved in 2 mL ethanol.The radiochemical purity was found to be>99%,and a total activity of 66.6 MBq(1.8 mCi)was obtained.The molar activity of[3H]azeliragon was determined to be 2.4 GBq/mmol(63.7 Ci/mmol)by LC/MS.
2.3.2.Analytical HPLC-MS method A
HPLC-MS analysis was performed using an Agilent 1260 HPLCMS equipped with a quaternary pump,an autosampler,a thermostat controlled column compartment,a photodiode array UV detector,a quadrupole MS detector,and a Beta-Ram radioactivity detector equipped with a 500μL flow cell.A 2:1 ratio of Flowlogic U scintillation cocktail/mobile phase was used.Analyses were performed using a Supelco Ascentis Express C18column(150 mm×4.5 mm,2.7μm).Gradient elution was performed using water containing 0.1% formic acid as mobile phase A and acetonitrile containing 0.1% formic acid as mobile phase B.The eluent flow rate was 0.8 mL/min,the column compartment temperature was maintained at 30°C,and UV detection was performed at 210 nm.The mobile phase gradient was set as follows:increase from 5% to 95% B over 18 min,hold at 95% B for 4 min,decrease to 5% B over 0.1 min,and hold at 5% B for 2.9 min.
2.3.3.[3H4]FPS-ZM1([3H4]2)
4-Chloro-N-(cyclohex-3-en-1-yl)-N-(3,5-dibromobenzyl)benzamide(10 mg,0.021 mmol),Pd/C,10%(2.28 mg,2.14 mmol)and triethylamine(13.7 mL,0.098 mmol)were combined in methanol(1.5 mL).The mixturewas frozen in liquid nitrogen and subjected to three freeze-pump-thaw cycles.The mixture was frozen and the flask was evacuated.Tritium(267 mbar,2 Ci)was released from the uranium bed by heating with the supplied source.The mixture was warmed to ambient temperature and stirred for 3 h.The reaction mixture was then frozen and the tritium gas in the head space was captured on an external uranium bed.The flask was removed from the manifold,diluted with methanol(5 mL)and passed through a syringe filter.The filter was washed with methanol(5 mL),and added to the original filtrate.The solvent was removed under reduced pressure and the residue was dissolved in methanol(10 mL)for final quantification of activity(65.1 GBq,1.76 Ci).An aliquot was purified via preparative HPLC(45%-60% acetonitrile/water(0.1% TFA)over 15 min,Cogent Bidentate(column:C18,100 mm×10 mm,4.6μm; flow rate= 4.7 mL/min).The radioactive purity was determined to be 99.1% by HPLC with a molar activity of 3.5 GBq/mmol(94.3 Ci/mmol)by LCMS(Cogent Bidentate,C18,100 mm×4.6 mm,4.6μm,ambient temperature;eluent A:water with 0.1% TFA,eluent B:acetonitrile; flow rate 1 mL/min;retention time=9.15 min;gradient:50%-70% B over 20 min).
2.3.4.[3H4]-RAGER([3H4]3)
N-(Cyclohex-3-en-1-yl)-N-(3,5-dibromobenzyl)-4-fluorobenzamide(10 mg,0.021 mmol),palladium on carbon(Pd/C),10%(2.28 mg,2.14 mmol)and triethylamine(13.7 mL,0.098 mmol)were combined in methanol(1.5 mL).The mixture was frozen in liquid nitrogen and subjected to three freeze-pump-thaw cycles.The reaction mixture was frozen and the flask was evacuated.Tritium(400 mbar,3 Ci)was released from the uranium bed by heating with the supplied source.The mixture was warmed to ambient temperature and stirred for 3 h.Afterwards,the reaction mixture was frozen and the tritium gas in the head space was captured on an external uranium bed.The flask was removed from the manifold,diluted with methanol(5 mL),and passed through a syringe filter.The filter was washed with methanol(5 mL)and added to the original filtrate.The solvent was removed under reduced pressure and the residue was dissolved in methanol(10 mL)for final quantification of activity(2.4 Ci).An aliquot was purified via preparative HPLC(50%-65% acetonitrile/water(0.1% TFA)over 15 min(Column:Cogent Bidentate,C18,100 mm×10 mm,4.6μm; flow rate:4.7 mL/min).The radioactive purity was determined to be 98.8% by HPLC with a molar activity of 3.3 GBq/mmol(90.4 Ci/mmol)byLCMS(Cogent Bidentate,C18,100 mm×4.6 mm,4.6μm,ambient temperature;eluent A:water with 0.1% TFA,eluent B:acetonitrile; flow rate=1mL/min;retention time=9.15 min;gradient:50%-70% B over 20 min).
2.4.Lead profiling screens
Lead profiling screens for FPS-ZM1(2),RAGER(3),InRAGER(6)and InRAGER2(7)against common protein drug targets were performed by Cerep Panlabs(Euro fins Panlabs,Taipei,Taiwan,China)in the Lead Profiling Screen I®.The test compounds were used at a concentration of 10μM in the initial assays.Follow up assays were conducted for RAGER,InRAGER and InRAGER2 to determine Kivalues for off-target binding sites.Full details are provided in the Supplementary data(Tables S1-S4).
2.5.Preclinical evaluation
2.5.1.Biodistribution of[18F]RAGER in Sprague-Dawley rats
Four animals were utilized per time point(two males(weight:260±30 g)and two females(weight:200±15 g)to account for any gender differences),and we reasoned these were sufficient numbers for a preliminary biodistribution study.Each animal was intravenously injected with[18F]RAGER via tail-vein(n=16,3.0±1.5 MBq,80±40μCi),and at 5,30,60,and 120 min postadministration,animals were euthanized and dissected.Each tissue was weighed and analyzed for radioactivity using a PerkinElmer 2480 automatic gamma counter and full details are provided in the Supplementary data.Biodistribution studies confirmed brain permeability and quick washout,with radioligand essentially absent from the brain at the 60 and 120 min time points(Fig.S1).Limited exposure was observed in other organs,and some accumulation was observed in the later time points in the small intestines.No bone uptake was observed indicating no evidence of metabolic de fluorination of[18F]RAGER.
2.5.2.Plasma protein binding of[18F]RAGER
The University of Michigan Pharmacokinetics(PK)Core(Ann Arbor MI,USA)determined plasma protein binding affinities to RAGER(Fig.S2).Three doses of RAGER were prepared in DMSO(1 mM,100 μM,and 10 μM)and verapamil in DMSO(100 μM)was used as a positive control owing to its high level of plasma protein binding(~90%)[25].RAGER was added to mouse plasma(final RAGER concentrations of 10 μM,1 μM,and 0.1 μM)in duplicate.200μL of samplewas added into the sample chamber,and 350μL of phosphate buffered saline(PBS)was added to the neighboring buffer chamber.Solutions were incubated at 37°C for 5 h in the sample chamber(Thermo Single-use RED plate).Post incubation,corresponding plasma and buffer samples were mixed in equal volume and the internal standard was added in cold acetonitrile to precipitate proteins.The solution was vortexed and incubated on ice for 30 min.The entire solution was centrifuged for 10 min at 3500 rpm;the supernatant was analyzed by LC/MS/MS(Column:Waters XBridge C18).
2.6.Preclinical imaging
2.6.1.General considerations
All animal PET imaging experiments were conducted under the supervision of the University of Michigan and its Institutional Animal Care and Use Committee according to approved protocols and all applicable federal,state,local and institutional laws or guidelines governing animal research.PET imaging was performed using a Concorde MicroPET P4 scanner(Siemens,Knoxville TN,USA).
2.6.2.Rodent imaging
Baseline:Animals were anesthetized(isoflurane),and positioned in the PET scanner.Anesthesia was maintained with 2%-4% isoflurane/O2throughout the imaging studies.Following a transmission scan,the animal was injected(via intravenous tail vein injection)with[18F]RAGER(11.5±1.9 MBq,0.31±0.05 mCi,n=3)or[18F]InRAGER(5.3 MBq,0.14 mCi)as a bolus over 1 min,and then imaged for 90 min(5×1 min frames-2×2.5 min frames-2×5 min frames-7×10 min frames).
Melatonin blocking:After completion of a transmission scan,the animal received a bolus injection i.v.of melatonin(5μg/kg)formulated in 10% ethanol in saline.After 10 min,the animal received[18F]RAGER(12.2 MBq,0.33 mCi,n=1),and the scan proceeded for 90 min as described for baseline study.
2.6.3.Primate imaging
Baseline:Primate imaging studies were performed using mature female rhesus macaque non-human primates(NHP)(n=4,weight=7.2±0.3 kg).The procedurewas conducted as follows:the animal was anesthetized in the home cage with ketamine and transported to the PET facility.The subject was intubated for mechanical ventilation,and anesthesia was continued with isoflurane.Anesthesia was maintained throughout the duration of the PET scan.A venous catheter was inserted into one hind limb and the NHP was placed on the PET gantry with its head secured to prevent motion artifacts.Following a transmission scan,the animal was injected i.v.with[18F]RAGER(151.7±26 MBq,4.1±0.7 mCi,n=4)as a bolus over 1 min,and the brain was imaged for 90 min(5×1 min frames-2×2.5 min frames-2×5 min frames-7×10 min frames).
Melatonin blocking:After completion of a transmission scan,the animal received a bolus injection i.v.of melatonin(5μg/kg)formulated in 10% ethanol in saline.After 10 min,the animal received[18F]RAGER(161.7 MBq,4.4 mCi,n=1),and the scan proceeded for 90 min as described for baseline study.
Melatonin challenge:The[18F]RAGER PET scan was conducted as described for the baseline study.The animal was injected i.v.with[18F]RAGER(107.9 MBq,2.9 mCi,n=1).At 40 min after radiotracer injection,the NHP received a bolus injection i.v.of melatonin(10μg/kg).Scanning was continued out to 90 min.
2.6.4.Data analysis
Emission data were corrected for attenuation and scatter,and then reconstructed using the 3D maximum a priori(3D MAP)method.Using a summed image of the entire data set,3D volumes of interest(VOI)were determined by placing a seed voxel in the middle of various brain regions,and then using region-specific thresholds to automatically determine the extent of each VOI.VOIs were determined for the whole brain(rodent)or whole brain,striatum,thalamus,cortex,hippocampus,and cerebellum(NHP).Previous data sets in the same NHP were used as reference determining specific VOIs([11C] flumazenil for cortex and cerebellum,[11C]dihydrotetrabenazine for striatum,[11C]carfentenil for thalamus and hippocampus).The VOIs were then applied to the full dynamic data sets to obtain the regional tissue time-radioactivity curves.Curves were normalized between studies by the animal weight and amount of activity injected to generate standardized uptake value(SUV)curves.A limitation of the study is that PET scans did not include arterial input correction because of practical and regulatory considerations at our institution.
2.7.LPS mice studies
2.7.1.Induction of the LPS model
Normal black mice(C57Bl/6J)were divided into experimental and vehicle control cohorts.Experimental cohorts were divided by sex(n=8/each)into time groups(n=4/each)for evaluation 24h or 14 days post-induction.Vehicle control cohorts were divided bysex(n=4 each)and time(n=2 each)for the same time points.Experimental cohorts received 5 mg/kg LPS(from Escherichia coli O111:B4)in saline intraperitoneally.Weight and body score description were monitored in the 14 day cohort approximately every 3 days.Sacrifice was performed by cervical ligation and brain removal;brains were immediately sectioned on the sagittal plane and flash frozen in dry ice.Sections were stored at-80°C until further use.
2.7.2.Tissue preparation
Half of the brain sections were cut using a microtome to 20μm sections and thaw-mounted onto polylysine-coated glass slides.Slides utilized for immunohistochemistry were fixed in Davidson’s fixative(8.1% formaldehyde,33.3% ethanol,11.1% acetic acid,Eosin Y stain)for 24 h and then rinsed with 70% ethanol to remove residual formaldehyde before use.Slides utilized for autoradiography were stored at-80°C until the day of experiment.The corresponding halves of brain sections were grouped by cohort and homogenized together in 1×PBS(7.4).Homogenized solutions were utilized for scintillation proximity assay experiments on the same day as homogenization in order to limit the influence of freeze/thaw cycles.
2.7.3.Immunohistochemistry
Fixed tissue sections were incubated in PBS with 1% SDS for 5 min.Sections were then washed 3×5 min in PBS before quenching in 70% methanol with 0.3% hydrogen peroxide for 15 min.All slides were washed 3×5 min in PBS-T(PBS,0.4% Triton-X-100,pH 7.4)and blocked for 30 min with PBS-TBA(PBS,0.4% Triton-X-100,1% BSA,0.025% sodium azide,pH 7.4)before incubating in a 1:200 dilution of primary antibody(anti-IL-1β,Fisher(AF401NA),anti-TNFα,Fisher(PIPA546945),or anti-RAGE,Fisher,(NBP242913))in PBS-TBA overnight.Finally,brain sections were washed 3×5 min in PBS-T to remove unbound antibody.Tissue sections were incubated in a 1:200 dilution of secondary antibody(anti-goat-IgG,Vector Laboratories BA-5000,anti-rabbit-IgG,Vector Laboratories BA-1000)in PBS-TBA for 2 h and washed 3×5 min with PBS-T.All incubations were carried out at room temperature.Slides were developed as instructed using the VECTASTAIN Elite ABC Kit procedure(Standard)(Vector Laboratories PK-6100).Tissue sections were thenwashed 3×5 min in PBS-T before incubating for 4 min in a 0.5%(m/V)solution of diaminobenzidine in PBS-T(filtered)with 0.001% hydrogen peroxide.Giemsa counterstaining was utilized to visualize nucleus and cytoplasm in cells.Tissue sections were washed for 5 min in dH2O prior to overnight incubation in a 1:50 solution of Giemsa in dH2O.Slides were then rinsed for 30 s in dH2O,2×4 min in n-butanol,and 1 min in xylene.Permount was applied to the fixed tissue to attach coverslips to the polylysine-coated glass slides and allowed to set for 45 min prior to quantification.All incubations were carried out at room temperature.
Four tissue sections from each animal(2 sections/slide)were used for each primary antibody and counted.Immunoreactivity was quantified using StereoInvestigator.A region was drawn around the entire tissue section and using the serial section manager,5% of the section was counted and picked using a randomized rotation.Immunoreactivity is presented as cells/μm2.Statistical analyses were performed in GraphPad Prism 8.01(San Diego CA,USA).
2.7.4.Autoradiography
Brain sections on slides were removed from the-80°C freezer and thawed at room temperature for 5 min before rehydration in PBS(pH 7.4)for another 5 min.Brain sections were then incubated with a range of concentrations of tritiated ligands([3H]RAGER,[3H]FPS-ZM1,or[3H]azeliragon)and unlabeled ligands.Incubation was conducted at room temperature,and incubation times were determined by equilibrium experiments;30 min incubations were used for[3H]RAGER and[3H]FPS-ZM1,while 60 min was used for[3H]azeliragon.All sections were washed for 3×2 min with PBS at 4°C and then rinsed in dH2O for 30 s at 4°C to remove unbound radioactivity.Finally,slides were dried under the continuous air flow for 30 min before exposure to a high-resolution phosphoimaging plate for 2 weeks.The exposed plate was scanned using a GE Typhoon FLA 7000 phosphoimager.Image analysis was performed using ImageQuant(Molecular Dynamics)software.Regions-of-interest were drawn and converted to disintegrations per minute(DPM)/μg protein using the Amersham standards,and then using the individual ligand’s molar activity converted to nmol/μg protein.
3.Results and discussion
3.1.Imaging the extracellular domain of RAGE
3.1.1.Ligand selection and synthesis of reference standards
FPS-ZM1(2)and RAGER(3)were synthesized as previously described[17,18],and further evaluated for imaging the extracellular domain of RAGE on account of their high affinity for the target(FPS-ZM1 Ki=25 nM[18],RAGER Kd=15.5 nM[17]).Brie fly,FPSZM1 was synthesized in 80% yield(over 2 steps)by reductive amination of benzaldehyde and cyclohexamine to give amine 4,followed by acylation with 4-chlorobenzoyl chloride(Scheme 1).RAGER 3 was also synthesized in 80% yield(over 2 steps)by analogous acylation of 3 with 4- fluorobenzoyl chloride.
3.1.2.Synthesis of[18F]RAGER
[18F]RAGER([18F]3)was synthesized from the trimethylammonium salt precursor 5 as previously described[17],and shown in Scheme 2.The synthesis provided[18F]RAGER in suitable radiochemical yield(RCY)(1.6±0.4 GBq,44±10 mCi),molar activity(138 ± 18 TBq/mmol,3740 ± 495 Ci/mmol),RCP(>99%),and pH(5.5)for preclincial evaluation(n=6).
3.1.3.Lead profiling screens
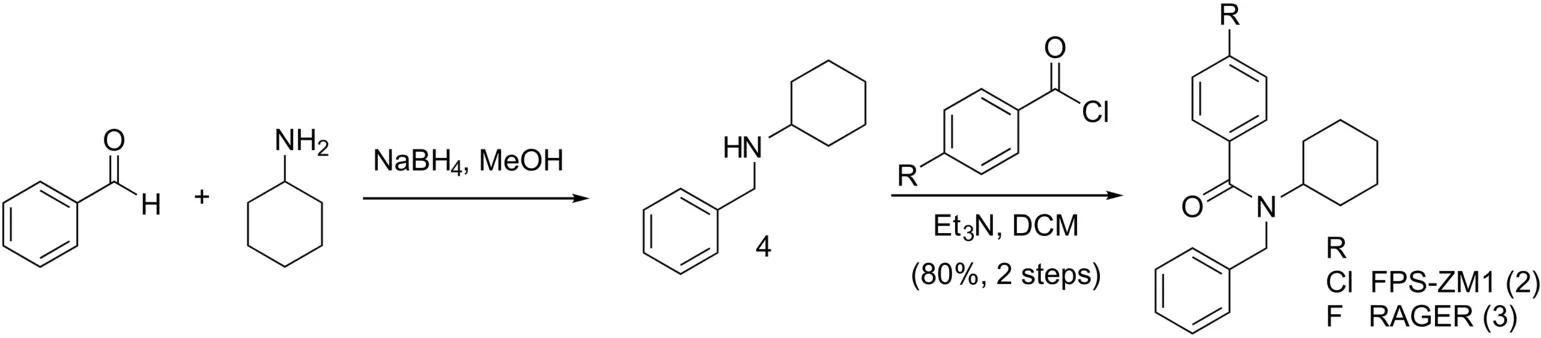
Scheme 1.Synthesis of FPS-ZM1 and RAGER.
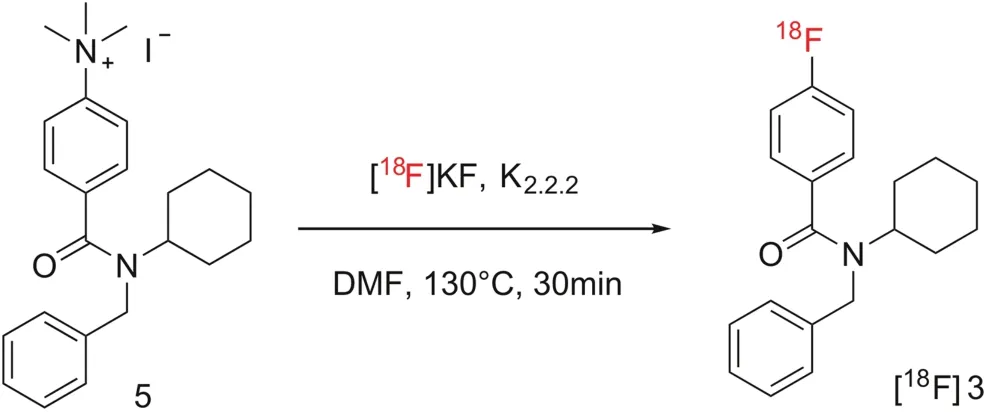
Scheme 2.Synthesis of[18F]RAGER([18F]3).
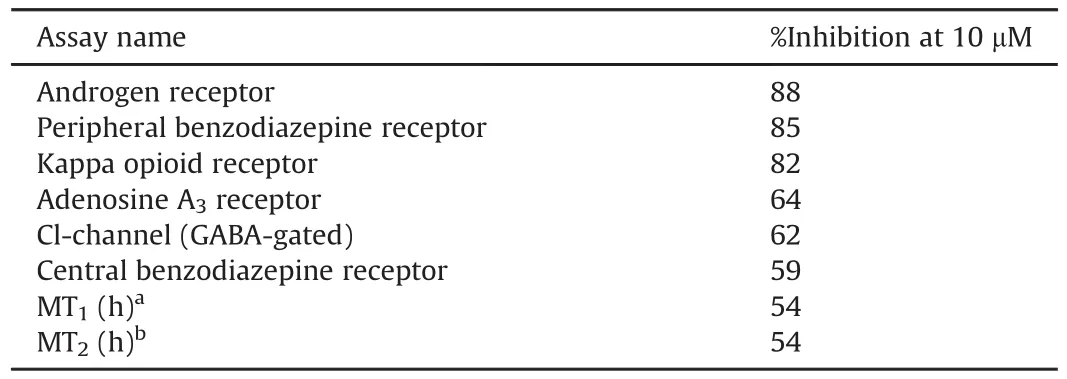
Table 1FPS-ZM1 lead profiling screen assay results.Primary assays were performed at 10μM FPS-ZM1 to determine the percent inhibition.

Table 2RAGER lead profiling screen assay results.Primary assays were performed at 10μM RAGER to determine the percent inhibition;secondary dose response determined IC50and Ki.
FPS-ZM1 (Table 1) and RAGER (Table 2)were tested in single dose percentage inhibitionmode at 10 μMagainst a series of common CNS targets at Cerep (now Eurofins Pharma Discovery) using binding and enzyme and uptake assays. Full details and results are provided in the Supplementary data.Results showing an inhibition or stimulation higher than 50% are considered to represent significant effects of the test compounds, and are summarized in Table 1. Of most concern was binding of RAGER to melatonin receptors.Since MT1and MT2are G-coupled transmembrane receptors expressed in the central nervous system(CNS)[26],and RAGER inhibited both at 10μM,we reasoned that off-target binding could complicate quantification of RAGE.To investigate this issue further,we determined the Kiof RAGER(and FPS-ZM1)for both receptors and were gratified to observe good selectivity of both lead compounds for RAGE(Table 3).Further investigation of selectivity for RAGE with regards to off-target bindingto MT receptors was conducted in vitro and in vivo (see Section 3.1.4).

Table 3FPS-ZM1 and RAGER data for RAGE and MT receptors.
3.1.4.Evaluation of off-target binding to MT receptors
We have previously investigated both the in vitro and in vivo behavior of[18F]RAGER,using autoradiography and pre-clinical imaging in rodents and nonhuman primates[17].In addition,Kong et al.[19,20]and Luzi et al.[21]have reported autoradiography and rodent imaging with[18F]RAGER and[11C]FPS-ZM1,respectively.The in vivo imaging studies are all in agreement that despite high(96%)plasma protein binding(Fig.S2),there is rapid brain uptake of the radiotracers,retention that is consistent with specific binding to RAGE and good washout.In vitro studies have also confirmed the feasibility of using RAGE as an imaging biomarker for AD.For example,we have previously demonstrated a Bmax/Kdvalue of 1.86 in post-mortem AD tissue,compared to 0.65 in control tissue,suggesting imaging with[18F]RAGER is feasible[17].However,in contrast to in vivo imaging,the in vitro studies have revealed a high degree of non-specific and/or off-target binding for both radiotracers.Given the Cerep panel data(see Section 3.1.3),in this work we hoped to better understand the nature of the signal and evaluate whether off-target binding to MT receptors interfered with our ability to quantify specific binding of[18F]RAGER to the receptor for advanced glycation endproducts.
MT receptors are G-coupled transmembrane receptors and the endogenous ligand,melatonin,is well known for its role in circadian rhythm control[26].Melatonin has picomolar affinity for both MT1and MT2receptors,but,to the best of our knowledge,has not displayed any documented affinity for RAGE.The MT1receptor is expressed exclusively in the CNS,mostly in the hypothalamus,though it is also expressed at lower levels in the hippocampus and other areas of the human brain[26].RAGE is expressed ubiquitously at low levels in the CNS,but,unlike MT1,RAGE expression is inducible by the level of inflammation in the microenvironment,and increases in the presence of RAGE ligands such as cytokines or other proinflammatory mediators[27].For example,RAGE is documented to be overexpressed in hippocampal neurons in AD[9],consistent with the increased binding of[18F]RAGER and[11C]FPS-ZM1 in autoradiography studies with rodent and human AD brain tissue samples described above and previously reported[17,21].Studies with[18F]RAGER show the highest uptake in the thalamus and basal ganglia in healthy nonhuman primates,which may overlap with areas of MT1expression[17].Since there is limited information available regarding the expression levels of RAGE in healthy control tissue,although brain expression in NHP is known[28],we investigated what contribution binding to MT receptors made to the[18F]RAGER signal observed in prior in vitro and in vivo studies.
To identify areas of MT1expression and determine if those areas overlapped with[18F]RAGER binding,immunohistochemistry was performed on post-fixed human brain tissue sections using mouse anti-human MT1antibody.To serve as the neuroinflammatory brain sections,post-mortem frontal cortex tissue sections were obtained from brains of subjects diagnozed with AD and dementia with Lewy bodies(DLB)+AD.A region and age-matched healthy control was used for comparison.Antibody binding was visualized by secondary incubation with biotinylated goat anti-mouse antibody and avidin-biotin-peroxidase activity.Increased MT1immunoreactivity was observed in AD and DLB+AD tissue sections(Fig.3),consistent with literature findings[29].Anti-RAGE antibodies also displayed increased immunoreactivity in AD and DLB+AD tissue sections,consistent with our own previous findings[17].Although the increased binding trend in disease tissue is shared by MT1and RAGE,there is a large difference in abundance.RAGE is 100 times more abundant in the frontal cortex than MT1,which,in combination with the lower affinity for of RAGER for MT1(vide supra),indicates that the risk of off-target binding in this brain area is low.To validate this hypothesis,[18F]RAGER autoradiography on human brain sections was repeated employing melatonin as the blocking agent.
Competitive binding experiments were performed with 10μM melatonin and[18F]RAGER in human brain tissue sections.Slides were exposed to a storage phosphor imaging plate and analyzed using ImageQuant™software.Region and age matched healthy control tissue was compared with AD and DLB+AD brain sections.Melatonin(10μM)was not able to displace[18F]RAGER in either control or disease brain tissue sections(Fig.3),suggesting that offtarget binding of[18F]RAGER is not due to MT1.
Concurrently,we evaluated the effect of melatonin challenge on in vivo imaging with[18F]RAGER in rodent(see Supplementary data)and nonhuman primate(Fig.4).Melatonin is known to passively diffuse across the blood-brain barrier[30]and PET imaging studies were first performed in healthy rodents with a non-therapeutic dose of melatonin(5μg/kg i.v.)given 10 min prior to injection of[18F]RAGER.Imaging was continued for 90 min,and melatonin blocking had no effect on[18F]RAGER uptake or washout compared to baseline.Consistent with the original rodent imaging studies using[18F]RAGER[17]and biodistribution studies(Fig.S1),washout of the radioligand from the rodent brain occurred very quickly in both the baseline and blocking studies.Administering melatonin prior to the imaging study did not change the shape of the time activity curve(Fig.S3).
The rapid washout of[18F]RAGER from the rodent brain is known[17],and therefore we did not expect to see a large decrease in specific binding following melatonin blocking.In our prior studies,washout of[18F]RAGER was found to be slower from the NHP brain than rodent[17],which lead us to expect that contibutions from binding to melatonin receptors might be more evident in NHP.Following a baseline scan(Fig.4A),specific binding was assessed with both blocking(Fig.4B)and displacement(Fig.4C)studies using melatonin;we chose these two study designs to demonstrate whether pre-administration altered the uptake due to competitive binding and not as a result of affecting the input function.In the blocking study,5μg/kg melatonin was administered intravenously 10 min prior to[18F]RAGER dosing,and imaging was conducted for 90 min.This PET scan did not reveal any decrease in radioligand uptake,maximal SUV,or significant change in the shape of the timeactivity curve(TAC)compared to baseline.A displacement study was also performed with melatonin.In this experiment,10μg/kg melatonin was dosed 40 min into the 90 min scan.A higher dose of melatonin was chosen for this experiment to increase the likelihood of observing any displacement of[18F]RAGER.However,this scan also did not differ significantly in maximal SUV or TAC shape from the baseline PET scan.These results all indicate that[18F]RAGER binding is specific to RAGE,and that off-target binding to MT1receptors does not contribute to the in vivo PET signal.
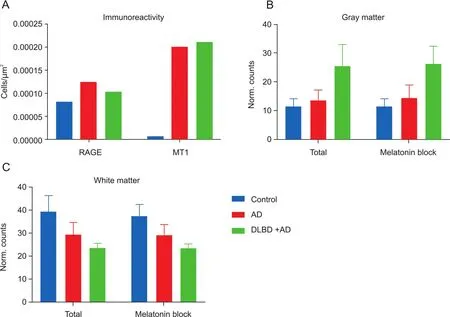
Fig.3.(A)RAGE and MT1immunoreactivity in postmortem human tissue samples,(B)[18F]RAGER autoradiography in gray matter(total binding and in the presence of 10μM melatonin),and(C)[18F]RAGER autoradiography in white matter(total binding and in the presence of 10μM melatonin).
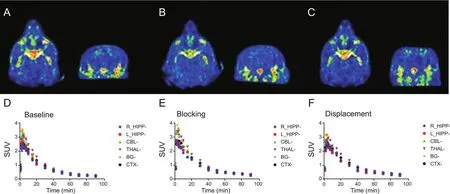
Fig.4.(A-C)Coronal and transverse summed(0-90 min)PET images of nonhuman primate administered with[18F]RAGER.(A)[18F]RAGER baseline(151.7±26 MBq,4.1±0.7 mCi,n= 4);(B)Pre-blocking with 5μg/kg melatonin 10 min prior to administration of[18F]RAGER(161.7 MBq,4.4 mCi,n= 1);(C)[18F]RAGER displacement study with 10μg/kg melatonin 40 min post-injection of radiotracer(107.9 MBq,2.9 mCi,n=1).(D-F)Time-radioactivity curves of nonhuman primate PET imaging studies presented as SUV.(D)[18F]RAGER baseline scans(n= 2);(E)[18F]RAGER 5μg/kg melatonin blocking study(n= 1);(F)[18F]RAGER 10μg/kg melatonin displacement study(n= 1).Regions-of-interest displayed:R_HIPP(Right hippocampus),L_HIPP(Left hippocampus),CBL(cerebellum),THAL(thalamus),BG(basal ganglia),and CTX(cortex).
3.1.5.Summary
Preliminary studies by our laboratory and other groups in the field have evaluated[11C]FPS-ZM1 and[18F]RAGER as potential radiotracers for imaging the extracellular domain of RAGE with PET.These studies have all revealed good brain uptake of the ligands in multiple species including rodents and primates.In addition,increased uptake was observed in in vitro autoradiography studies using human postmortem brain tissue samples from AD subjects as well as in vivo imaging studies with transgenic AD rodents.These studies have also revealed challenges associated with possible offtarget binding of these radiotracers when considering translation to human imaging studies.To investigate this issue,we conducted lead profiling screens for common CNS targets which identified metanonin receptors as a possible off-target binding interaction.However,extensive in vitro and in vivo studies lead us to conclude that the high off-target binding is unlikely due to binding to melatonin receptors(or any of the other targets identified in the Cereppanel),and is more likely attributable to the high lipophilicity of the compounds(RAGER:experimental log P=3.5;cLogP=4.85,ChemBioDraw;FPS-ZM1:cLogP=5.25,ChemBioDraw[17]).We believe that RAGER and FPS-ZM1 are suitable lead scaffolds for developing a RAGE PET radiotracer because of their high affinity and good brain uptake,and remain optimistic that 2nd generation analogs with more druglike properties hold promise for translation into human imaging studies in the future.
3.2.Preliminary approaches for imaging the intracellular domain of RAGE
3.2.1.Ligand selection and synthesis
There are 22 identified human isoforms of RAGE.While some are active and membrane bound,others are soluble and free floating in the blood and cerebrospinal fluid(CSF)(Fig.1).[18F]RAGER was designed to inhibit ligand binding in the extracellular domains.However,the predominant isoform is soluble RAGE(sRAGE),which lacks the intracellular C-tail domain.The relationship between the membrane-bound and soluble isoforms is not well understood,but we reason that RAGE radiotracers bound to significant quantities of sRAGE could increase the noise of in vivo imaging studies.Thus,concurrent with our efforts developing radiotracers for the extracellular domain,we have also explored development of a small molecule radioligand for the intracellular C-terminus of RAGE(ctRAGE).The intracellular C-tail is only found in active,full length RAGE,which is an important distinction in the inflammation pathway.Small molecule inhibitors have recently been identified for the intracellular C-terminus by Manigrasso and colleagues[22].With the goal of selectivity for the full length,membrane bound isoforms of RAGE,we evaluated two thiazole compounds from the newly discovered series(Fig.5),dubbed InRAGER(6,ctRAGE Kd=1±0.5 nM)and InRAGER2(7,ctRAGE Kd=0.3±0.05 nM),because of their high affinity for RAGE and amenability for labeling with fluorine-18.
Synthesis of the InRAGER standard was accomplished in a onestep microwave-assisted reaction(Scheme 3)using a procedure adapted from Kabalka and Mereddy[24].2-Bromo-2′,4′-di fluoroacetophenone was added to N-(3-hydroxyphenyl)thiourea dissolved in ethanol,and the reaction was conducted at 50°C(100 W)to generate InRAGER(6)in 95% yield.
Synthesis of theInRAGER2 standard was accomplished over three steps(Scheme 4).Brie fly,4-amino-5-chloro-2-methoxybenzoic acid was acetylated and then converted to 4-amino-5-chloro-2-methoxybenzoyl chloride(8)in neat thionyl chloride.Acylation of thiazol-2-amine with chloride 8 yielded InRAGER2(7)in 8% overall yield(3 steps).

Fig.5.InRAGER and InRAGER2.
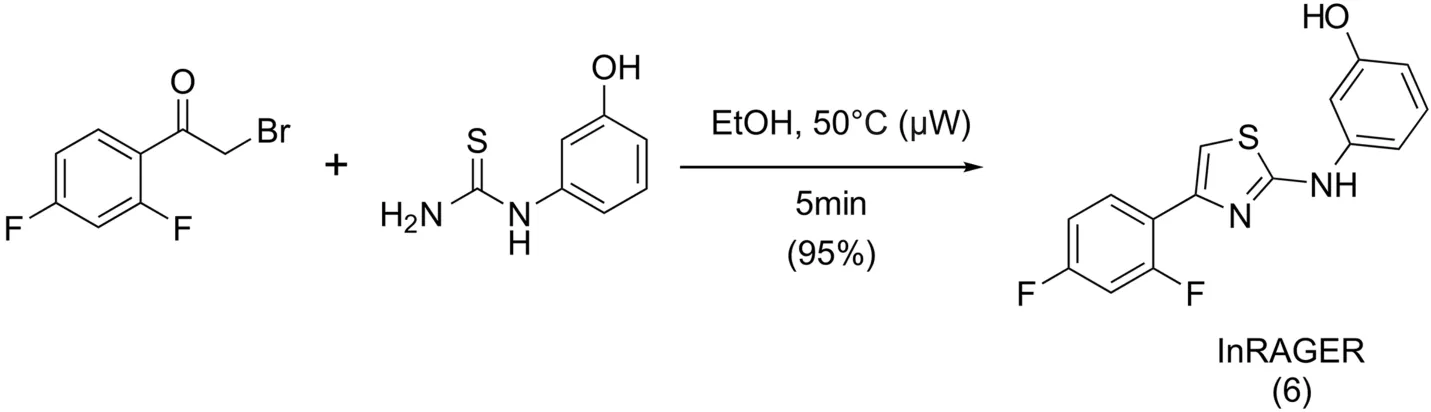
Scheme 3.Synthesis of InRAGER.
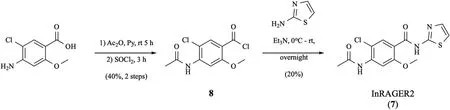
Scheme 4.Synthesis of InRAGER2.
3.2.2.Lead profiling screens
InRAGER and InRAGER2 were tested in single dose percentage inhibition mode at 10μM against the same series of common CNS targets evalauted for RAGER and FPZ-ZM1(Section 3.1.3)using binding and enzyme and uptake assays,and full details are provided in the Supplementary data.IC50and Kivalues were determined using secondary dose response for targets where inhibition was>50%.Initial results indicated some promiscuity of InRAGER.Of the 68 assays performed,InRAGER inhibited 10 of them at 50% or greater(Table 4).
The lead profiling screen assay results for InRAGER2(Table 5)revealed it to be less promiscuous than InRAGER.The results obtained from the off-target screening indicated the 5-HT2B,adenosine A3,benzodiazepine and urotensin(UT)receptors,as well as COX-1 enzyme,are shared off-targets of both InRAGER and InRAGER2,perhaps attributable to the common thiazole pharmacophore(Fig.5).Additionally,although the Kifor the constitutively expressed COX-1 enzyme was not determined for InRAGER2,it has a modest IC50for the enzyme(IC50= 12μM).Although a directcomparison of the available Kdvalue of InRAGER and InRAGER2 for RAGE with Kivalues for other targets is not possible,it appears that both compounds have higher affinity for RAGE than any of the other targets.Nevertheless,these other targets in the CNS will be considered during future lead optimization and/or translation to imaging.

Table 4InRAGER lead profiling screen assay results.Primary assays were performed at 10μM InRAGER to determine the percent inhibition;secondary dose response determined IC50and Ki.
3.2.3.Synthesis of[18F]InRAGER
For preliminary evaluation in this study,radiosynthesis of[18F]InRAGER([18F]6)was performed from InRAGER reference standard by isotopic exchange with[18F]KF(Scheme 5).Purification by semipreparative HPLC and reformulation into ethanolic saline provided[18F]InRAGER in sufficient RCY(17.6 MBq,475μCi,0.03% uncorrected yield),RCP(>99%),molar activity(41 GBq/mmol,1104 mCi/mmol)and pH(5.5)for preclinical use(n=1).The low RCY and molar activity are the result of synthesis via isotopic exchange and a challenging nucleophilic aromatic substitution reaction isotopic.Going forward,a no-carrier-added radiosynthesis with high molar activity[18F] fluoride is necessary,and we expect such thing can be accomplished from organoboron or stannane precursors using new copper-mediated methods for late-stage radio fluorination of electron rich arenes that are being developed in our laboratory[31,32].
3.2.4.Preclinical PET imaging with[18F]InRAGER
While evaluating the thiazole derivatives InRAGER and InRAGER2 as a starting point for developing a PET radiotracer targeting ctRAGE,we wanted to confirm brain uptake of such a scaffold.We selected evaluation of the fluorinated InRAGER first,as it could be radiolabeled without modifying the structure(cf.the fluorine for chlorine substitution required to radiolabel in InRAGER2).Thus,we evaluated the in vivo imaging properties of[18F]InRAGER in rodents to confirm BBB penetration and CNS uptake(Fig.6).PET imaging in healthy Sprague-Dawley rat(n=1)revealed BBB permeability of[18F]InRAGER,good overall CNS uptake(peak SUV~2 for the whole brain)and slow washout.The washout ratio could indicate specific binding,but given the lower molar activity of radiotracers prepared by isotopic exchange,follow-up studies with no-carrier-added[18F]InRAGER are required to further evaluate specific binding to RAGE.Furthermore,we have not yet evaluated[18F]InRAGER in primatesbecause of the higher mass dose associated with the low molar,but will consider it once a no-carrier-added radiosynthesis has been developed.
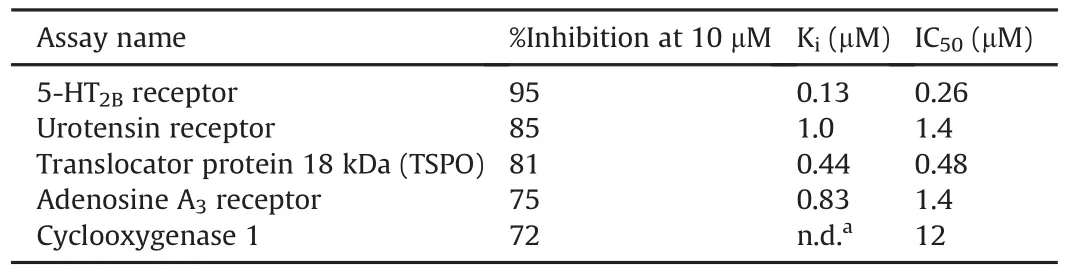
Table 5InRAGER2 lead profiling screen assay results.Primary assays were performed at 10μM InRAGER2 to determine the percent inhibition;secondary dose response determined IC50and Ki.
3.2.5.Summary
We have evaluated two thiazole derivatives(InRAGER(6)and InRAGER2(7))as lead compounds for developing PET radiotracers for ctRAGE.Both compounds have previously been shown to have high affinity for RAGE and are easily synthesized from commercially available starting materials.[18F]InRAGER([18F]6)was prepared for initial in vivo evaluation from 6 via isotopic exchange.Preliminary rodent PET imaging in a Sprague Dawley rat demonstrated good brain uptake and washout of[18F]6,con firming the viability of the thiazole scaffold for developing radiotracers targeting RAGE in the CNS.These results point to the thiazole as a reasonable lead scaffold for developing PET radiotracers for ctRAGE.However,the relatively high affinity of both InRAGER and InRAGER2 for multiple other targets in the CNS indicate that 2nd generation radioligands with greater selectivity for RAGE are required before clinical translation can be considered.Exploring the structure activity relationships(SAR)around the thiazole scaffold and developing no-carrier-added radiosyntheses of radiotracers for ctRAGE will be the subject of a future research project.
3.3.Investigation of RAGE as a neuroinflammatory biomarker in the LPS rodent model
The implication of RAGE in inflammatory cascades in both the CNS and periphery makes it of interest as an imaging biomarker across the associated disorders.The work described in this paper highlights lead scaffolds for development of radiotracers that will enable quantification of RAGE in such disorders using PET imaging.As our effort to develop RAGE radiotracers continues,we also hope to have an animal model with upregulated RAGE that we can use to evaluate newly developed radiotracers in vivo.LPS,a known tolllike receptor 4(TLR4)ligand,has long been used to induce peripheral inflammation and,in the classic LPS model of inflammation,RAGE has been shown to be increased modestly(1.5-3-fold)in male rodents[33-35].In the final part of this paper we describe our investigation of such LPS-treated mice as an animal model with increased RAGE expression and its potential for use in evaluating new RAGE imaging agents in the future.
3.3.1.Initiation of LPS model
We chose to follow the classic experimental LPS model using a wild type strain of mice and 5 mg/kg i.p.LPS administration,and evaluated time points at 1 day and 14 days post-treatment.An important difference in our study compared to the literature was that we used both male and female mice.Despite the literature precedent for only using male mice,there is no apparent explanation for this choice.Considering 2/3 of AD patients are female[36],we considered both sexes.
The mortality rate for the experiment was 0% and there was no significant change in weight/alertness score during the 14 day LPS induction.Based on the dosage used,5 mg/kg,and utilizing intraperitoneal injection,mortality was not considered as a high risk.
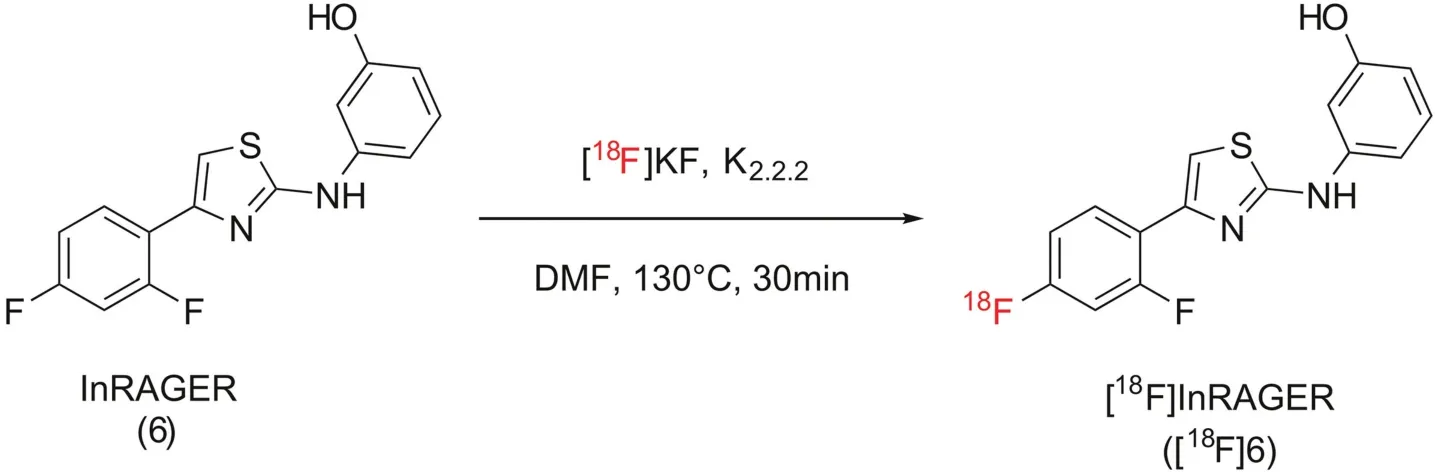
Scheme 5.Synthesis of[18F]InRAGER([18F]6).
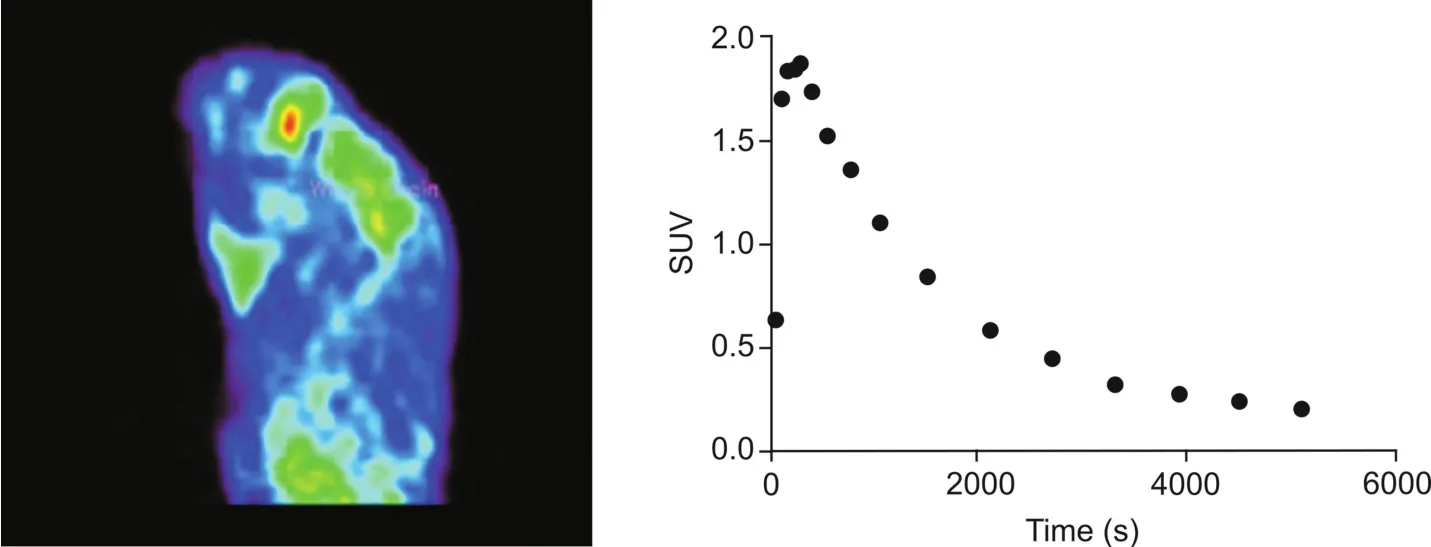
Fig.6.Rodent imaging data for[18F]InRAGER(summed image 0-90 min post-i.v.-injection of the radiotracer(5.3 MBq,0.14 mCi)and whole brain time-radioactivity curve).
3.3.2.Determination of RAGE in LPS rodent brain tissue samples
Immunohistochemistry was used to identify differences in IL-1β,TNFα and RAGE in both experimental cohorts(1 dayand 14 days post-induction).We initially examined known biomarkers IL-1β and TNFα;increases in both confirmed the induction of neuroinflammation in all of the experimental cohorts(Fig.7).Males exhibited significantly higher levels of IL-1β (1.5-10 fold)and TNFα(10-20 fold).Although lower in abundance,the female cohorts also demonstrated a significant increase in both established biomarkers at 1 day and 14 days compared to vehicle control.RAGE immunoreactivity revealed that RAGE abundance increased in the male experimental cohorts only,not in the female cohorts.The increase,approximately 2.5 fold,was statistically significant and consistent with literature values[33-35].The magnitude of change in RAGE abundance did not change between 1 day and 14 days unlike TNFα and IL-1β,which had both decreased by the 14 day mark(Fig.7).
3.3.3.Synthesis of tritiated RAGE ligands
To facilitate autoradiography experiments,tritiated versions of azeliragon,RAGER and FPS-ZM1 were synthesized.Given the significant number of CNS targets identified in the Cerep screens for InRAGER and InRAGER2(see Section 3.2.2),tritiated versions of these ligands were not prepared for this part of the study.
[3H]Azeliragon([3H]1)was prepared by initial iodination of azeliragon 1 using trifluoromethanesulfonimide(Tf2NH)and N-iodosuccinimide(NIS)(Scheme 6).This formed a mixture of tri-and tetra-iodinated products according to mass spectral analysis.The crude mixture was reduced with palladium on carbon catalyst(Pd/C)using tritium gas(T2,2 Ci,200 mmHg).The reduction provided 8.1 GBq(218 mCi)of crude material with a radiochemical purity of 29%.Approximately 0.8 GBq(21.7 mCi)of the crude sample was purified by reversed-phase semi-preparative HPLC.The fractions corresponding to[3H]azeliragon([3H]1)were collected and combined to provide 66.6 MBq(1.8 mCi)of product with an RCP of>99%.
Both[3H4]FPS-ZM1([3H4]2)and[3H4]RAGER([3H4]3)were prepared from their corresponding dibromide alkene precursors(9 and 10)(Scheme 7)by reduction with tritium gas using Pd/C as the catalyst.Both tritiated ligands were separately purified by reversed-phase semi-preparative HPLC to give 13.4 GBq(362 mCi)of[3H4]RAGER with a radiochemical purity of 98.8%,and 1.8 GBq(49 mCi)of[3H4]FPS-ZM1 with a radiochemical purity of 99.1%.
3.3.4.Ex vivo evaluation of[3H]RAGE ligand retention in LPS brain tissue samples
Binding studies were performed on frozen tissue with three ligands for the extracellular domain of RAGE.[3H]RAGER and[3H]FPS-ZM1 have both previously been characterized for their binding to RAGE(vide supra).Binding properties of azeliragon are not well documented(literature Kdvalues are in the range of 12.7-500 nM[2,11])and thus,we attempted to use[3H]azeliragon to determine the Kdand Bmaxon rat brain tissue before using the experimental LPS mouse tissue.Unfortunately,on rat brain tissue,the exact Kdand Bmaxcould not be determined based on concentration range limitations,consistent with a Kdfor[3H]azeliragon on tissue of>150 nM.Binding assays were performed at 1 nM of[3H]ligand,below Kdfor each ligand used.Total binding and non-specific binding were determined experimentally and specific binding was calculated as the difference.
RAGE immunoreactivity of the mouse brain tissue suggested there should be only an observable change in RAGE binding in the male cohorts(see Section 3.3.2).However,binding of all three[3H]RAGE ligands was dominated by off-target/non-specific binding(Fig.S4)and this complicated quantification of any differences in ligand binding was associated with the small changes in RAGE expression observed by IHC.As such,we found no significant difference in binding between the male and female cohorts at either time point or the corresponding control animals(see Supplementary data for full details).These results are similar to those obtained by Pottier and co-workers in their efforts to image cannabinoid type 2 receptors with[11C]A-836339 in LPS rats[37].There was no difference in PET imaging between LPS and controls,despite increased receptor expression in the LPS model.As such,alternative animal models will be considered for future evaluation of RAGE radiotracers,such as the animal models and RAGE knockout mice used in stroke research[38].
3.3.5.Summary
In this study,we investigated whether RAGE expression in the LPS model can be used as a biomarker with which to validate experimental RAGE PET radiotracers.Immunoreactivity of the mouse brain sections indicates measurable increases in RAGE in the male cohorts,but no difference in the female groups.There are no previously identified sex differences in RAGE brain expression,but male mice are almost exclusively used for the LPS induced neuroinflammation because of the proposed protective effects of estrogen.It would be interesting to test this hypothesis using juvenile female mice or ovariectomized female mice/rats in future studies.To evaluate the changes in RAGE levels,we synthesized tritiated RAGER,FPS-ZM1 and azeliragon for ex vivo autoradiography.However,off-target binding dominated the signal for each ligand and complicated detection of the small changes in RAGE expression observed by immunohistochemistry.As such,with the existing cadre of small molecule radiotracers available for RAGE,we conclude that use of the LPS-model is not an optimal animal model.This may change with development of improved 2nd generation radiotracers,but in the meantime alternative animal models will be considered.

Fig.7.Immunoreactivity of inflammatory biomarkers.TNFα and IL-1β immunoreactivities were compared for both sexes at 1 day and 14 day post LPS induction.Tukey’s multiple comparison test was used to evaluate the mean values.Bars show mean±standard error of the mean;*P<0.05,**P<0.01,***P<0.001.

Scheme 6.Synthesis of[3H]Azeliragon([3H]1).Note:positions of T not con firmed by NMR.
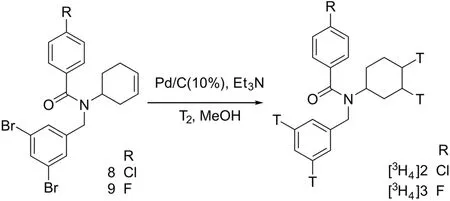
Scheme 7.Synthesis of tritiated RAGE ligands.
4.Conclusions
The implication of RAGE in numerous diseases and neurodegenerative disorders makes the receptor interesting both as a therapeutic target and as an inflammatory biomarker.In this work we have identified lead scaffolds for developing PET radiotracers targeting both the extracellular and intracellular domains of RAGE.We have synthesized two potential PET radiotracers based on these leads,[18F]RAGER(extracellular)and[18F]InRAGER(intracellular),and undertaken preclinical evaluation using in vitro and in vivo methods.While there are limitations with both PET radiotracers,demonstrated through our inability to quantify changes in RAGE observed in the LPS mouse model,we believe they are suitable lead scaffolds for developing RAGE PET radiotracers because of their high affinity for the receptor and good CNS penetration.We remain optimistic that 2nd generation analogs with more druglike properties and better selectivity for RAGE hold promise for translation into human imaging studies in the future.
Declaration of competing interest
The authors declare that there are no conflicts of interest.
Acknowledgments
Financial support from the National Institutes of Health Pharmaceutical Sciences Training Program(T32-GM007767)and the Rackham Graduate School at the University of Michigan is gratefully acknowledged.We also thank Brian Cary,Maria Fawaz,Timothy Desmond and Carole Quesada for their contributions to early in vitro and in vivo experiments conducted with[18F]RAGER.
Appendix A.Supplementary data
Supplementary data to this article can be found online at https://doi.org/10.1016/j.jpha.2020.07.009.
 Journal of Pharmaceutical Analysis2020年5期
- Journal of Pharmaceutical Analysis的其它文章
- Selective and sensitive fluorescence imaging reveals microenvironment-dependent behavior of NO modulators in the endothelial system
- Recent progress in the molecular imaging of therapeutic monoclonal antibodies
- A carbon nanoparticle-peptide fluorescent sensor custom-made for simple and sensitive detection of trypsin
- Electrochemical,spectroscopic,and molecular docking studies of the interaction between the anti-retroviral drug indinavir and dsDNA
- Fluorescent antibiotics for real-time tracking of pathogenic bacteria
- Recent advances in construction of small molecule-based fluorophoredrug conjugates