Dynamic parameters of multi-cabin protective structure subjected to low-impact load - Numerical and experimental investigations
Jing-xin M , Ru-wen Wng , Sheng-zhuo Lu ,*, Wei-dong Chen ,**
a College of Aerospace and Civil Engineering, Harbin Engineering University, Harbin,150001, PR China
b Beijing Key Laboratory of Cryogenic Technology Research, Beijing Institute of Astronautical Systems Engineering, Beijing,100076, PR China
Keywords:
ABSTRACT The dynamic response of a multi-cabin protective structure subjected to impact load directly affects the protective performance of materials; thus, studying the dynamic response and communication law of wave effect of the load plays an important role in the prediction of protective performance.In this study,the protection experiments of box-structure under air- and/or water-medium are conducted, the dynamic response of the structure subjected to low-impact load is analyzed, and the corresponding numerical simulations are analyzed using the theory of finite element method (FEM). Combined with experimental and FEM simulations, the shock strain distribution, acceleration attenuation, and signal energy in defensive materials are determined. Based on the results, the metal structure exhibits good absorption characteristics for shock vibration. Using the experimental data, we also show that the attenuation of shock wave in water medium should be significantly better than that in air medium, and the protective structure should be designed for a combination of water and air mediums.Meanwhile,the numerical simulation can provide a quantitative analysis process for dynamic analysis of defensive materials.
1. Introduction
Defensive materials are widely used in marine field[1,2],aircraft[3,4], automotive [5], wind turbines [6], medicine [7], and many other fields. In the military field, defensive materials are required for explosion experiments, storage and transportation of chemical weapons,demilitarization of outdated munitions,defensive liquidfilled cabin,and so on.In the civil field,defensive materials are used to dispose of doubtful explosives in public places. The analysis of dynamic response of materials subjected to impact load is significant for better understanding of defensive materials, and research on defensive materials has yielded productive results.The dynamic response of materials can be studied using three main methods;theoretical analysis, experimental analysis, and numerical simulation analysis. The theoretical research has already been explored extensively [7]; thus, recent studies mainly focus on the experimental analysis and numerical simulation analysis.Even if the high demand on the market and continuous research in the field of material science,specific issues have not yet been fully resolved.
Through a series of experiments, many aspects of material dynamics response had been studied, such as the damage of liquid tolerates under the impact of high-speed chip[8]and the response of containers of different levels under high-speed chip attack [9].The residual stresses might be generated to influence on structural performance [10,11] because of the cold-form shaping or welding.Under the impact/explosive load, explosion containment vessels(ECVs)had been widely used for determining the dynamic response characteristics.As the first shock wave carries most impulse of the blast loading,it has been considered as the primary-shock loading in determining the response behavior of containment vessels [12].The influence of residual stresses on the behavior of thin-walled laminates during compression until failure was further studied[2]. The shock wave in spheres hypervelocity impact on flat plates was modeled by Wen et al. [13]. For the multi-cabin protective structure, the empirical formulas for breaking and protective performance have also been studied [14,15]. However, when it comes to composites, the problem becomes much more complex [16,17].Thus, there are many numerical simulation analysis to solve this problems.
The finite element method (FEM) is an effective method for calculating structural dynamics, which was established by Zienkiewicz et al.[18].Based on the FE theory,the mechanical analysis simulation of solids has developed rapidly, and the structural analysis have become more detailed. In recent years, a theoretical computational model was established, which can describe the pressure wave [19]; the residual stresses were determined using modern FE techniques to consider several other aspects of curing[20,21].Dong et al.[22,23]systematically studied the mechanisms of the strain growth phenomenon in cylindrical containment vessels subjected to internal blast loading by theoretical analysis and FE simulation. A methodology was also presented for evaluating a strain rate sensitivity parameter for plastic deformation of bulk metallic materials [24]. Other numerical simulations were also studied based on the FE [25-30]. The development of fracture mechanics plays an important role in the study of the mechanical properties of materials, especially defensive materials. The extended FEM (XFEM), which is a meshfree method, was introduced by Belytschko,Rabczuk and et al.[31-33],and also in fiberreinforced composites [34]. In the cracking-particle method[32,35], crack can be arbitrarily oriented, while its growth was modeled by activation of crack surfaces or splitting particles [36];the concept of dual horizon was introduced to Peridynamics (DHPD) [37,38] to consider the unbalanced interactions between the particles with different horizon sizes,which can resolve the‘ghost force’ issue. Furthermore, efficient remeshing technique was used to handle the fracture problems to improve the numerical calculation efficiency [39,40], while the failure of the material was analyzed using phase field theory [41-44] and other meshfree methods [45-49].
In this study, we describe the dynamic response of metal materials, using experimental and numerical simulation analyses.Furthermore, this study is organized as follows. The materials and the experimental procedures are reviewed briefly in Section 2;while the numerical analysis, experiment, and discussions on the results are described in Section 3.This study is concluded in Section 4.
2. Objective of this study
The main objective of this study is to analyze the influence of different mediums under low-impact load. The differences between the FE and experiment results were observed, wherein the manufacturing process was not considered in numerical stability investigations.
2.1. Materials and specimens
We investigated the structural box-structure made of Q235 steel of 380 mm × 650 mm × 650 mm (width × height × length) dimensions, as shown in Figs.1 and 2, and the thickness of one ply was equal to 3.5 mm, according to the manufacturer’s specifications. The elastic material properties (E1, E2, G12, and ν12) were determined according to test standards [50,51] and are presented in Table 1.
2.2. Experimental procedures
Experimental testing was performed on a relatively stable marble platform, the strain gauges are fixed to four plates, where the strain gauges on the outside plates(No.1 and No.4)are fixed in the middle of the plate and the two plates on the inside(No.2 and No. 3) are fixed at a quarter of the upper boundary. The accelerometer was also attached on the Plate 1 to measure the acceleration during experiment, see scheme in Fig. 3. Furthermore, there are two strain gauges in every plate, horizontal and vertical direction respectively.
2.2.1. Pre-experiment preparation
Before starting the experiment, the sensors should be selected and calibrated. At the same time, the interference factors in the experimental process should also be considered,and the method of eliminating interference should be considered.
1. Selection and calibration of sensors
Sensors can convert non-electric signals into electrical signals.In this experiment, we used accelerometers, force sensors, and strain meter sensors, which can handle state signals, such as acceleration, velocity, displacement, and mechanical signals.Furthermore,the strain gauges were used to convert the strain and temperature of structures into a voltage signal. Considering manufacturer’s reasons, the DH131 piezoelectric acceleration sensor was used to determine the acceleration signals, and the force signals were collected by the DHL050 piezoelectric force sensor.Those two types were calibrated by the DongHua(DH)Testing Technology Co. LTD®, and the results are presented in Tables 2 and 3.
2. Interference and elimination
Because of the need to perform strain testing in different environments,such as factories,university laboratories,and even in the field. Therefore, external interference of various electrical and magnetic is also a variety of, the major effects are electromagnetic interference, static interference, and interference of earth voltage and current.
To eliminate the effects of interference on the experiment, we replaced the normal wires with a three-core shield, which can reduce the strain interference from±78.96 μƐ to±4.5 μƐ(Fig.4(a)and Fig.5(a)). Furthermore, the amplitude of interference changes from 43.86 μƐ to 1.07 μƐ (Figs. 4(b) and Fig. 5(b)), while the frequency is equal to 58.59 Hz.
In addition, we grounded the instrument wires during the experiment, which can decrease the interference of earth voltage and current.The strain interference is reduced to±1.5 μƐ(Fig.6(a)).Furthermore, the amplitude of interference changed to 0.09 μƐ(Fig. 6(b)), and the frequency is equal to 1269.53 Hz.
With the interference elimination processing, the interference amplitude is at least one order of amplitude less than the load signal, the strain interference of this was eliminated, and the next loading test could be conducted.
2.2.2. Experimental process
During the experiment, the force hammer hit the outside plate(No. 1) in the box, the acceleration and mechanical signals were measured by the accelerometer and strain gauges, and increased the strength of these signals by charging adapter and strain adapter,respectively. Finally, the signals were collected, displayed, and saved by dynamic state signal testing and analyzing system(DH5922).Furthermore,the process of the experiment is shown in Fig. 7. To determine the propagation law of local disturbance movement from an undisturbed area to disturb area under lowimpact load, two types of experiments were carried out: I: the three chambers are air-medium in the cavity of the box-structure;II: the chamber is water-medium in the intermediate cavity of the box-structure,only, as shown in Fig. 8.
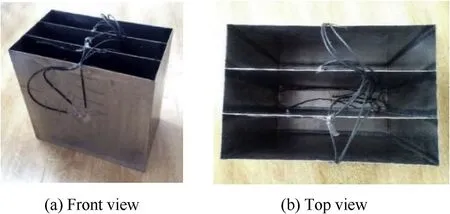
Fig.1. Structure of materials.
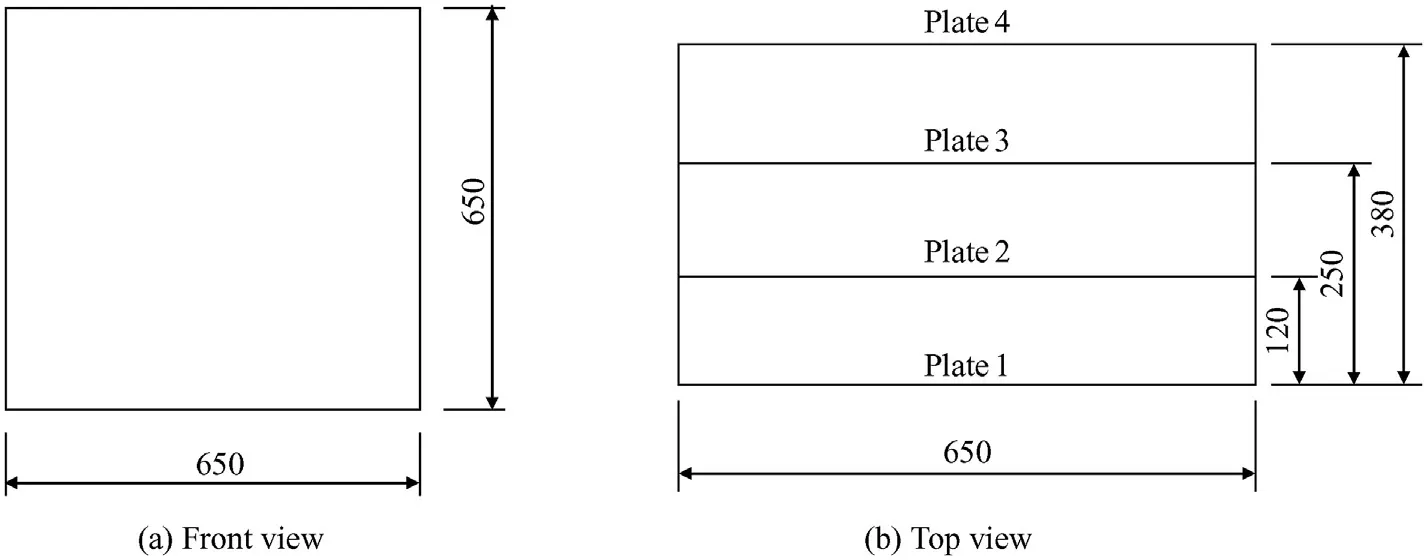
Fig. 2. Dimensions of materials.

Table 1Material properties.

Fig. 3. Position of stain gauges and accelerometer.

Table 2Calibration results for acceleration sensor.

Table 3Calibration results for force sensor.
2.2.3. Processing of experimental signals
After the signal collection is completed, we need time- and frequency-domain analysis on the amplified signal to get the disturbance propagation law more intuitively.1. Time-domain analysis
If x(n)is a discrete series of signals,its basic characteristic of the number is:
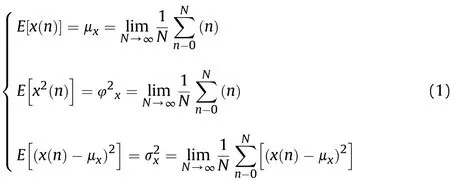
where μx,φ2x,σ2xare mean value, mean square deviation, and variance, respectively.
To describe the similarity of the two sets of discrete signals quantitatively, the concept of “discrete signal correlation” is been introduced.The cross-correlation sequence rxy(l)of x(n)and y(n)is:

Fig. 4. Time-domain and frequency-domain curve of strain (interference not excluded).

Fig. 5. Time- and frequency-domain curves of strain (with shielded).

Fig. 6. Time- and frequency-domain curves of strain (with shield and grounding treatment).
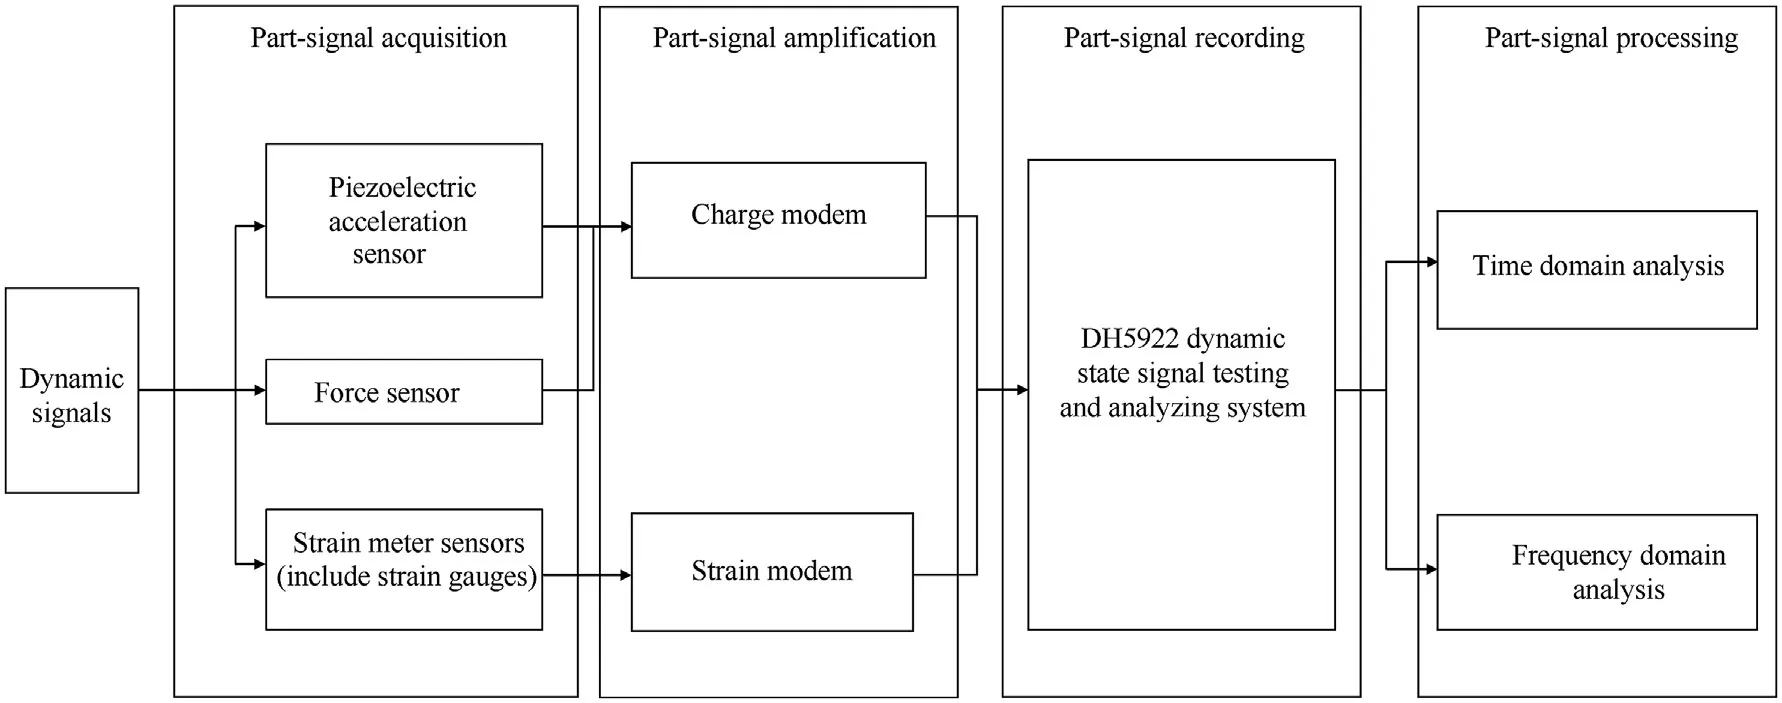
Fig. 7. Process of experimental.
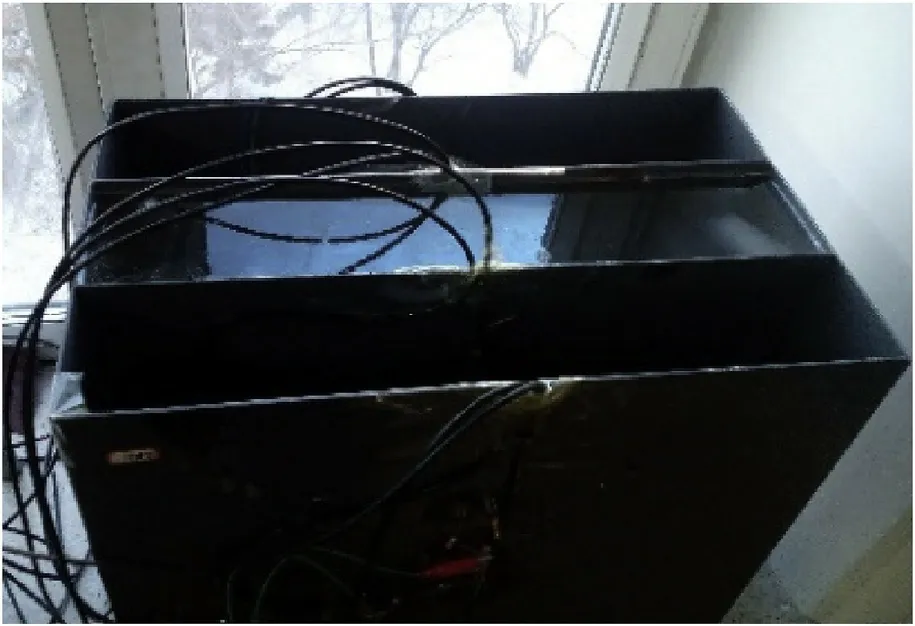
Fig. 8. Multi-media-coupled impact dynamics experimental schematic diagram.

where l is the difference value of signal points between two sets of signals.
When x(n) is equal to y(n), the cross-correlation sequence can be represented as:
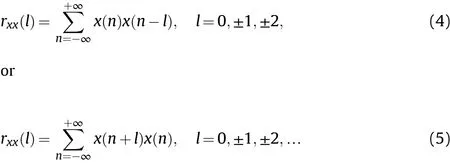
where rxx(l) is defined as self-correlation sequence.
During signal processing,when the signal amplitude is reduced or amplified by the constant amplitude, the trend of the mutual correlation sequence of the signal will not be changed, so the normalization processing of cross-correlation sequence is often used in engineering applications. Normalized cross-correlation sequence ρxy(l) and normalized self-correlation sequence ρxx(l)are defined as:

where rxx(0) and ryy(0) are the maximum of self-correlation coefficient of x(n) and y(n), respectively.
To apply the related sequence to engineering applications,biased and unbiased estimations were proposed. The biased estimation is:

Table 4Statistical results of dynamic experiment I.

Table 5Statistical results of dynamic experiment II.
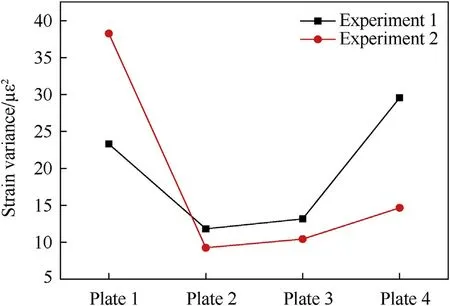
Fig. 9. Strain variance of plate.
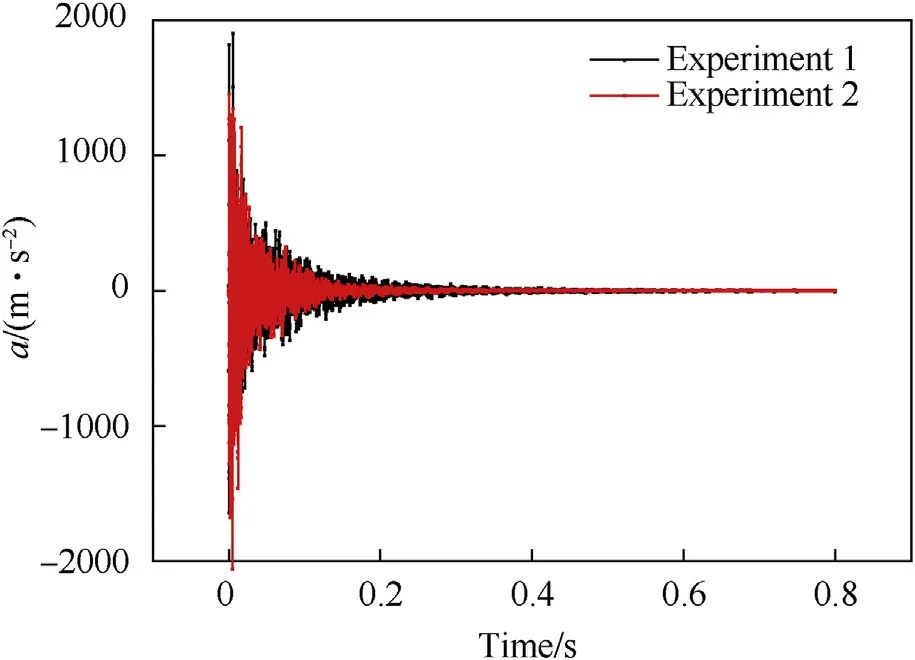
Fig.10. Acceleration.
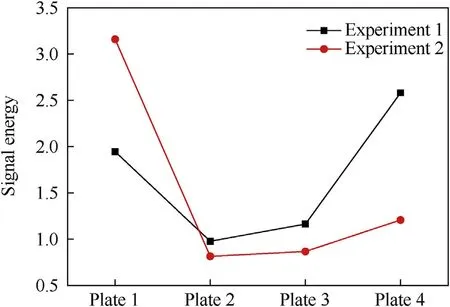
Fig.11. Signal energy of strain.
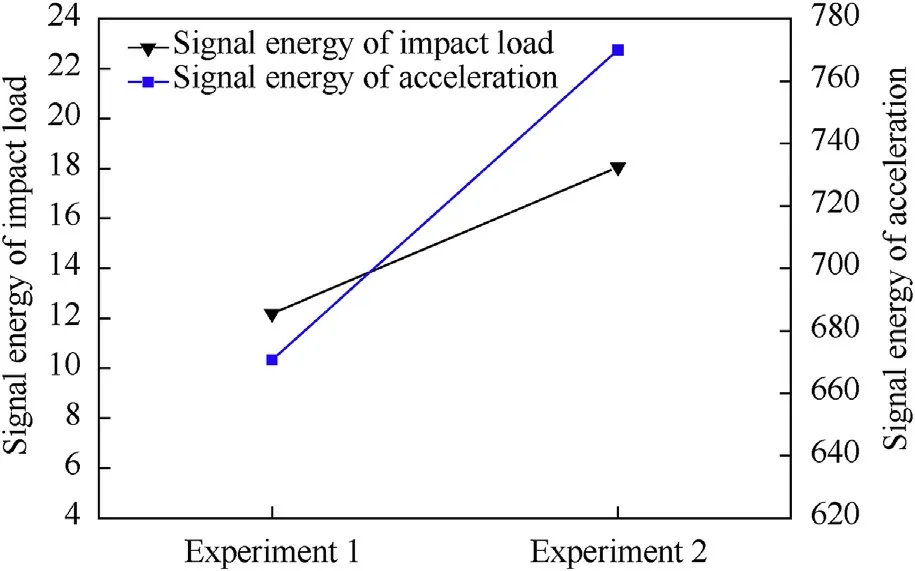
Fig.12. Signal energy of impact load and acceleration.

The unbiased estimation is:

The correlation coefficient of x(n) and y(n) can be defined as:

and


Table 6Signal energy.

Fig.13. Frequency-domain signal of strain in experiment I.

Fig.14. Frequency-domain signal of strain in experiment II.
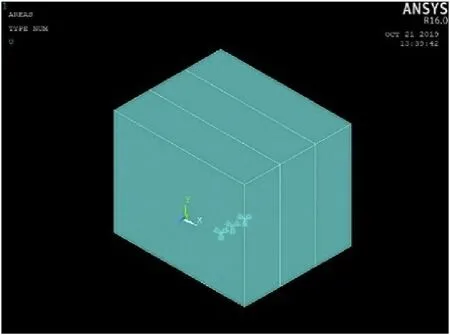
Fig.15. Numerical model.

Table 7Material parameters.
The signal energy,which can show the overall level of the signal,can be expressed as:

Under the two types of experiments, the statistical results of dynamics experiment are presented in Tables 4 and 5, where Table 4 presents the results of experiment I - the chambers are all air medium,and Table 5 presents the results of experiment II-the chamber in the intermediate cavity is the water medium.
Fig.9 shows the strain variance of Plate 1 to Plate 4.In those two experiments, the strain variance of Plate 1 and Plate 4, are larger than those in Plate 2 and Plate 3, this is because of the different constraints: Plate 1 and Plate 4 are on the outside and Plate 2 and Plate 3 are on the inside, and the inner plate is more constrained than the outer one,so the strain variance in Plate 1 and Plate 4 are relatively larger. Furthermore, because of the damping and vibration isolation effect of water-medium, the strain variance of experiment II is smaller than experiment I.
The acceleration results of those two experiments are shown in Fig.10, and because of the larger impact load in experiment II, its acceleration value is larger than that in experiment I. However, its attenuation speed is faster because of the presence of water medium and its value is stabilized rapidly.
The different values of the signal energy are presented in Table 6, and the signal energy can reflect all signal characteristics and the role of time-step. Figs.11 and 12 are the signal energy of strain,impact load and acceleration.Compared to experiment I,the acceleration is more sensitive in experiment II because of the presence of water media.
3. Frequency-domain analysis
Discrete Fourier transformation can process the corresponding signal to get its frequency domain:
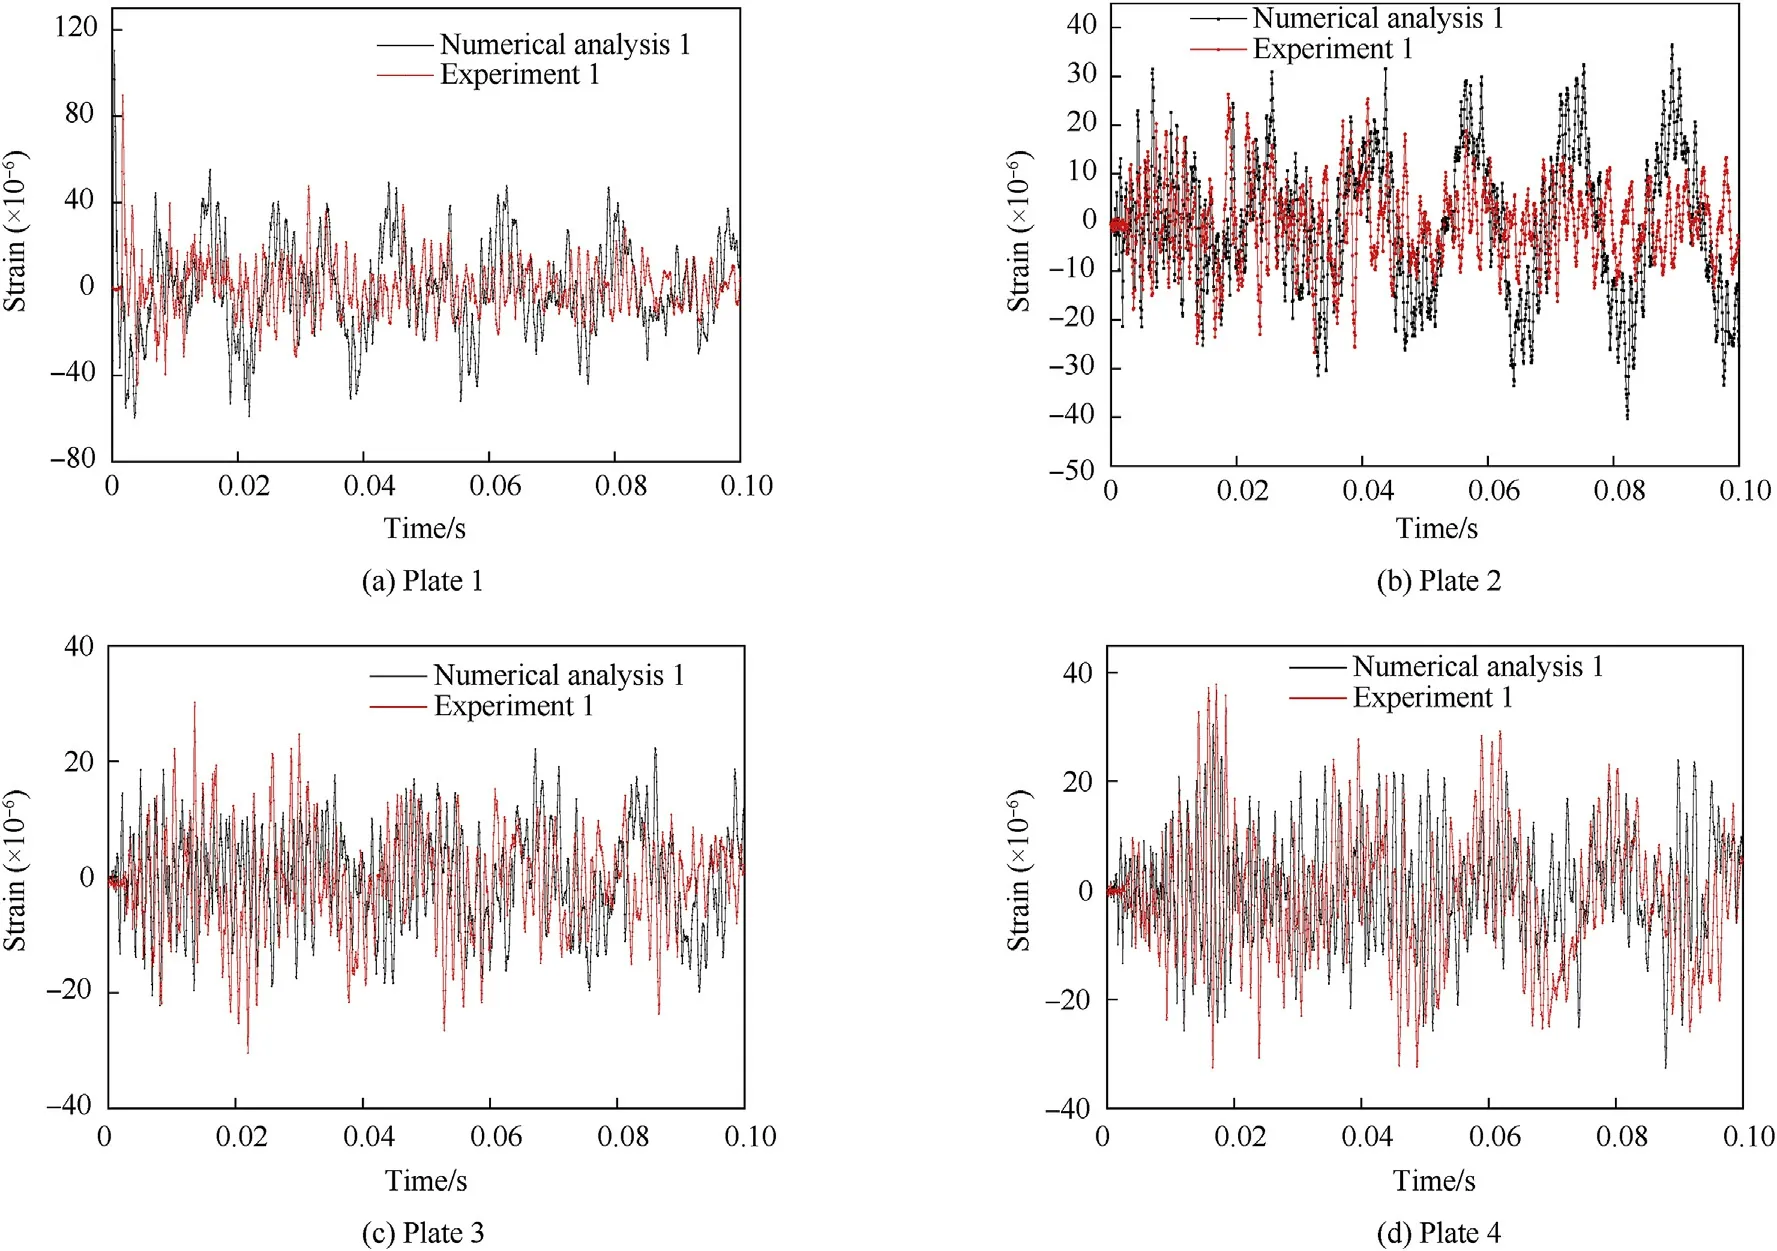
Fig.16. Strain-time results of experiment I and numerical analysis I.

Figs.13 and 14 show the frequency-domain signal of strain in experiments I and II.The strain main-frequency of Plate 1 to Plate 4 in experiment I are 683.59 Hz, 312.5 Hz, 58.59 Hz, and 683.59 Hz,respectively;while those in experiment II are 703.13 Hz,976.56 Hz,156.25 Hz, and 58.59 Hz, respectively.
4. Numerical analysis and experiment
The numerical models of multi-medium materials with airmedium and/or water-medium will be presented in this section.The analysis is divided into two parts: the three chambers are airmedium (Numerical I), and the chamber of intermediate cavity is water-medium,the other two are air-medium(Numerical II),which are the same with the experiments.
4.1. Numerical models
A numerical model has been prepared in ANSYS/LS-DYNA®Software [52]. Since the structure is thin-walled, a four-node shell element with six degrees of freedom at each node (Shell 163) was used to discretize the columns(Fig.15).In the 3D model,including 15121 elements and 33920 nodes, the steel plate is described by Mie-Grüneisen equation of state, which can be represented as:

where Γ is Grüneisen coefficient, and the parameters of steel is listed in Table 7.
To reduce the propagation of air waves at the upper border, no reflection boundary was applied.Thus,the air waves did not reflect toward the upper boundary.Moreover,the plane between the box and the ground was subjected to a fixed constraint,which can limit the displacement in its x, y, and z directions.
To avoid zero strain and stress in the calculation process,which is called the hourglass model,the concept of hourglass control was proposed in the FEM. Furthermore, in the numerical simulations,the value of keyword file (named “Keyword.K”) was changed for solving it, and the specific additions were as follows:
*HOURGLASS
1 0 0.000E+00 0 0.000E+00 0.000E+0 0
There also have questions to be solved in the process of simulations,i.e.the treatment of fluid-solid coupling and the application of impact load positions,they can all be found in the user’s manual[52].
4.2. Impact dynamics - FEM validations with theory
In the basic theory of FEM, the control body in the dynamic problem should satisfy the following three equations:
1. Balance conservation:
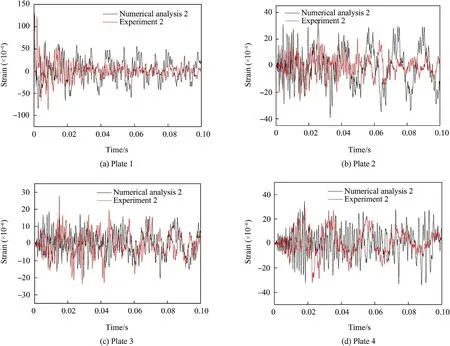
Fig.17. Strain-time results of experiment II and numerical analysis II.

Table 8Maximum value of strain in Plate 1 to Plate 4.

Table 9Minimum value of strain in Plate 1 to Plate 4.

2. Geometric conservation:

3. Physical conservation:

where μ is the damping coefficient and D is the elastic constant.
The displacement can be expressed as follows:

where N = [N1N2… Nn].
The boundary conditions include the boundary conditions of forces and displacement:

where Γtand Γuare the boundary conditions of forces and displacement, respectively.
With Eq.(17)and Eq.(18),the motion equation can be expressed as follows:

The virtual displacement is equal to zero at the boundary conditions for displacement;thus,the virtual principle of the UL format can be described as follows:

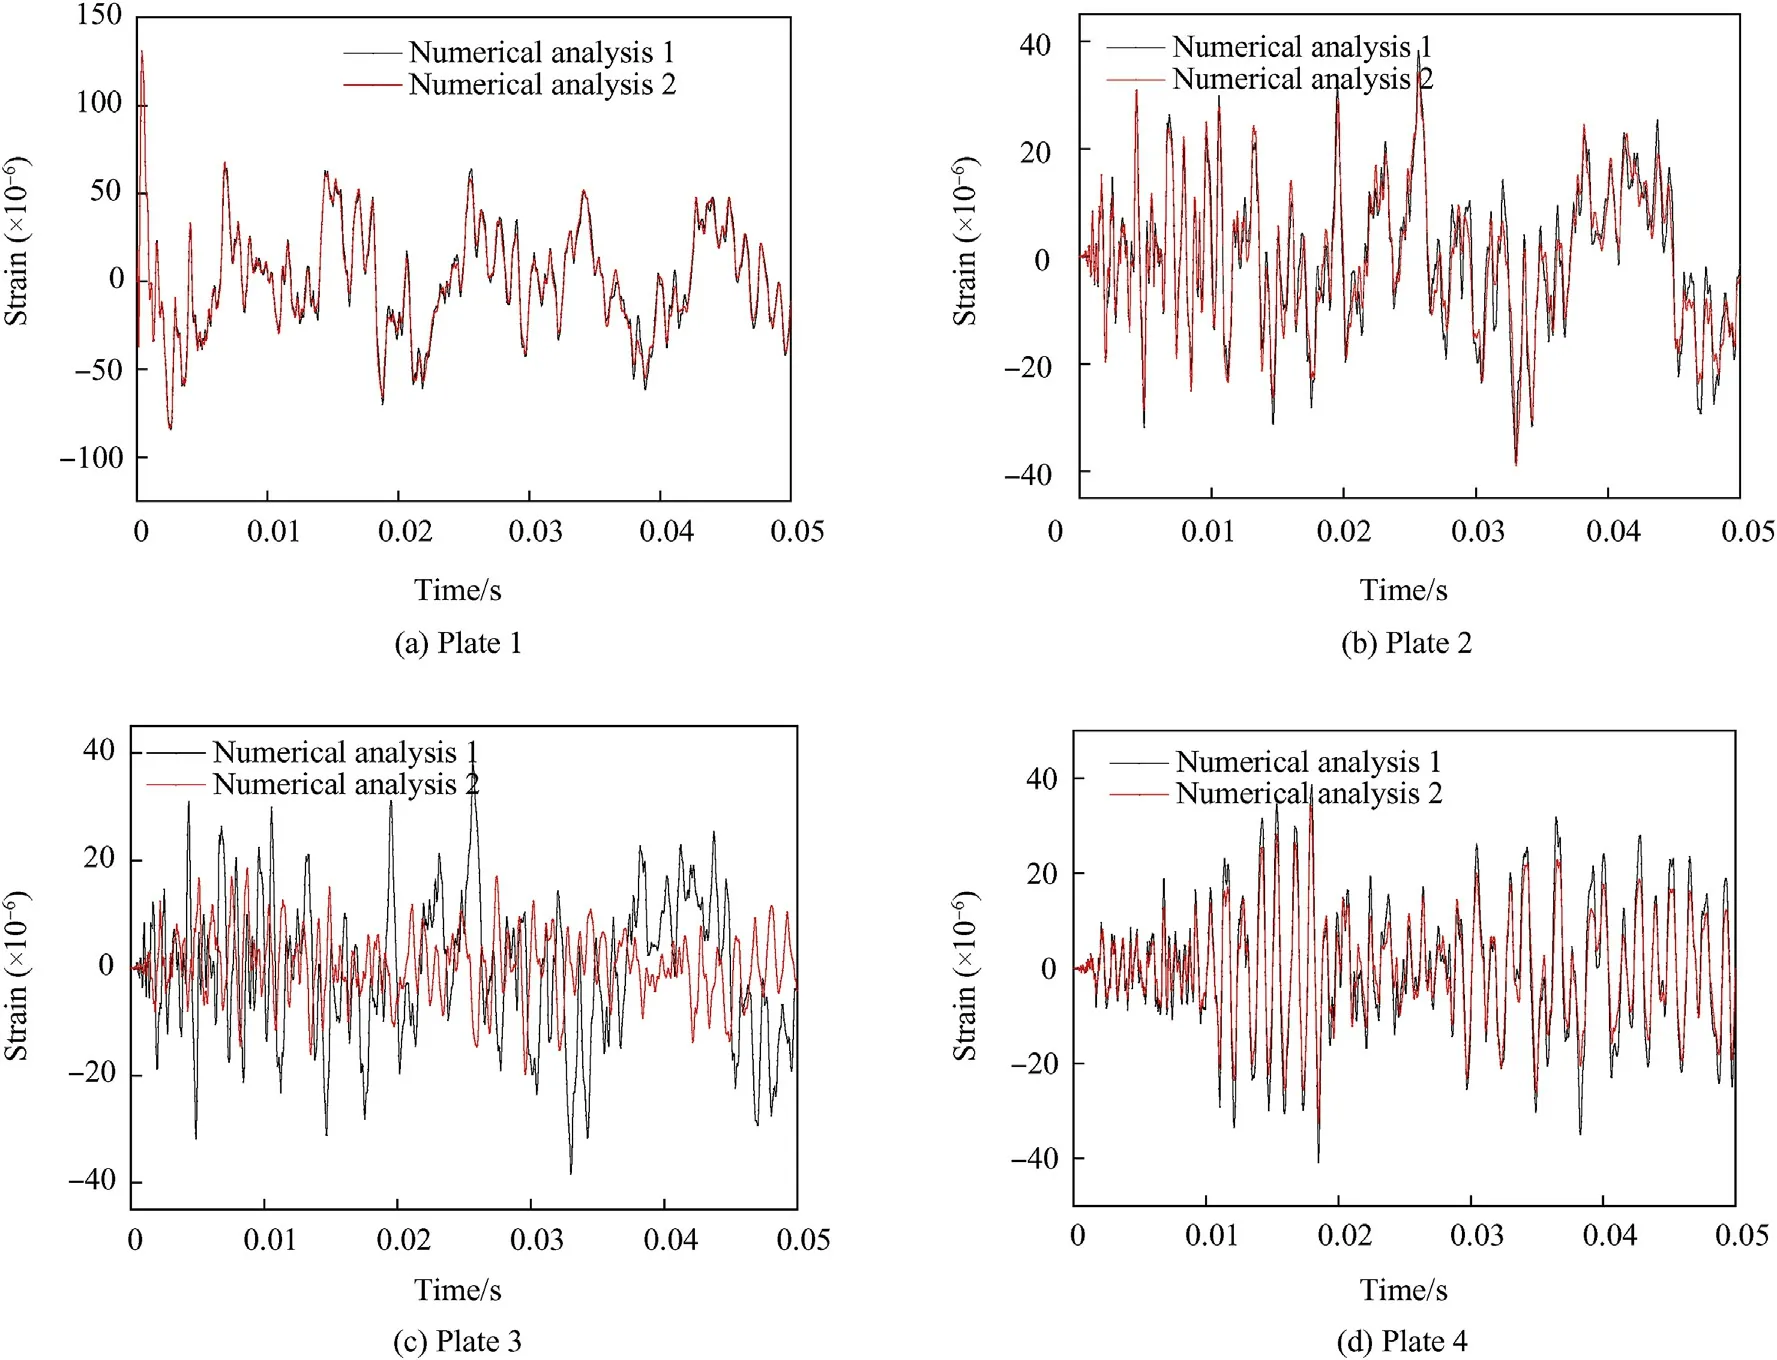
Fig.18. Strain-time results of numerical analyses I and II.
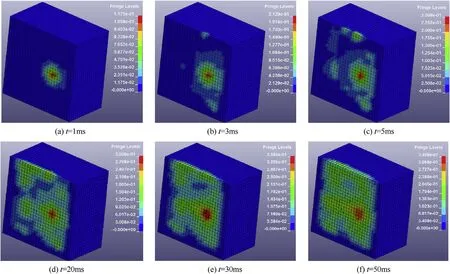
Fig.19. Pressure contours at different times in numerical analysis I.
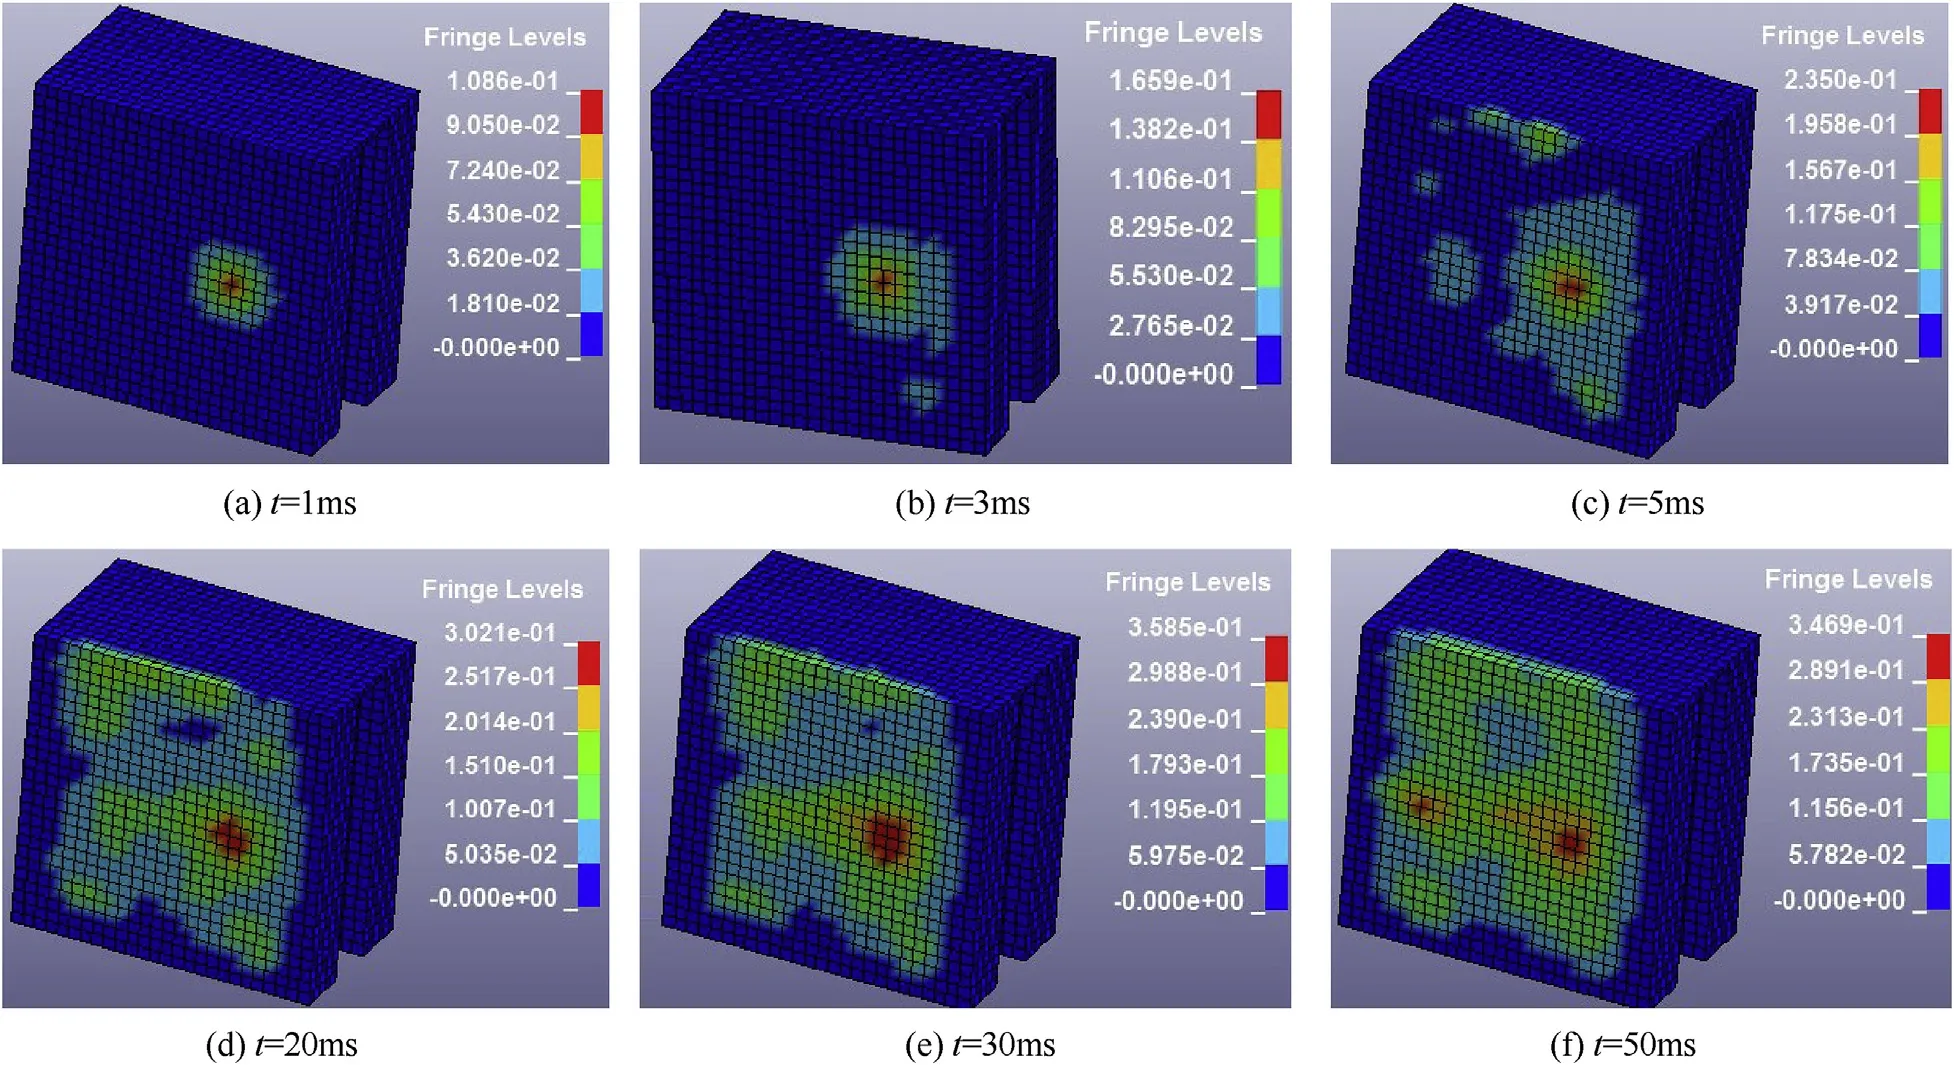
Fig. 20. Pressure contours at different times in numerical analysis II.
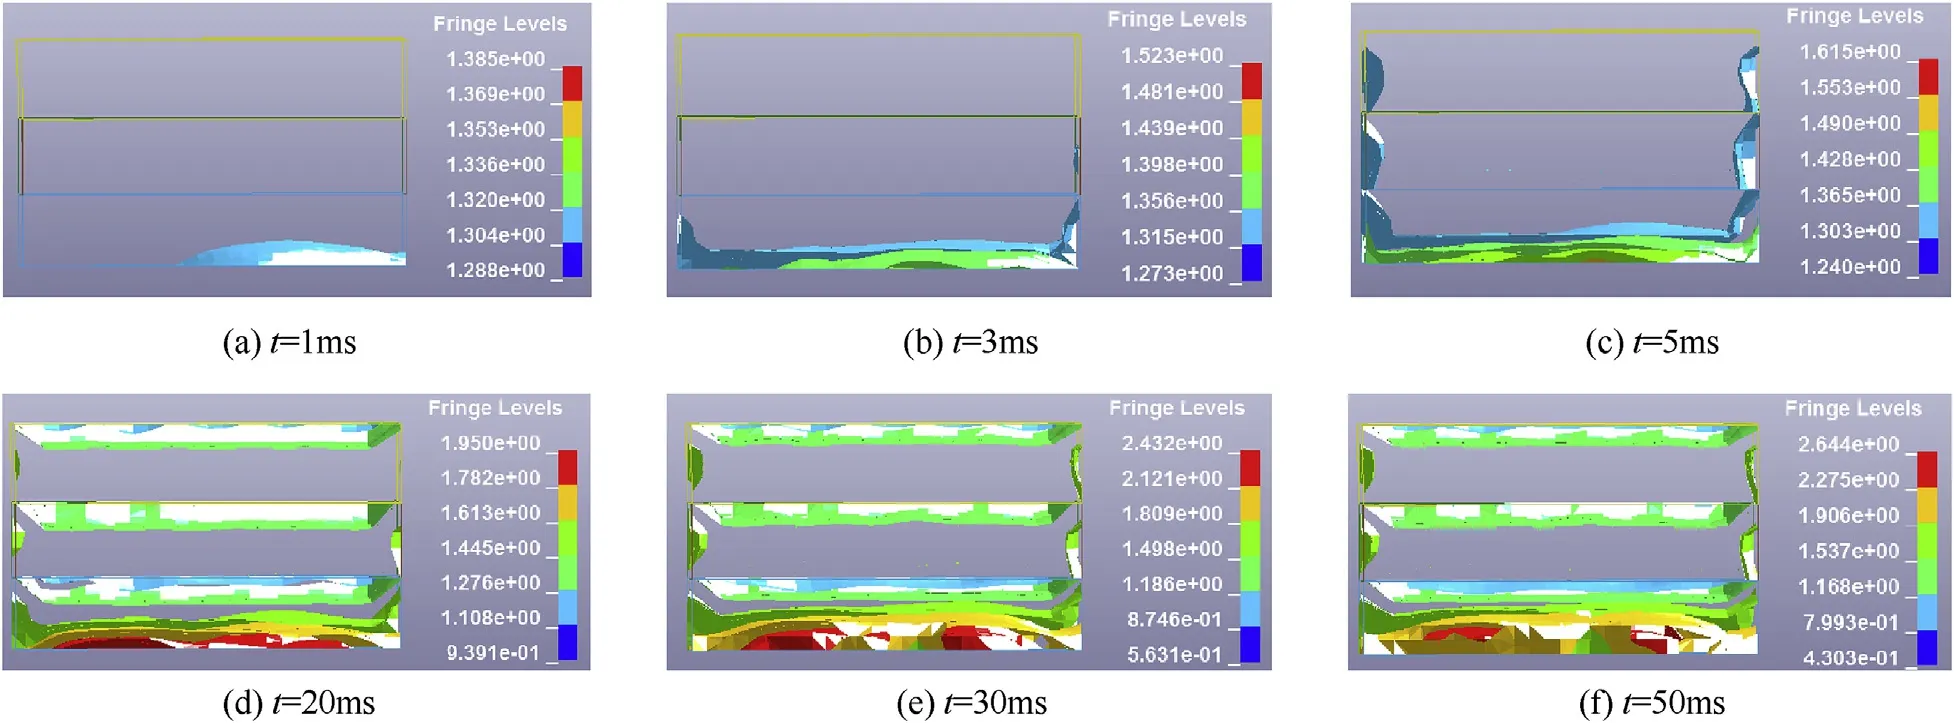
Fig. 21. Iso-surface of air density at different times in numerical analysis I.
In this model, the solid materials are described by the Johnson-Cook constitutive equation, which without the temperature effects is as follows:

where A,B,C,and n are the material parameters.For steel,those are 7.92 × 10⁸Pa,5.10 × 108Pa,0.014, and 0.26, respectively.
With the discrete region in FE, the motion equation can be solved, and the mechanical information, (stress and strain) can be solved by Eq.(21).The next time-step will continue the calculations at the end of this current time-step.
4.3. Numerical simulation and experiment
As described in Section 2.2 and Section 3.1,two experiments and two numerical analysis were performed. The process of modelling and postprocessing the compression of the columns will be the same as those in the experimental model. A comparison of the strain-time results for the four plates are shown in Fig.16 (experiment I and numerical analysis I) and Fig. 17 (experiment II and numerical analysis II). Comparisons of the maximal and minimal strains obtained from the plates in the experimental and numerical results are presented in Tables 8 and 9.
4.4. Discussion
Comparing the results of experiments I and II, the mean strain values of each plate are approximately the same, as presented in Tables 4 and 5,which indicates that the shock signal is a vibration process. The stain variance and signal energy of the plates are shown in Figs.9 and 11.The characteristic value in Plate 2 and Plate 3,which have less constraints,is much smaller than those in Plate 1 and Plate 4. Meanwhile, the stain variance values that differ from Plate 1 to Plate 3 in experiment I are twice as much as those in experiment II because of the protective effect of the water medium.
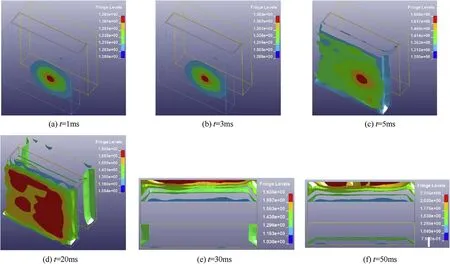
Fig. 22. Iso-surface of air density at different times in numerical analysis II.
Compared with experiment and numerical analysis,in the time of 0-0.1 s, the trend of results, as shown in Figs.16 and 17, which compared with experiment and numerical analysis, is consistent,and the extreme values are consistent well. The damping in numerical analysis I is smaller;thus,the decay oscillation of the result is slow.Furthermore,there is an impact signal on the plate 1,while the other plates are normal vibration signals.As shown in Tables 8 and 9,the margin of error is within 34%,and the errors in plates 3 and 4 are about 5%-8%,which suggests that the quantitative results and trends of the numerical analysis, and the changes in the structure with the time process are credible.
Compared with numerical analysis I and II,the results of plate 1 are almost identical for numerical analysis I and II, as shown in Fig. 18(a). The impact signal acts directly on plate 1 and the amplitude and frequency of this signal are the same; thus, the results do not change with different mediums behind the plate. As shown in Fig.18(b)-18(d), the amplitudes of strain of Plate 2 and Plate 4 in numerical analysis II are approximately the same as compared to those in numerical analysis I; however, the result of Plate 3 was approximately half of that in numerical analysis I.Therefore,when the intermediate cabin is of the water medium,the propagation of vibration is inhibited, which indicates that the damping and vibration isolation effect of the water medium is evident. Figs. 19 and 20 show the pressure contours at different time in numerical analysis I and II, while the iso-surface of air density are shown in Figs. 21 and 22. Within the first 50 ms, the impact signal of the shock wave spreads around directly;however,due to the action of the Plate 2,the spread of the shock waves was suppressed because of the action of Plate 2. Thus, the wave only spreads in the first cavity, and the pressure is of the order of 10-1.
5. Conclusions
The main objective of this study was to investigate the differences in the protective effects of air and/or water medium. We investigated two experiments which the structure box with airmedium and water-medium to verify the damping effect of the steel plate. Moreover, the results of the two corresponding numerical simulations based on FEM were calculated. First, we attempted to overcome this problem numerically, which is the most common approach.The numerical simulation results showed slower attenuation than the experimental results; however, the trend and amplitude were almost identical for the four results. In this study,we demonstrated that the attenuation of shock waves in the water medium was more significant than that in the air medium.Thus,the box with the air-water-air medium can be used for manufacturing defensive materials, and the FE numerical simulation can efficiently simulate the dynamic parameters of multimedium materials under low-impact load.
In future studies on evaluating the influence of the process on the behavior of structures, it will be necessary to understand how the defensive materials are constrained and determine the coefficients of thermal expansion of the composite.
Declaration of competing interest
The authors declared that they have no conflicts of interest to this work. We declare that we do not have any commercial or associative interest that represents a conflict of interest in connection with the work submitted.
Acknowledgements
This study was supported by the Natural Science Foundation of Heilongjiang Province, China (LH2019A008) and the National Natural Science Foundation of China(51508123,named‘Study on blast response of floating roof storage tank in material point method’).
- Defence Technology的其它文章
- Analysis of the stress wave and rarefaction wave produced by hypervelocity impact of sphere onto thin plate
- Effect of bending temperatures on the microstructure and springback of a TRIP steel sheet
- An eikonal equation based path planning method using polygon decomposition and curve evolution
- Influence of active constrained layer damping on the coupled vibration response of functionally graded magneto-electro-elastic plates with skewed edges
- Consequence of reinforced SiC particles and post process artificial ageing on microstructure and mechanical properties of friction stir processed AA7075
- Crashworthiness performance of hybrid kenaf/glass fiber reinforced epoxy tube on winding orientation effect under quasi-static compression load

