
The New Minimum of Sea Ice Concentration in the Central Arctic in 2016
2020-09-29 00:53:12WANGKeandZHAOJinping
WANG Ke, and ZHAO Jinping, 2), *
The New Minimum of Sea Ice Concentration in the Central Arctic in 2016
WANG Ke1), and ZHAO Jinping1), 2), *
1),,266100,2),,266100,
In view of the extremely low sea ice concentration (SIC) appeared at high latitudes of the Arctic in the summer of 2010, the changes of SIC in the central Arctic from 2010 to 2017 were investigated in this paper based on the AMSR-E/AMSR-2 SIC products retrieved by the NT2 algorithm. The results show that the extremely low sea ice concentration in the central Arctic not only occurred in 2010 but also occurred again in 2016, and the daily average sea ice concentration (ASIC) reached a minimum of 0.70, which was significantly lower than the value of 0.78 in 2010 and became a new historical low record. A large area of sea ice in the sector 150˚E–180˚ in 2010 disappeared in 2016, which was the most important difference to produce the new minimum. Also, the ice edge in 2016 retreated into the 85˚N circle, whereas in 2010 it was far from the central Arctic. In 2010 and 2016, there were high correlations between the wind stress curl and the relative variation rate of, which indicates that wind stress curl (WSC) drove the divergence of sea ice. It directly leads to the decrease in the SIC and is the main cause of the extremely low SIC events. The results in this paper show that the decline of Arctic sea ice is represented by not only the reduction of sea ice coverage but also the reduction of SICs. The central Arctic has always been covered by large amount of sea ices, so the drastic reduction of SIC will not only change the structure of the ice field, but also lead to critical climatic effects that deserve further attention.
sea ice concentration; AMSR-E/AMSR-2; central Arctic; wind stress curl
1 Introduction
The Arctic is one of the major regions to influence the global climate change, and sea ice is a key element in the Arctic climate system, affecting the climate change throug- hout the Arctic dynamically and thermodynamically (Par- kinson., 1999; Tucker III., 2001; Lindsay and Zhang, 2005). The Fifth Assessment Report of the Intergovernmental Panel on Climate Change (IPCC) pointed out that Arctic sea ice has been in continuous loss since the 1980s, and the average sea ice extent in the Arctic may shrink by 3.5%–4.1% per 10 years (IPCC, 2014). The average results of multiple models showed that by the end of the 21st century, the Arctic sea ice extent will decrease by 43%–94% in September and by 8%–34% in February (Kay., 2011; Tietsche., 2011). The phenomenon of full melting of Arctic sea ice in summer may occur before 2030 (Overland and Wang, 2007, 2013).
The reduction of sea ice in summer leads to an increase in the area of open water, which makes seawater to absorb more solar radiation. Then the increase of heat content in the mixing layer of the ocean causes the delay of sea ice frozen and impacts the sea ice growth in winter (Perovich., 2008). The first-year-ice is easy to melt in the following summer, supporting a positive feedback mechanism for sea ice-albedo (Rothrock., 2008; Ku- mar., 2010; Raddatz., 2013). Also, the thinning of sea ice in summer, the reduction in sea ice area and the increase in open water make the Arctic sea ice more susceptible to wind fields (Zhang., 2004; Sepp and Jaagus, 2011; Vermaire., 2013). Thus, the reduction of Arctic sea ice is the results of complicated interactions between the atmosphere and ocean (Maslanik., 2007; Wu., 2014; Cui., 2015).
During the Chinese National Arctic Research Expedition in 2010, it was noticed that a large area of open water appeared in the central Arctic, and the high navigation speed of ships also supported a low sea ice concentration (SIC). Then Zhao. (2018) found that the low SIC in the central Arctic in 2010 was a historical low value. Based on the high correlation between SIC and wind stress curl, the low SIC in the central Arctic was inferred to be mainly forced by the positive wind stress curl.
At present, the international researches on Arctic sea ice are plentiful, while studies on the low SIC and the influencing factors in the central Arctic are still few. In this paper, the changes of SIC in the central Arctic from 2010 to 2017 are presented and a new minimum of SIC in central Arctic in 2016 is identified. The relationship between sea ice concentration and wind stress curl is discussed.
2 Data
2.1 Data for Sea Ice Concentration
The SIC obtained from satellite observations refers to the percentage of sea ice area in the unit pixel grid (Comiso., 1997). AMSR-E (the Advanced Microwave Scanning Radiometer for EOS) is a full-energy passive microwave radiometer mounted on the AQUA satellite. It was launched on May 4, 2002 and disabled on October 4, 2011. Its successor AMSR-2 was launched on May 18, 2012. So SIC data was produced by AMSR-E from 2002 to 2011 and by AMSR-2 since July in 2012.
The SIC products used in this paper are retrieved by ASI (ARTIST Sea ice) algorithm, NT2 (NASA Team 2) algorithm and DPR (Dual Polarized Ratio) algorithm. The resolution of ASI algorithm is 6.25km×6.25km, which is the highest of all algorithms (Markus and Cavalieri, 2000; Spreen., 2008). The resolutions of NT2 algorithm are 25km×25km, 12.5km×12.5km and 10km×10km (Comiso., 2003). The resolutions of DPR algorithm are 12.5km×12.5km and 10km×10km (Zhang., 2013). The SIC data used in this paper includes the following four types.
1) The SIC products in HDF format from 2010 to 2017 inversed by using the NT2 algorithm obtained by the Uni- versity of Bremen, Germany, with a resolution of 6.25km×6.25km (http://www.iup.uni-bremen.de:8084/amsr/am sre.html).
2) The SIC products from 2010 to 2011 inversed by using the NT2 algorithm released by NSIDC (National Snow and Ice Data Center), with a resolution of 12.5km×12.5km (https://n5eil01u.ecs.nsidc.org/AMSA/AE_SI 12.003/).
3) The SIC products from 2012 to 2017 inversed by using the NT2 algorithm released by JAEA (Japan Aerospace Exploration Agency), with a resolution of 10km× 10km (http://gcom-w1.jaxa.jp/product-download.html).
4) The SIC products from 2010 to 2017 inversed by using the DPR algorithm jointly released by Ocean University of China and Qingdao Marine Instrument Research Institute. The products resolution is 10km×10km.
2.2 Wind Velocity Data on Sea Surface
The wind velocity data used in this paper is NCEP/ NCAR Reanalysis I data product acquired by the National Center of Environment Prediction and the National Center for Atmospheric Research. The sea surface wind velocity data used in this paper was the NCEP/NCAR Reanalysis 6h products from 2010 to 2017, with a resolution of 2.5˚×2.5˚.
3 Multiyear Changes of SIC in the Central Arctic
A large-scale decline in sea ice has been found in the Arctic since the turn of the century. The phenomenon mainly occurs at the edge of packed ice, while the central Arctic is always covered by heavy ice. In the summer of 2010, an extremely low SIC, a record minimum of SICs in history, suddenly occurred in the central Arctic and a large number of areas with open water appeared (Zhao., 2018).
3.1 Multiyear Changes of ASIC in the Central Arctic
The overall ice condition in the central Arctic can be obtained from the SIC at all grid points to the north of 85˚N by area-weighted average, and the parameter is called(Zhao., 2018).

where C(x, y, t) is the SIC at each grid point, and S is the area of the region between a specified latitude (here, it takes as 85˚N) and the blind zone of satellite coverage (about 88.25˚N). The daily ASIC in the central Arctic from August to September each year was plotted in Fig.1.
Fig.1 shows that the high dailyin the Arctic central, higher than 0.9, dominated most periods from 2010 to 2017. There were four main periods in which the daily average SIC was less than 0.9: 2010 (0.78), 2011 (0.81), 2013 (0.86), and 2016 (0.69). Thus it can be seen that in 2016, the central Arctic had a low sea ice concentration that was even lower than that in 2010. The lowest dailys in 2010 and 2016 both appeared in early September.
Although the minimum dailyreflects the reduction of sea ice, it cannot quantitatively reflect the persistence of low concentration over a period of time. To this end, we averaged the dailyin August and September to get a two-monthparameter (2M):
where T is from August to September. A low value of C2M presents that the low SIC lasted a long time. The yearly values of C2M were shown in Fig. 2.
Fig.2 shows significant interannual difference of2Min the central Arctic. Thelow values occurred in 2010 (0.90), 2013 (0.92), and 2016 (0.88), indicating that the low SICs in these three years lasted longer. Although the dailywas low during 2011, it lasted for a short time. Both the results in Figs.1 and 2 suggest that the low SIC phenomenon in 2016 was more obvious than that in 2010. Zhao. (2018) used the speed of the icebreaker to prove the extremely low SIC in 2010, based on the fact that the ship can sail at full speed in a wide area of open water. In 2016, the SIC was lower than that of 2010 and lasted longer, which will impact seriously on navigation and ocean-atmosphere heat exchange in the central Arctic.
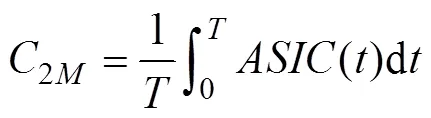
In order to reflect the difference of the SIC in the central Arctic each year more clearly, the SIC distribution at the days with the lowest SICs in the central Arctic in each year of 2010–2017 are plotted in Fig.3.
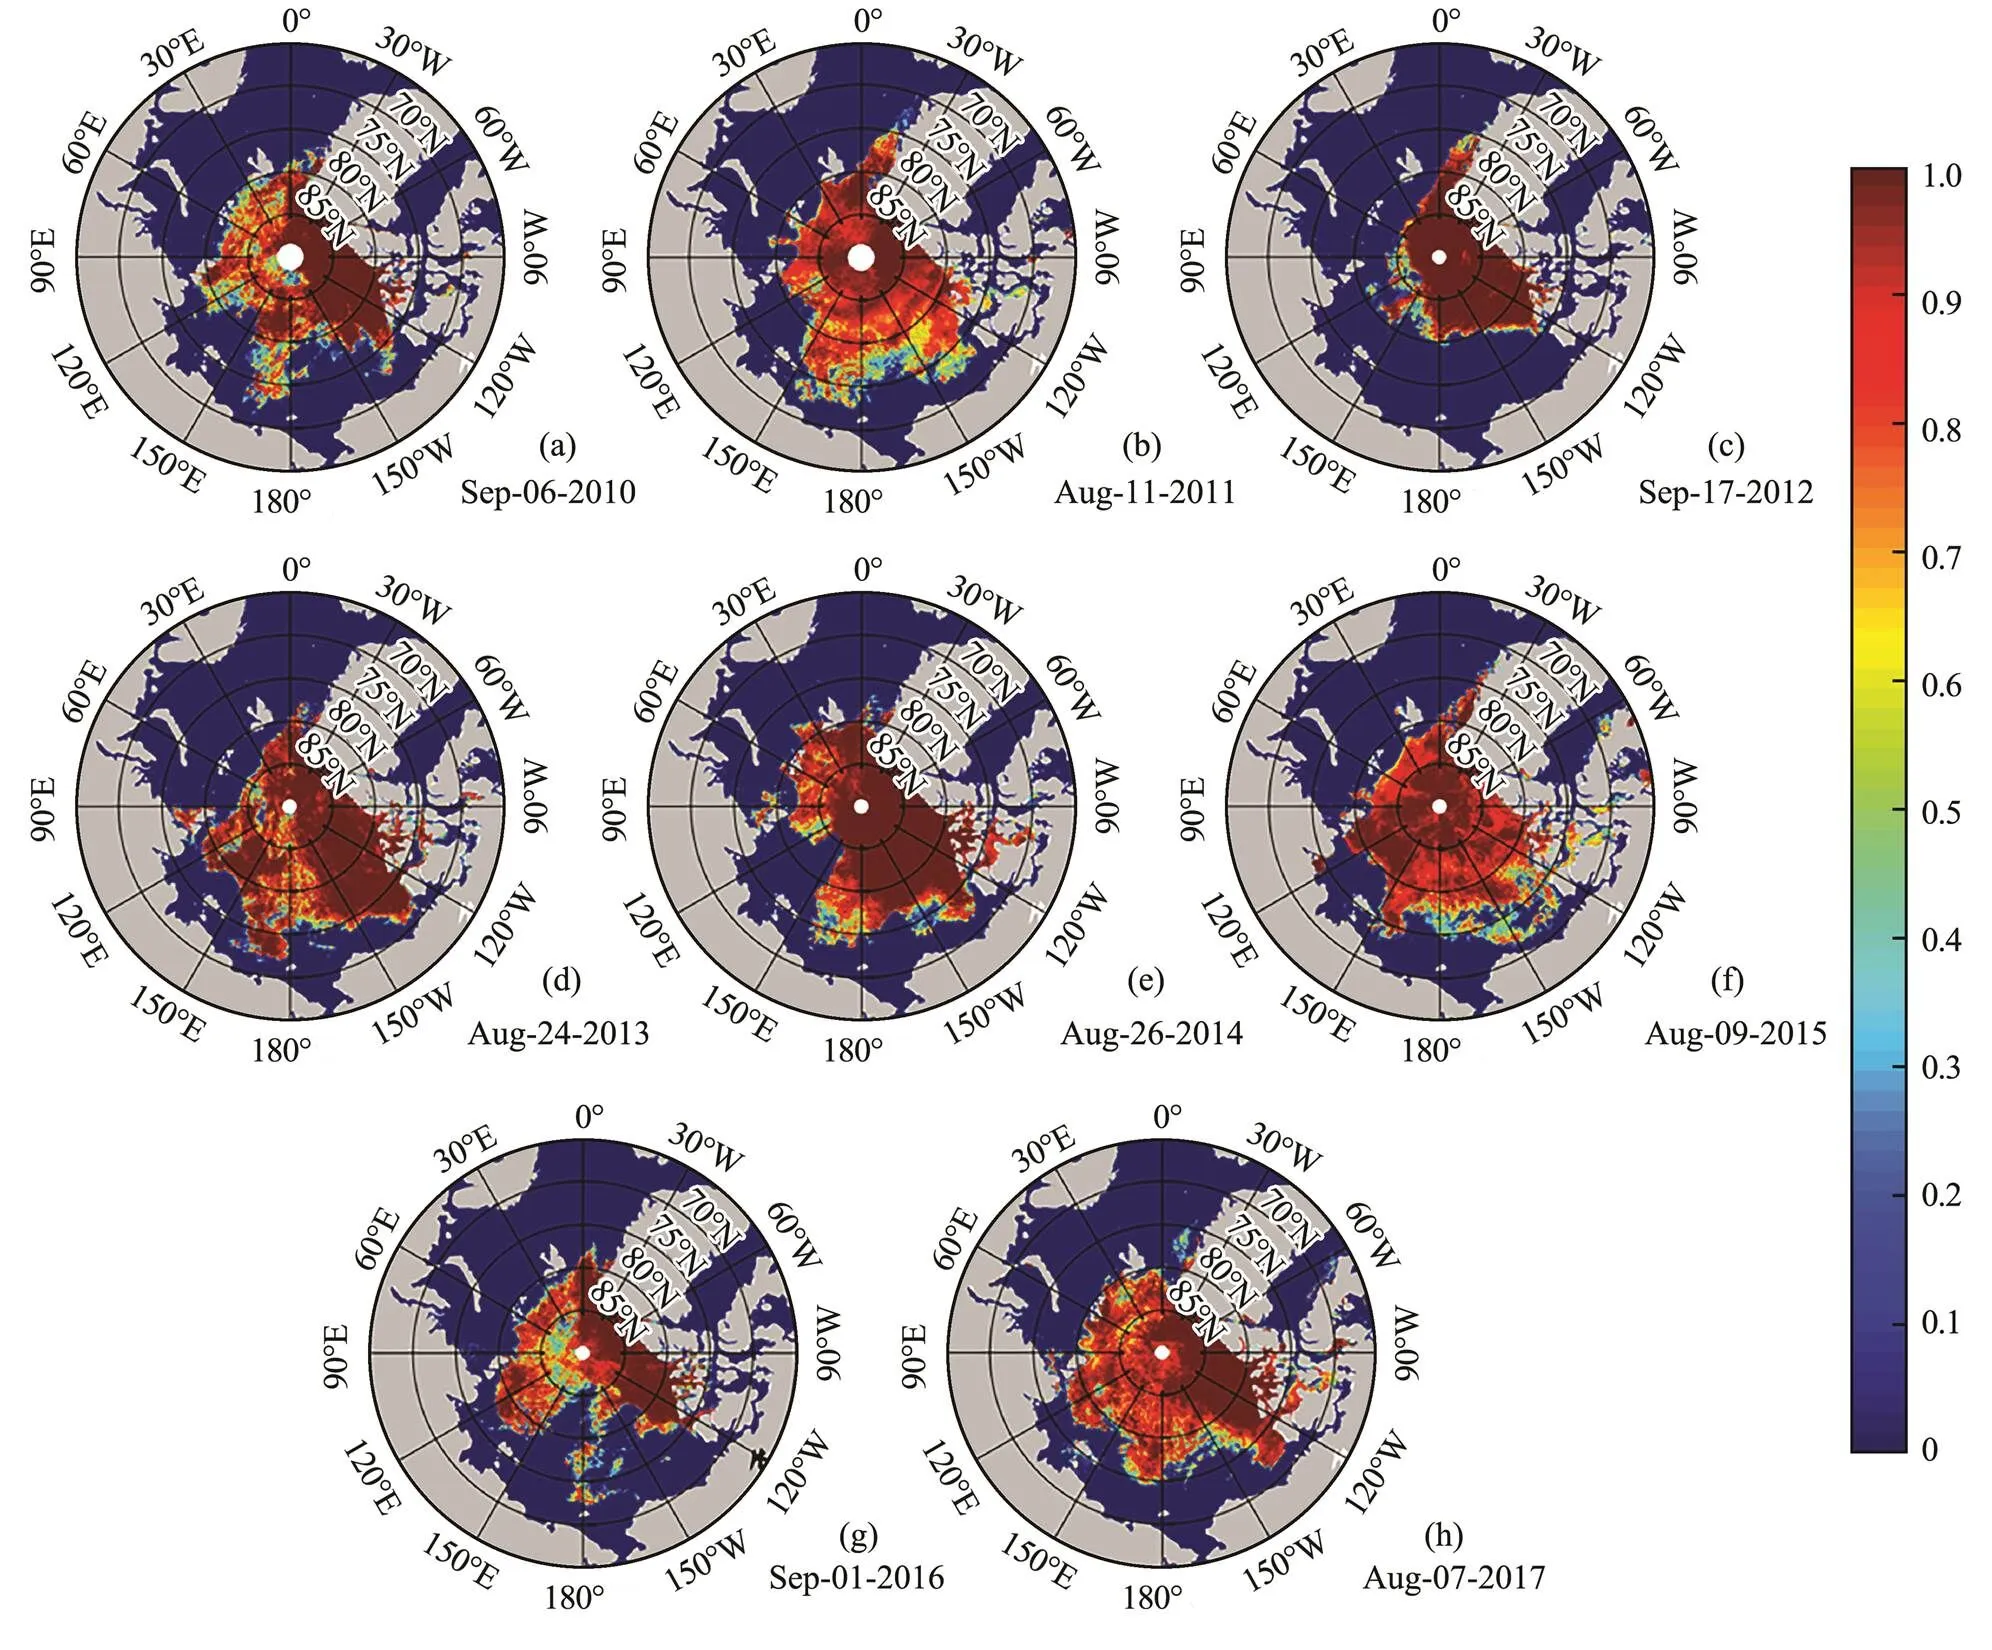
Fig.3 The SIC distribution at the days with the lowest SICs in the Arctic Ocean each year from 2010 to 2017. The white circle around the pole is the North Pole blind zone due to satellite orbital geometry.
Regionally, the interannual variation of SIC in the Atlantic sector around the Arctic was small, whereas in the Pacific sector it was quite obvious. Although 2012 was the year with the lowest coverage of sea ice in the whole Arctic Ocean, the SIC in the central Arctic in 2012 was relatively high. Whereas in 2010 and 2016 the minimum values of SIC occurred in the central Arctic, but the ice coverage in the whole Arctic Ocean was relatively higher.
It is clear from the Fig.3 that there were two ways that the SIC in the central Arctic reduced. One was that sea ice became sparse, and the other was edge invasion of ice- free seas. Since the central Arctic was covered by sea ice all year round and far away from open waters, the second case was rare. The reduction of SIC in the central Arctic presents the sparse of interior sea ice and it did not affect the coverage of sea ice. This is a significant situation relating to the Arctic sea ice decline.
4 Comparison of Low SIC Conditions Between 2010 and 2016
Above all, in the past 10 years, a significant reduction of sea ice in the central Arctic which was similar to that in 2010 also happened in 2016. To further understand the significant decrease of sea ice in the central Arctic, we compared the sea ice situation in 2010 and 2016.
Fig.4 shows the distribution of SIC at the days with lowest SICs in the two years. It can be seen that the sea ice in the central Arctic decreased massively in the two years, and a large extent of low SIC areas appeared in the eastern Arctic Ocean. The extreme low SIC in 2016 mainly appeared in the Pacific sector, especially in the sector of 150˚E–180˚ where the sea ice disappeared.
According to the sea ice distribution, 2016 was the se- cond lowest year of sea ice coverage (https://wattsupwith that.com/reference-pages/seaice-page/). Internationally, the area with the SIC greater than or equal to 15% is usually taken as the sea ice coverage area. The sea ice coverage area in the central Arctic in 2016 was 4.44×10⁵km2and that in 2010 was 9.03×10⁵km2, indicating that the sea ice coverage in the central Arctic in 2016 was much smaller than that in 2010.
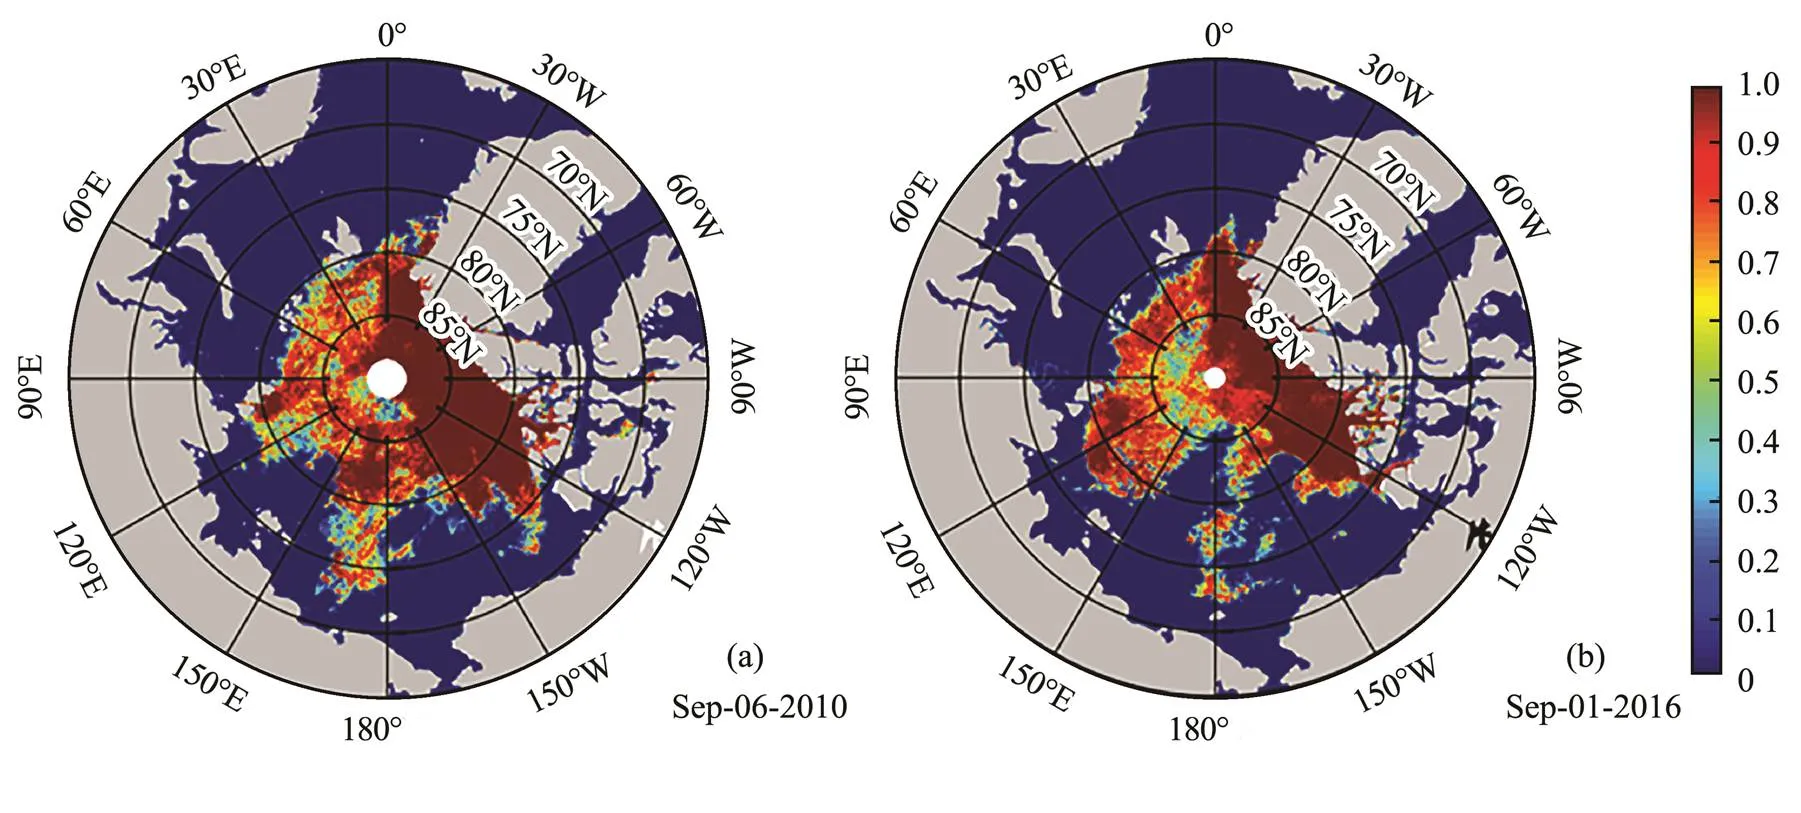
Fig.4 Distribution of SIC at the lowest SIC in the Arctic Ocean in 2010 and 2016.
In order to better understand the difference in sea ice coverage in these two years, the outlines of the ice edge when the sea ice coverage was lowest were shown in Fig.5. It can be seen that both outlines in the Atlantic sector are very close, showing little changes. The main difference occurred in the Pacific sector. In 2016, the ice ton- gue extended to the east Siberian Sea in the sector 150˚E– 180˚ in 2010 vanished, which contributed the new minimum of SIC in central Arctic. Also, the outer edge of sea ice in 2010 was far from the central Arctic, whereas in 2016 it shrank along 180˚, even entered the 85˚N circle. Therefore, the minimum in the central Arctic in 2016 was contributed by both the extremely low SIC and the invasion of the ice edge, resulting in a more severe low SIC in 2016.
There was no navigation speed data of icebreaker av- ailable in 2016 to validate the remote sensing data. In order to avoid the possible false signal caused by the algorithm, we compared the results calculated by different algorithms (Fig.6). Fig.6a shows the results of the NT2 algorithm, in which the minimum SIC was 0.78 in 2010 and 0.70 in 2016, and the2Mwas 0.90 in 2010 and 0.88 in 2016. Fig.6b shows the results of ASI algorithm, in which the minimum SIC was 0.84 in 2010 and 0.72 in 2016, and the2Mwas 0.92 in 2010 and 0.89 in 2016. Fig.6c was the result of DPR algorithm, in which the minimum SIC was 0.80 in 2010 and 0.73 in 2016, and the2Mwas 0.91 in 2010 and 0.90 in 2016. Therefore, the results of the three algorithms were quite consistent in the values of minimum SICs in the central Arctic in 2016.
Fig.5 Comparison of the outer edges of sea ice between 2010 and 2016 at the days with the lowest sea ice coverage in Arctic. Red and blue lines are for 2010 and 2016, respectively.
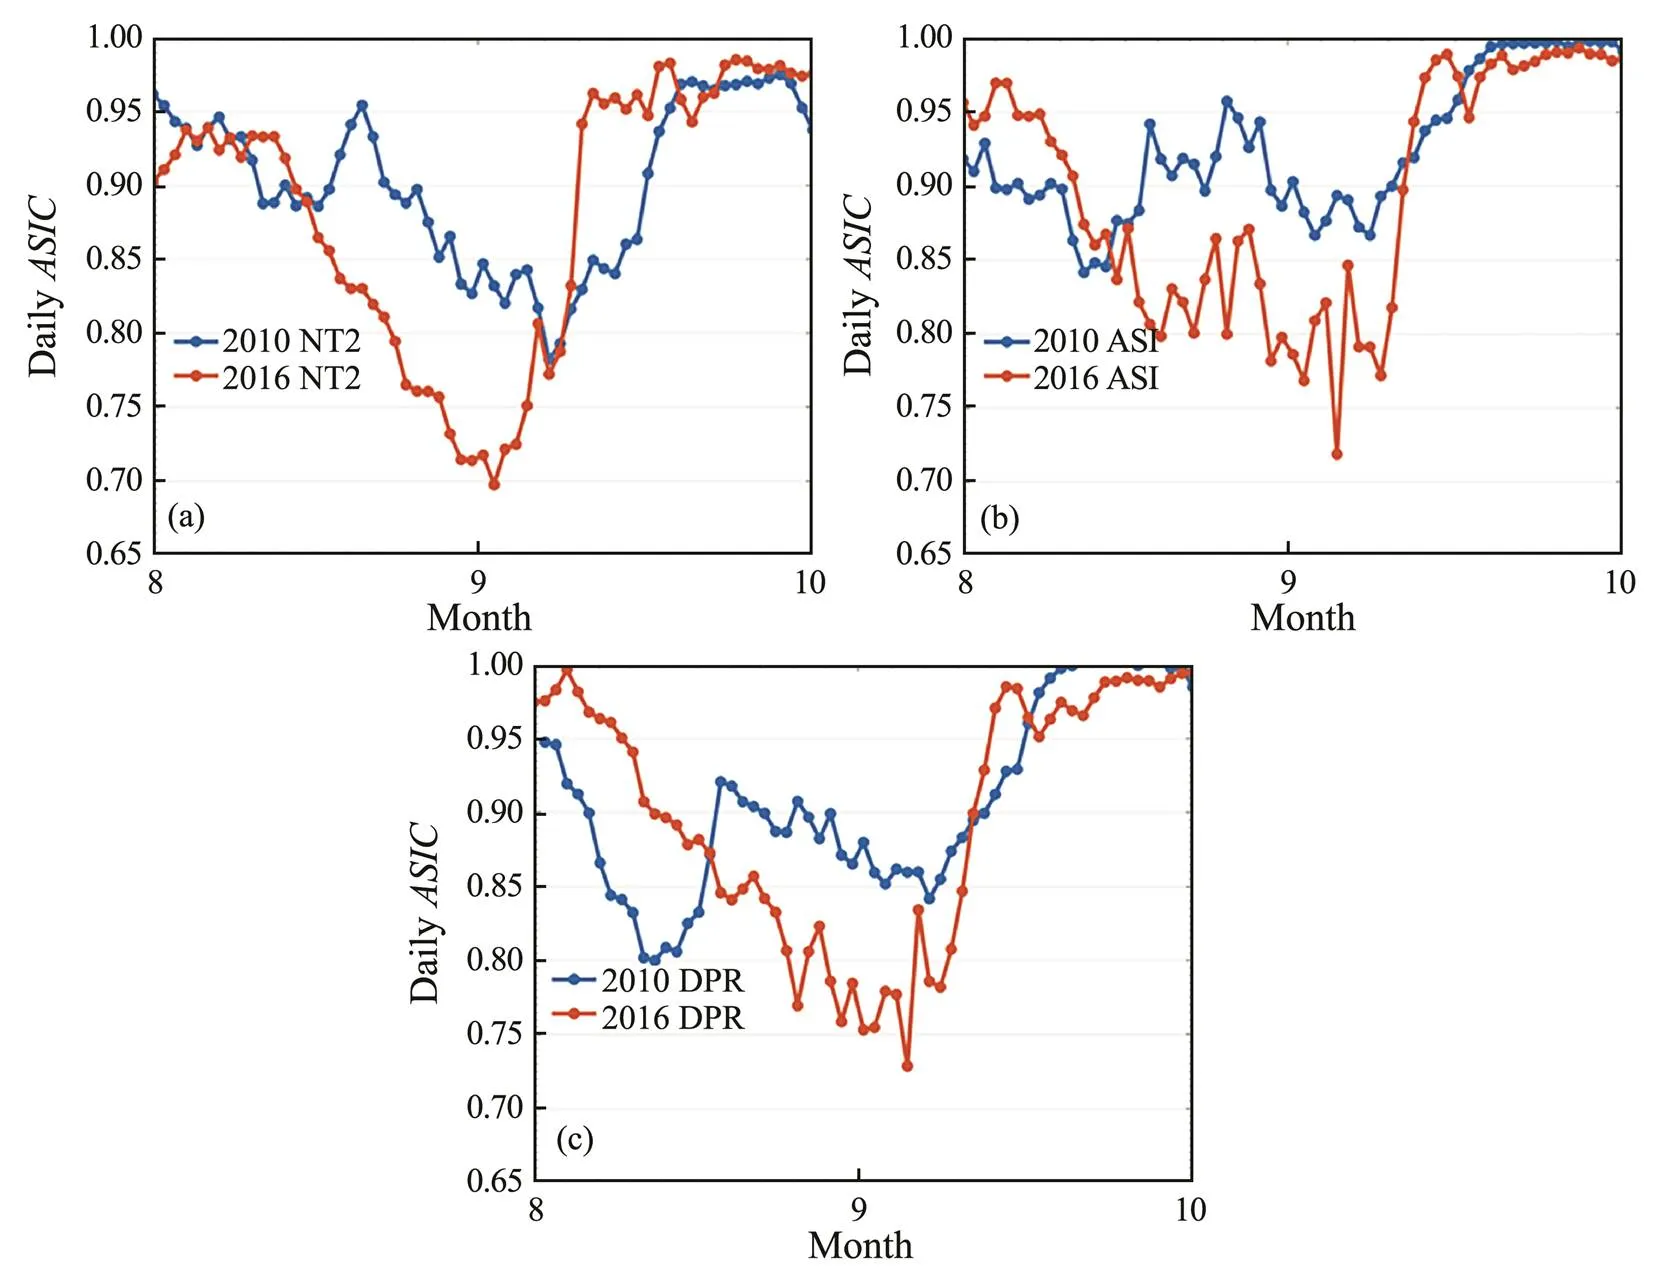
Fig.6 Daily ASIC in 2010 (blue line) and 2016 (red line) retrieved by different algorithms. (a), NT2 algorithm; (b), ASI algorithm; (c), DPR algorithm.
5 The Relationship Between Average SIC Variation and Wind Stress Curl
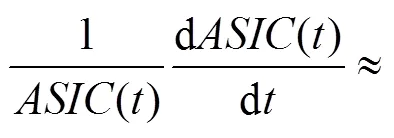
Zhao. (2018) proposed that the reduction of sea ice in the central Arctic was not caused by melting in the field. The wind stress curl was the main driving factor for the variation of SIC. Sea ice could diverge or converge under the forcing of wind. When the SIC was high, the response of sea ice on the wind stress curl was not sensitive. The correlation between them was greatly improved when the sea ice declined. The relationship between the relative variation rate ofand the wind stress curl is expressed as following (Zhao., 2018):

whereis sea ice density;is ice thickness;is the Coriolis parameter;is the two-dimensional internal ice stress;τandτare the wind and water stresses acting on the upper and bottom surfaces of sea ice;is the area to the north of 85˚N. Wind stress is usually calculated by using the following empirical relationship:

whereρis air density;Cis wind stress drag coefficient; andis wind speed vector. In Eq. (3) the first term on the right side of the equation is the sea ice internal stress, and the third term is the effect of the seawater drag curl on sea ice, both of which are responses to wind stress. The remaining items indicate that the relative variation rate ofshould be well correlated with the spatial average wind stress curl (AWSC). Here, the daily AWSC at any point is calculated according to the following formula:
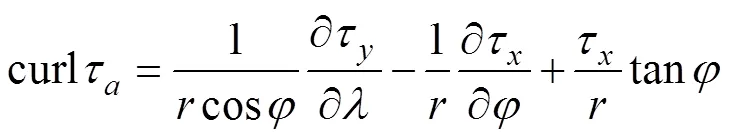
whereis radium of the earth;τandτare the latitudinal and longitudinal components of the wind stress;is the longitude andis the latitude. Firstly the wind stress curls were averaged over the central Arctic. Then the correlation coefficients between the relative rate of variation ofand the wind stress curl were obtained as shown in Fig.7.
Four periods with higher correlation coefficient between the relative rate of variation ofand the AWSC by the significance test (0.01 level) were 2010 (−0.51), 2011 (−0.44), 2013 (−0.38), and 2016 (−0.41) (Fig.7). In 2010, the correlation coefficient was −0.51, much higher than the 99.9% confidence level, which was the same as the conclusions in Zhao. (2018). ASIC responded well to each event with high averaged wind stress curl: when the AWSC was positive, the SIC decreased. It indicated that the wind stress curl was one of the most important factors in producing the low SIC in central Arctic. Although the relative rate of variation ofcorrelated well with AWSC, the response ofto wind forcing was related to the SIC. As seen in Fig.1, the SIC in the central Arctic had a low value when a high correlation coefficient occurred. The low SIC helped to enhance the influence of wind stress curl on SICs. After the end of September, as sea ice gradually increased, the response of SIC on wind stress curl began to weaken.

Fig.7 Influence of wind stress curl on SIC in 2010–2017. The green bars present the time series of negative averaged wind stress curl (AWSC) in the areas north of 85˚N and polyline is the relative variation rate of ASIC.
Fig.8 shows the average AWSCs in August of the year from 2010 to 2017. When the wind stress curl was small or negative (2011, 2012, 2014, 2015), the SIC in the central Arctic was very high (Fig.1). Whereas the years in which the wind stress curl was positive corresponded to the period with low SICs in the central Arctic. Among them, the wind stress had the strongest positive curl in 2016, corresponding to the lowest SIC. The wind stress curls in 2010 and 2013 were also positive, which also led to the reduction of SICs. The results indicated that wind stress curl was the main driving factor in the reduction of SICs in the central Arctic. However, there was enhanced positive wind stress curl in 2017, but the concentration of sea ice in the central Arctic was very high (Fig.1), showing that the high SIC did not respond well to wind forcing. Therefore, wind stress curls act on the SIC in the central Arctic only when the SIC is low.
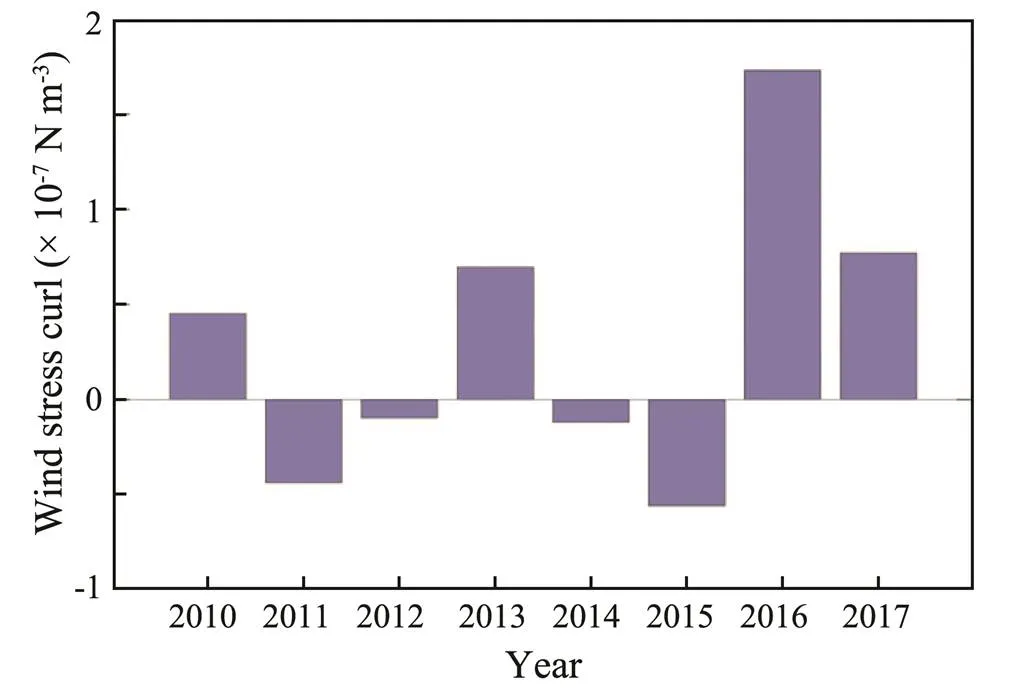
Fig.8 Averaged wind stress curls (AWSC) in August each year.
6 Conclusions
In 2010, a lowest SIC ever was reported in central Arctic by Zhao. (2018). In this paper, using the same method, the changing of SICs in the central Arctic from 2010 to 2017 was investigated by using AMSR-E/AMSR- 2 SIC products.
In 2010, the minimum SIC in the central Arctic was 0.78, which was never reported before. In our study, the low SIC event in 2010 was reconfirmed, and a new mi- nimum in 2016 was also found. The average SIC in the central Arctic in 2016 was about 0.70, much lower than that in 2010. A large area of sea ice in the sector 150˚E–180˚ in 2010 disappeared in 2016, which was the main difference to produce the new minimum. Also, the ice edge in 2016 retreated into the 85˚N circle, whereas in 2010 it was far from the central Arctic. They are the two possible causes for the new minimum of SIC.
The low sea ice concentration in the central Arctic also occurred in 2011 (0.81), 2013 (0.86), and 2016 (0.70). Among them, the SIC in 2016 was significantly lower than that in 2010. For mutual validation, three different algorithms were used to calculate the dailyand all of them supported the conclusion that the historic low SIC in the central Arctic in 2010 had been broken by that in 2016. This phenomenon reminds us that the change of sea ice in the central Arctic is very obvious in recent years and deserves our continued attention.
In 2010 and 2016, there were excellent correlations between the wind stress curl and the relative rate of variation of. The correlation coefficients were −0.51 and −0.41, respectively, indicating that the wind stress curl drove the sea ice movement. The divergence of sea ice caused by positive wind stress curl directly led to lower SIC when sea ice was rare. However, in the situation with a large amount of sea ices, the response of SIC to wind stress was poor. In 2013 and 2017, the wind stress curl was also positively large, but there was no extremely low SIC in the central area of the Arctic because of large sea ice amount. Based on our results, however, both a long- lasting positive wind stress curl and low SIC favor the occurrence of the extremely low SIC event, which might occur again when such a same condition reappears. So, further investigation is necessary to reveal the climate significance of this phenomenon, and its works in the system of ocean-ice-atmosphere coupling.
Acknowledgements
This study was funded by the National Natural Science Foundation of China (No. 41976022) and the Global Change Research Program of China (No. 2015CB953900).
Comiso, J. C., Cavalieri, D. J., and Markus, T., 2003. Sea ice concentration, ice temperature, and snow depth using AMSR- E data., 41 (2): 243-252, DOI: 10.1109/TGRS.2002.808317.
Comiso, J. C., Cavalieri, D. J., Parkinson, C. L., and Gloersen, P., 1997. Passive microwave algorithms for sea ice concentration: A comparison of two techniques., 60 (3): 357-384, DOI: 10.1016/S0034-4257(96)002 20-9.
Cui, H. Y., Qiao, F. L., Qi, S., Song, Y. J., and Jiang, C. F., 2015. Causes for different spatial distributions of minimum Arctic sea ice extent in 2007 and 2012., 34 (9): 94-101, DOI: 10.1007/s13131-015-0676-x.
Intergovernmental Panel on Climate Change (IPCC), 2014.. Cambridge University Press, Cambridge, 953-1028, DOI: 10.101 7/CBO9781107415324.023.
Kay, J. E., Holland, M. M., and Jahn, A., 2011. Interannual to multi-decadalArcticseaiceextenttrendsinawarmingworld., 38: L15708, DOI: 10.1029/2011GL048008.
Kumar, A., Perlwitz, J., Eischeid, J., Quan, X., Xu, T., Zhang, T., Hoerling, M., Jha, B., and Wang, W., 2010. Contribution of sea ice loss to Arctic amplification., 37: L21701, DOI: 10.1029/2010GL045022.
Lindsay, R. W., and Zhang, J., 2005. The thinning of Arctic sea ice, 1988–2003: Have we passed a tipping point?, 18 (22): 4879-4894, DOI: 10.1175/JCLI3587.1.
Markus, T., and Cavalieri, D. J., 2000. An enhancement of the NASA team sea ice algorithm., 38 (3): 1387-1398, DOI: 10.11 09/36.843033.
Maslanik, J., Drobot, S., Fowler, C., Emery, W., and Barry, R., 2007. On the Arctic climate paradox and the continuing role of atmospheric circulation in affecting sea ice conditions., 34: L03711, DOI: 10.1029/2006G L028269.
Overland, J. E., and Wang, M. Y., 2007. Future regional Arctic sea ice declines., 34: L17705, DOI: 10.1029/2007GL030808.
Overland, J. E., and Wang, M. Y., 2013. When will the summer Arctic be nearly sea ice free?, 40: 2097-2101, DOI: 10.1002/grl.50316.
Parkinson, C. L., Cavalieri, D. J., Gloersen, P., Zwally, H. J., and Comiso, J. C., 1999. Arctic sea ice extents, areas, and trends, 1978–1996., 104 (C9): 20837-20856, DOI: 10.1029/1999JC900082.
Perovich, D. K., Richter-Menge, J. A., Jones, K. F., and Light, B., 2008. Sunlight, water, and ice: Extreme Arctic sea ice melt during the summer of 2007., 35: L11501, DOI: 10.1029/2008GL034007.
Raddatz, R. L., Galley, R. J., Candlish, L. M., Asplin, M. G., and Barber, D. G., 2013. Integral profile estimates of latent heat flux under clear skies at an unconsolidated sea-ice surface.–, 51 (3): 239-248, DOI: 10.1080/070559 00.2013.785383.
Rothrock, D. A., Percival, D. B., and Wensnahan, M., 2008. The decline in arctic sea ice thickness: Separating the spatial, annual, and interannual variability in a quarter century of submarine data., 113: C05003, DOI: 10.1029/2007JC004252.
Sepp, M., and Jaagus, J., 2011. Changes in the activity and tracksof Arctic cyclones., 105 (3-4): 577-595, DOI: 10.1007/s10584-010-9893-7.
Spreen, G., Kaleschke, L., and Heygster, G., 2008. Sea ice remote sensing using AMSR-E 89-GHz channels., 113: C02S03, DOI: 10.1029/2005JC0 03384.
Tietsche, S., Notz, D., Jungclaus, J. H., and Marotzke, J., 2011. Recovery mechanisms of Arctic summer sea ice.,38: L02707, DOI: 10.1029/2010GL045698.
Tucker III, W. B., Weatherly, J. W., Eppler, D. T., Farmer, L. D., and Bentley, D. L., 2001. Evidence for rapid thinning of sea ice in the western Arctic Ocean at the end of the 1980s., 28 (14): 2851-2854, DOI: 10.1029 /2001GL012967.
Vermaire, J. C., Pisaric, M. F. J., Thienpont, J. R., Courtney Mustaphi, C. J., Kokelj, S. V., and Smol, J. P., 2013. Arctic climate warming and sea ice declines lead to increased storm surge activity., 40: 1386-1390, DOI: 10.1002/grl.50191.
Wu, B. Y., Walsh, J., Liu, J. P., and Zhang, X. D., 2014. Dominant patterns of winter Arctic surface wind variability., 25 (4): 246-260, DOI: 10.13679/j. advps.2014.4.00246.
Zhang, S. G., Zhao, J. P., Frey, K., and Su, J., 2013. Dual-polarized ratio algorithm for retrieving Arctic sea ice concentration from passive microwave brightness temperature., 69 (2): 215-227, DOI: 10.1007/s10872-012- 0167-z.
Zhang, X. D., Walsh, J. E., Zhang, J., Bhatt, U. S., and Ikeda, M., 2004. Climatology and interannual variability of Arctic cyclone activity: 1948–2002., 17 (12): 2300- 2317, DOI: 10.1175/1520-0442(2004)017<2300:CAIVOA>2. 0.CO;2.
Zhao, J. P., Barber, D., Zhang, S. G., Yang, Q. H., Wang, X. Y., and Xie, H. J., 2018. Record low sea ice concentration in the central Arctic during summer 2010., 35 (1): 106-115, DOI: 10.1007/s00376-017-7066-6.
. E-mail: jpzhao@ouc.edu.cn
March 6, 2019;
April 1, 2019;
May 20, 2019
(Edited by Chen Wenwen)
 Journal of Ocean University of China2020年3期
- Journal of Ocean University of China的其它文章
- Estimation of the Reflection of Internal Tides on a Slope
- Investigation of the Heat Budget of the Tropical Indian Ocean During Indian Ocean Dipole Events Occurring After ENSO
- Image Dehazing by Incorporating Markov Random Field with Dark Channel Prior
- Biochemical Factors Affecting the Quality of Products and the Technology of Processing Deep-Sea Fish,the Giant Grenadier Albatrossia pectoralis
- Propulsion Performance of Spanwise Flexible Wing Using Unsteady Panel Method
- Study on Wave Added Resistance of a Deep-V Hybrid Monohull Based on Panel Method