Effect of pH, Temperature, and CO2 Concentration on Growth and Lipid Accumulation of Nannochloropsis sp. MASCC 11
PENG Xiaoling, MENG Fanping, WANG Yuejie, YI Xiaoyan, and CUI Hongwu
Effect of pH, Temperature, and CO2Concentration on Growth and Lipid Accumulation ofsp. MASCC 11
PENG Xiaoling, MENG Fanping*, WANG Yuejie, YI Xiaoyan, and CUI Hongwu
Key Laboratory of Marine Environmental Science and Ecology, Ministry of Education, Ocean University of China,Qingdao 266100, China
This study determined growth and lipid accumulation insp. MASCC 11 cultivated at different pH, temperatures, and CO2concentrations in 10-day period. The suitability for biodiesel production was also evaluated based on the fatty acid profiles of microalgae lipid.sp. MASCC 11 showed an excellent tolerance to acidic pH (as low as 4.0), high temperatures (at least 40℃), and high CO2concentrations (5%-15%), which are major stressed conditions in flue gas. The highest algal biomass was acquired at pH of 9.0 (0.44gL–1), a temperature of 35℃ (0.63gL–1), and a CO2concentration of 5% (2.27gL–1). Maximum lipid production was obtained at pH of 6.0 (108.2mgL–1), a temperature of 35℃ (134.6mgL–1), and a CO2concentration of 5% (782.7mgL–1). Synthesis of polyunsaturated fatty acids (PUFAs) in biomass was stimulated under high CO2concentrations, remaining above 80% of total fatty acids, mainly composed of C16:3, C18:2, and C18:3. This led to the algae-based biodiesel having a lower oxidation stability, better cold flow properties, and other parameters such as its kinematic viscosity, cetane number, and specific gravity complied with ASTM or EN 14214 biodiesel specifications. Therefore, the improvement of oxidative stability needs to be considered beforesp. MASCC 11 lipid can be used for biodiesel production, even if this species can grow well under stressful conditions.
sp. MASCC 11; tolerance; high CO2; biodiesel
1 Introduction
In recent decades, energy crisis and global warming induced by CO2emissions are worldwide environmental problems (Kan., 2019). Biodiesel is a compatible alternative to fossil fuel, which is biodegradable, renewable, and clean-burning (Mwangi., 2015). Microalgae are among the most promising feedstock for biodiesel production (Chisti, 2007). They can assimilate and convert CO2from flue gas into biomass containing high amounts of lipids for subsequent biodiesel production (Parupudi., 2016); however, several challenges need to be overcome before microalgae can be successfully used for CO2biofixation and biodiesel production. A typical power plant flue contains 5%-15% CO2(Vuppaladadiyam., 2018), accompanied by toxic associated gases such as SO2(300 to 500ppm), as well as high temperatures (more than 150℃) (Yoshihara., 1996; Kao., 2014). A continuous ventilation of flue gas will result in the decrease of pH in the liquid medium, which has an inhibitory effect on autotrophic algal growth (Ronda., 2014). These stresses are difficult to control when microalgae are cultivated in such a system. Therefore, the screening to find a suitable microalgae strain with high tolerance to the low pH, high temperature, and high CO2regime should be the premise for the CO2fixation from flue gas.
Microalgae of the genushave gradually become a research focus for those exploring their po- tential for CO2biofixation and biofuel production due to their relatively high photosynthetic efficiency, fast growth rates, and high lipid contents (Huang, 2013; Bartley., 2014). So far, five differentspecies (,,,, and), recognized in saline habitats, are proposed to produce biodiesel (Chiu., 2009; Cai., 2013; Ma., 2014; Taleb., 2015; Cancela., 2019; Moraesa., 2019). However, the literature on freshwaterspecies is limited. Moreover, the lipid accumulated inhas high content of polyunsaturated fatty acids (PUFA) (Krienitz., 2006), which could be used in biotechnology and aquaculture.
In this context, the objective of this study was to evaluate the ability ofsp. MASCC 11, a unicellular freshwater alga, to cope with different levels of CO2, pH values, and temperatures, respectively, and algal growth and lipid accumulation were measured in this study. In order to determine the suitability of biomass formed under different CO2concentrations for biodiesel production, fatty acid composition of microalgae was also studied.
2 Methods
2.1 Microalgal Strain, Growth Medium, and Pre-Cultivation
sp. MASCC 11 was obtained from the Institute of Oceanology, Chinese Academy of Sciences, Qingdao, China, and pre-cultured in 500mL Erlenmeyer flasks at 25℃ with continuous illumination. Light intensity was set at 60μmolphotonsm−2s−1and was measured by a portable light quantum meter (3415F type, pulse photoelectric sensor; Spectrum Technologies, Inc., USA). The flasks were manually shaken three times a day. The BG11 medium (Stanier., 1971) was used for the cultivation. Algal cells in the exponential growth phase were used for subsequent experiments.
2.2 Microalgal Tolerance Experiments
2.2.1 Low pH
Erlenmeyer flasks (500mL) containing 300mL BG11 medium were employed to study the effect of pH on growth of the microalga. The initial cell density was 1.5× 10⁶cellsmL–1. The pH values of the media were adjusted to 3.0, 3.5, 4.0, and 6.0 by adding 0.1molL–1H2SO4after inoculation, then transferred they to the flasks. Then the algal cultures were incubated in an illuminated incubator with orbital shakers (PGX-250D-LED, Jiangsu Allison Instrument Manufacturing Co., Ltd., China) at 150rmin−1. The other conditions used for culture were: continuous- day (24-h light/0-h dark) illumination (120μmol photons m−2s−1) and a temperature of 25℃. During cultivation, the pH was controlled by a pH Stat System (Schott, Mainz, Germany) with an H2SO4solution supplementary to the culture to maintain a constant pH. BG11 medium without H2SO4addition served as the control (Initial pH, 9.0). All experiments were carried out in triplicate and ran for 10d. At the end of cultivation, samples collected from each culture were used to determine the cell density, biomass (dry weight), and total lipid content. The specific growth rate and total lipid productivity were also calculated.
2.2.2 Temperature
To study the effect of temperature, experiments were performed at 20, 25, 30, 35, and 40℃ in illuminated incubators. The pH values of algal culture were maintained at 9.0. The other conditions and growth/lipid parameters were determined as outlined in Section 2.2.1.
2.2.3 CO2concentration
Microalgae were inoculated to a bubble bioreactor comprising a 500mL Erlenmeyer flask containing 300 mL BG11 medium (Initial pH, 9.0). The filtered air, supplemented with CO2, was bubbled into the culture medium through a glass tube (2mmi.d.) at a fixed aeration rate of 0.1 vvm (.., air volume/medium volume/min). CO2concentrations in the bubbled gas stream were regulated to 0.04% (air without excess CO2), 5%, 10%, and 15% for different treatments. The temperature, inoculation density, duration and other conditions were as described in Section 2.2.1. Determination of sample pH was undertaken every day. At the end of cultivation, the microalgae were harvested and their biomasses, lipid contents, as well as total fatty acid concentrations and compositions were analyzed.
2.3 Analyses
2.3.1 Biomass
Dry weight was measured according to the method described by Ho. (2013). Microalgal culture (10mL) was filtered through a 0.45μm cellulose acetate membrane filter. Each pre-weighed loaded filter was then dried at 60℃ until a constant mass was reached. The microalgae biomass(gL−1) was calculated based on the following equation:
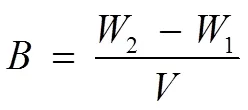
where1is the mass of the blank filter (g),2the mass of the filter loaded with microalgal cells (g), andthe volume of the culture (0.01L).
2.3.2 Cell density and specific growth rate
Cell densities were measured by counting the number of cells using a hemocytometer (Marienfeld, Germany). The specific growth rate(d–1) was calculated based on the following equation:
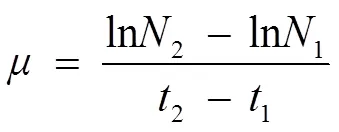
where2and1are the cell densities (cellsmL−1) at times2and1in the exponential growth phase, respectively.
2.3.3 Lipid content and lipid production ofsp.
Cultures were centrifuged at 5000rmin−1for 10min at 4℃. The resulting microalgal pellet was washed twice with distilled water to remove salts, and freeze dried at −50℃. Total lipid content was measured according to a modified method by Bligh and Dyer (1957). Briefly, 100 mg of freeze-dried microalgae were extracted with a 7.6 mL mixture of chloroform, methanol, and water (2.5/5/2, v/v) for 24 h at room temperature, followed by sonication (700W, 5s working, 5s rest) for 2min. After adding 1mL of chloroform and 1mL of water, the mixture was centrifuged at 5000rmin−1for 10min to form three layers. The organic phase was collected into a pre-weighed glass tube and evaporated to dryness under nitrogen gas flow for weighing. The total lipid content(%) was calculated according to the following equation:
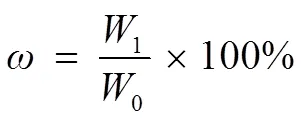
where1and0are the lipid masses (g) and the dry cell masses (g), respectively.
The lipid production(gL−1) of the microalgae was deduced from the following equation:

whereis the biomass (gL−1), andis the total lipid content (%).
2.3.4 Fatty acid analysis
The fatty acid (FAs) composition of the lipids was analyzed using gas chromatography in tandem with mass spectrometry (GC–MS) (Kebelmann., 2013). Briefly, 20-50mg freeze-dried microalgae samples were added to 1mL saturated KOH-CH3OH solution and allowed to stand for 1 h at 80℃ in a water bath. Then, 3mL distilled water and 2mL hexane were added. After being vortexed, the upper phase containing fatty acids were analysed using a gas chromatograph equipped with a flame ionisation detector (Perkin Elmer, Germany) and a DB-5MS chromatographic column (50m×250μm×0.25μm). The injection temperature was 300℃, the initial column temperature was 150℃, and the temperature was increased to 300℃ using a temperature gradient of 10℃min−1, where- upon it was held for 5min. All the analyses were carried out in duplicate and average values reported.
2.4 Calculation of Parameters Related to Biodiesel Fuel Properties
Four parameters related to biodiesel fuel properties were calculated based on fatty acid profiles insp. MASCC 11 as described by the following equations (Hoekman., 2012):


where,,, andare average degree of unsaturation, kinematic viscosity, specific gravity, and cetane number, respectively;is the number of C=C bonds; andiis the mass fraction of each FA constituent.
2.5 Statistical Analysis
The results are expressed as mean ± standard deviation (SD) of three replicates except as specified above. Statistical analysis of data was performed by using SPSS 19.0 for Windows. One-way analysis of variance (ANOVA), followed by Tukey-Kramer multiple comparison, was used to analyze the differences among the treatments. A value of<0.05 was considered statistically significant.
3 Results
3.1 Effect of pH on Growth and Lipid Accumulation
During the cultivation period of 10 d,sp. MASCC 11 presented measurable specific growth rates at pH values of 4.0, 6.0, and 9.0 (control), but no growth was observed at pH 3.0 and 3.5 (Fig.1). The maximum specific growth rate(0.27d−1) and biomass(0.44gL−1) were observed at pH 9.0. Bothandat acidic pH levels were lower than those in control, accounting for 89% and 61% at pH 6.0, and 70% and 23% at pH 4.0, respectively. Unlike algal growth, the highestvalue (36.8%) was observed at pH 6.0, resulting in a maximum(108.2mgL−1) (Table 1). The lowestvalue obtained was 20.6% when algae were grown at pH 9.0.

Fig.1 Growth curves of Nannochloropsis sp. MASCC 11 under different pH values.
3.2 Effect of Temperature on Growth and Lipid Accumulation
As shown in Fig.2, the optimum temperature for proper growth ofsp. MASCC 11 was 35℃, with avalue of 0.30d−1and avalue of 0.63gL−1, followed by 40℃ (= 0.28d−1and= 0.55gL−1) (Table 2). As the temperature decreased below 35℃, bothandalso decreased. While no significant changes inwere observed within the temperature range of 25 to 40℃ (> 0.05), and the highest(28.34%) was found at 20℃, showing a significant difference from those at other temperatures (<0.05). Higherobtained at 35℃ (134.55 mgL−1), 40℃ (123.26mgL−1), and 30℃ (118.42mgL–1) were 1.43, 1.31, and 1.26 times as high as that at 20℃, respectively (Table 2).

Table 1 Variation of specific growth rates (μ), biomasses (B), lipid content (ω) and total lipid production (LP) of Nannochloropsis sp. MASCC 11 under different pH values (n = 3). The microalgae did not survive at pH 3.0 and 3.5.
Notes: Values marked with different letters are significantly different (<0.05).

Table 2 Specific growth rates (μ), biomass (B), lipid content (ω) and total lipid production (LP) of Nannochloropsis sp. MASCC 11 after cultivation at different temperatures (n=3)
Note: Values within a column that are marked with different letters are significantly different (<0.05).
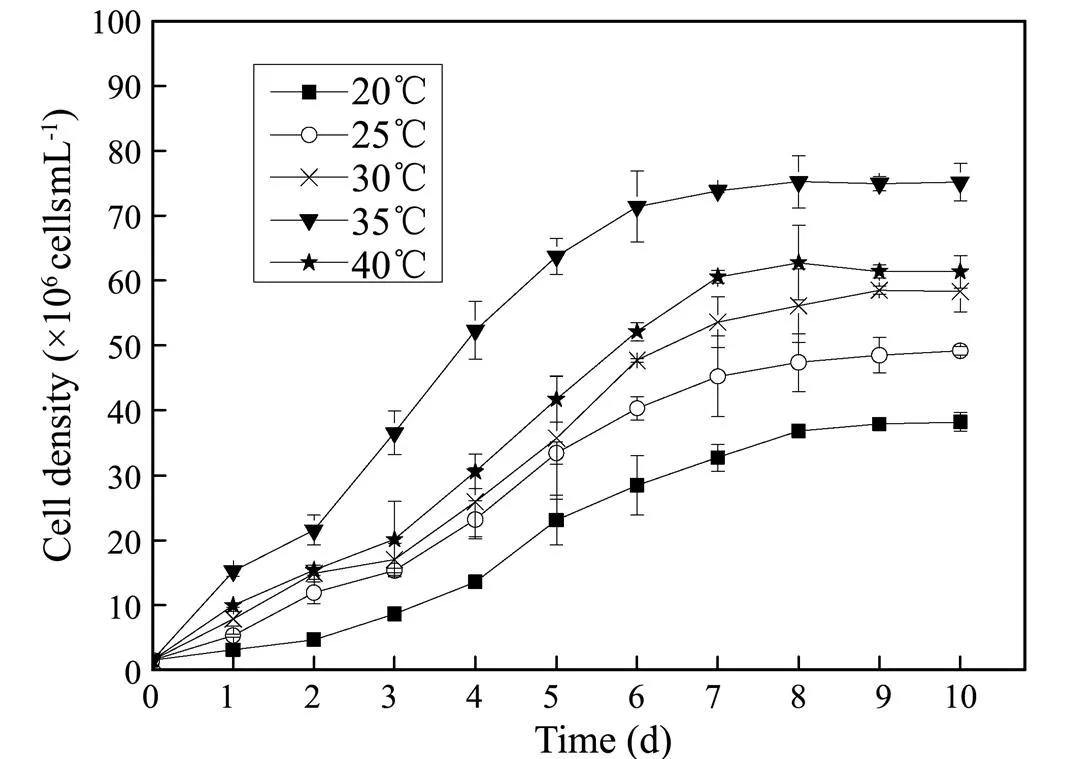
Fig.2 Growth curves of Nannochloropsis sp. MASCC 11 under different temperatures.
3.3 Effect of CO2 Concentration on the Growth, Li-pid Accumulation, and Fatty Acid Composition
Fig.3 and Table 3 show the effects of CO2concentration on the growth and lipid accumulation insp. MASCC 11 cells. The highest values ofandwere obtained at 5% CO2(0.42d−1and 2.27gL−1), followed by those at 10% CO2(0.35d−1and 1.14gL−1). When aerated with 15% CO2, the microalgae presented lower values ofand(0.29d−1and 0.54gL−1), but without obvious inhibition of growth compared to those obtained in the control group (, aeration with air) (> 0.05). Similarly, higher lipid contents (38.60% and 34.47 %) were also observed at 10% and 5% CO2, respectively, compared to those at 15% CO2(20.90%) and in the control group (24.19%).reached its highest value of 782.7mgL−1at 5% CO2, followed by that at 10% CO2(437.4mgL−1), with much lowerat 0.04% and 15% CO2.
During the cultivation, the pH changes greatly with the increase of CO2concentration. When aerated with ambient air (the control), the pH of the culture dropped to 8.33 at the first day after cultivation, followed by a slow increase during the exponential growth phase. The final pH remained constant with minor variations between 9.50 and 9.75. However, when cultures were aerated with high concentrations of CO2(5%-15%), the pH values fell sharply below 7.0 or even 6.0 in the initial stage of cultivation and then increased rapidly due to the exponential cell growth. Finally, they stabilized about 8.43, 8.11 and 7.51 respectively (Fig.4).
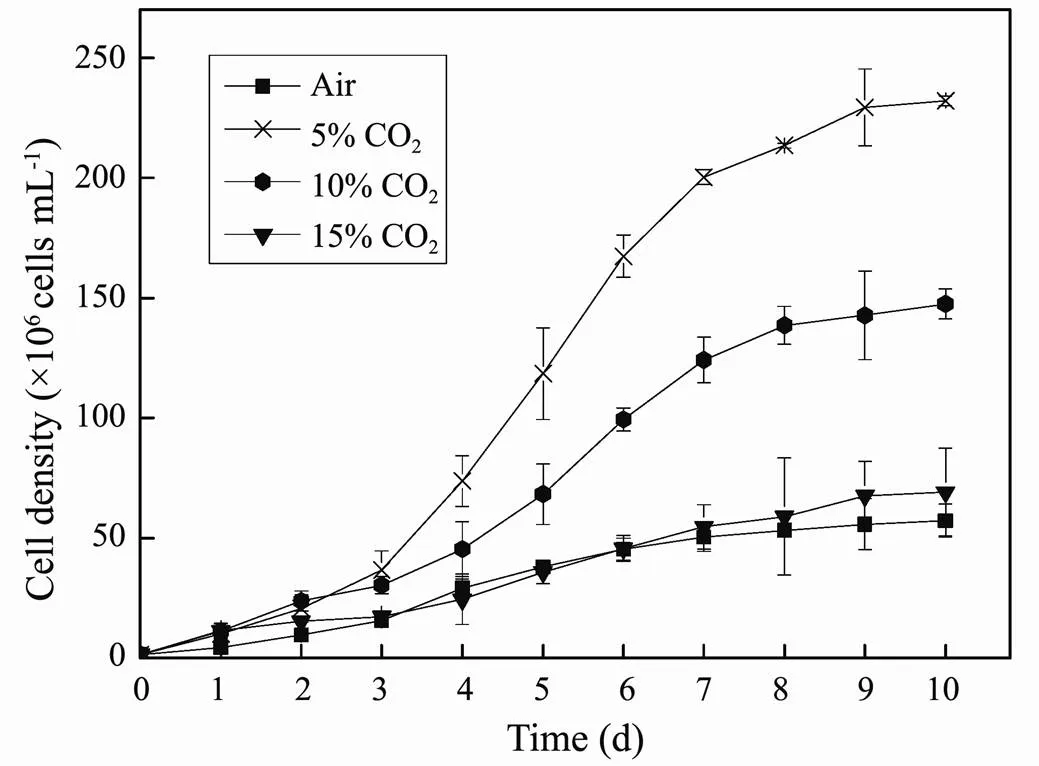
Fig.3 Growth curves of Nannochloropsis sp. MASCC 11 under different concentrations of CO2.

Table 3 Specific growth rates (μ), biomasses (B), lipid content (ω) and total lipid production (LP) of Nannochloropsis sp. MASCC 11 grown under different concentrations of CO2 (n = 3)
Note: Values within a column marked with different letters are significantly different (<0.05).
During the cultivation, the pH changes greatly with the increase of CO2concentration. When aerated with ambient air (the control), the pH of the culture dropped to 8.33 at the first day after cultivation, followed by a slow increase during the exponential growth phase. The final pH remained constant with minor variations between 9.50 and 9.75. However, when cultures were aerated with high concentrations of CO2(5%-15%), the pH values fell sharply below 7.0 or even 6.0 in the initial stage of cultivation and then increased rapidly due to the exponential cell growth. Finally, they stabilized about 8.43, 8.11 and 7.51 respectively (Fig.4).
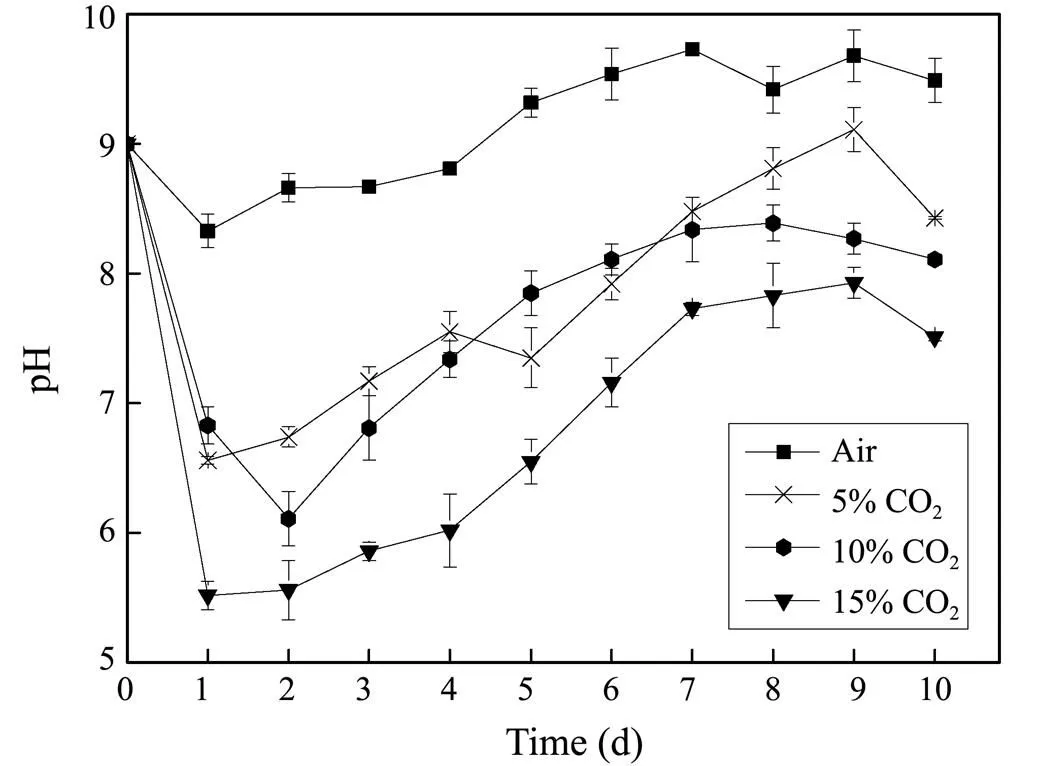
Fig.4 Time course of pH values in cultivation of Nannochloropsis sp. MASCC 11 under different concentrations of CO2.
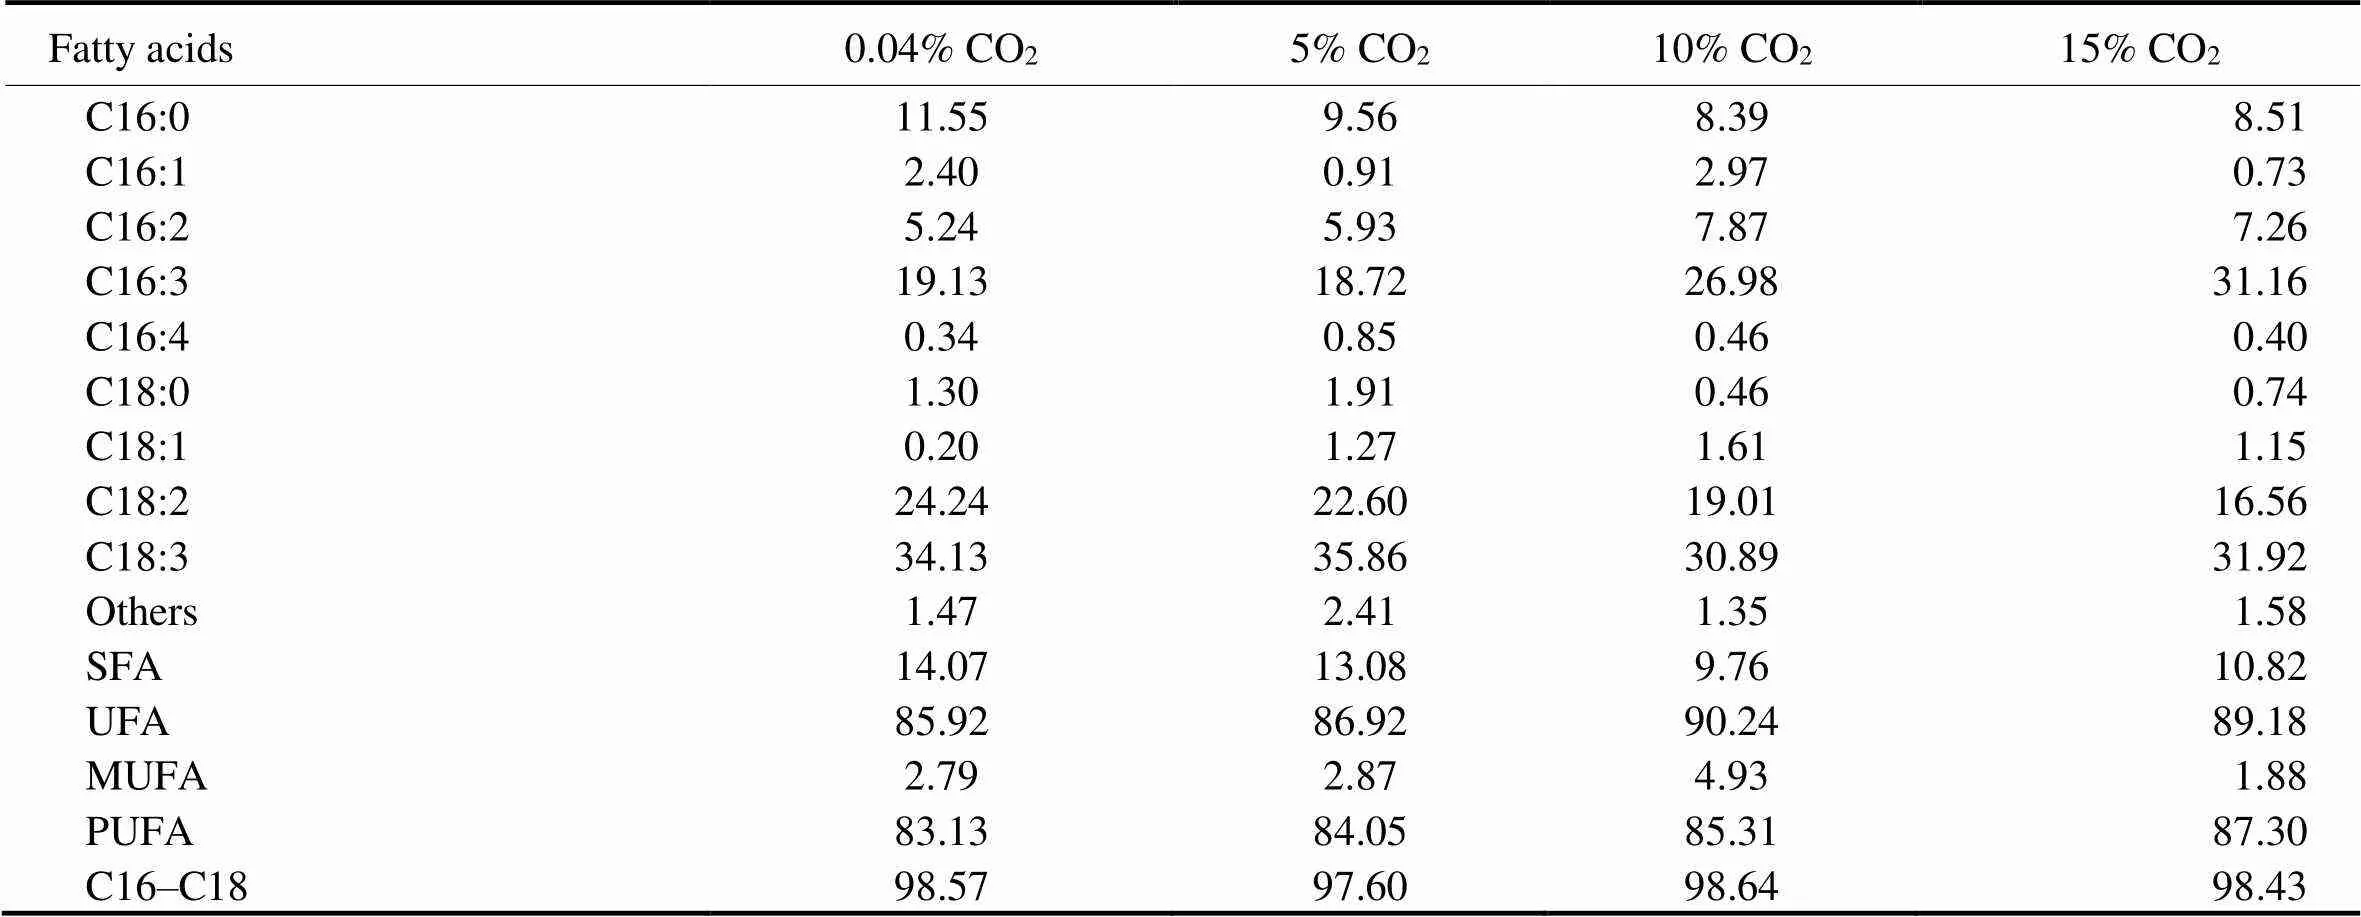
Table 4 Fatty acid profiles of Nannochloropsis sp. MASCC 11 grown under different concentrations of CO2 (Data presented as percentage of total fatty acids)
Notes: SFA, saturated fatty acid; UFA, unsaturated fatty acids; MUFA, monounsaturated fatty acid; PUFA, polyunsaturated fatty acid.
At each concentration of CO2, the majority of the FAs were palmitic acid (C16:0), hexadecatrienoic acid (C16:3), linoleic acid (C18:2), and linolenic acid (C18:3) (Table 4). The sum of them accounted for 89.1% (air), 86.7% (5% CO2), 85.3% (10% CO2), and 88.2% (15% CO2) of the total fatty acid. C16 and C18 fatty acids comprised 97.6 % to 98.6% of the total lipids. Increasing CO2concentration led to a general downtrend in the levels of saturated fatty acids (SFAs,, C16:0 and C18:0), and a concomitant increase in the levels of unsaturated fatty acids (UFAs), mainly due to the increase of polyunsaturated fatty acid (PUFA) contents. In general, a high CO2concentration enhanced the synthesis of C16:3 and C16:2 FAs, while C18:2 and C18:3 FAs showed the opposite tendency.
4 Discussion
4.1 Tolerance of Nannochloropsis sp. MASCC 11 to Low pH
It is estimated that about 220ppm of SOXis produced in a typical power plant flue gas (Kumar., 2011). Most microalgae are unable to grow at all when exposed to SO2at a concentration exceeding 100 ppm (Hauck., 1996). And the major toxicity of SO2to microalgae seems to result from the enhanced acidic conditions (Matsumoto., 1997). Matsumoto. (1997) reported that pH decreased to less than 4.0 after 20h of aeration with 400ppm of SO2, however, when the pH was maintained at 8.0 by adding NaOH solution, no significant reduction in algal growth rate was observed. A typical optimum pH for most microalgal species is approximately 8.2 to 8.7 (Havlik., 2013). Under low pH conditions, the increasing chemical gradient between cytoplasm and medium leads to a higher H+influx to the cells, requiring active transport of H+to maintain an internal pH suitable for normal metabolic processes (Santikul, 2000). In the present study,sp. MASCC 11 grew best at pH 9.0 (Table 1), an optimum value similar to(8–9, Bartley., 2014),sp. (8.5, Khatoon., 2014),()(8.2–8.7, Kim., 2007), and(8–9, Shah., 2014). It is noteworthy thatsp. MASCC 11 tolerated pH as low as 4.0, which strongly inhibited growth in somespecies such as(Bartley., 2014).
Although pH 9.0 favored biomass formation insp. MASCC 11, it did not result in the highest lipid content. Relatively low pH,., 6.0, was ideal with regard to maximizing both lipid content and lipid production (Table 1). Low lipid production at pH 4.0 was due to the poor growth, not the low lipid content, which is equal to the control (pH 9.0). Shah. (2014) also observed a decreasing trend in algal lipid accumulation with decreased pH in. Acetyl-CoA carboxylase, a key enzyme in fatty acid synthesis, may be inhibited in more acidic media (Sasaki., 1997). In contrast, Bartley. (2014) found no significant effect of pH change (over 7 to 9) on lipid accumulation in. Therefore, the relationship between lipid accumulation and pH value is species-specific.
4.2 Tolerance of Nannochloropsis sp. MASCC 11 to High Temperature
Temperature is one of the key factors affecting microalgal growth, because photosynthesis in algal cells consists of a series of temperature-dependent reactions (Zhao and Su, 2014). Low temperatures reduce the activity of enzymes related to photosynthesis (and other metabolic reactions). Moderate high temperatures could promote the rate of respiratory action, but extremely high temperatures will restrain metabolic activity and respiration in microalgae (Breuer., 2013). Generally, temperatures greater than 35℃ are too harsh for many microalgal species (Zhao and Su, 2014). If microalgae are used to eliminate CO2from flue gas, they must exhibit a certain tolerance to high temperatures to reduce the cost of cooling production systems (Wang., 2008).sp. MASCC 11 was high-temperature tolerant, with rapid growth (= 0.28 to 0.30d−1,= 0.51 to 0.63g L−1) within the range 30 to 40℃. This thermotolerance conferred potential for CO2removal from power station flue gases. Another freshwaterstrain,Krienitz (SAG 18.99), showed the highest dry-mass value at 22℃ (1.03±0.04gL−1) when cultured in OHM culture medium adjusted to an N concentration of 10mmolL−1KNO3(Freire., 2016).has an optimal temperature of 20℃, with avalue of 0.13d−1, more than double the value at 15 and 25℃ (Converti., 2009).grows between 17 to 32℃, with an optimum of 28℃ (Boussiba., 1987). 30℃ is very close to the limit of survivability ofstrain B-3, and the maximum biomass productivity (0.429gL−1d−1) was achieved at 25℃, with an average irradiance of 170μmols−1m−1and a dilution rate of 0.3d−1(Camacho-Rodríguez., 2015). Clearly, compared with otherstrains,sp. MASCC 11 possess higher thermotolerance, thus conferring the potential for use in CO2removal from power station flue gases.
Usually, when subjected to stressful conditions such as high irradiance and temperature, microalgae can accumulate lipids (Wijffels and Barbosa, 2010), mainly in the form of triacylglycerols (TAGs), whereas under optimal growth conditions, they produce only small amounts of lipids. Our results showed that a lower temperature,, 20℃, seems to be most favorable to lipid accumulation insp. MASCC 11, on the contrary, lower lipid contents were found in the groups exposed to higher temperatures. This was not consistent with the findings of previous studies. Converti. (2009) found that increasing the cultivation temperature from 20 to 25℃ doubled the lipid content in(from 7.90% to 14.9%), and the largest biomass and lipid content inwere both obtained at 25℃. This can be explained by the fact that thesp. MASCC 11 used in the present study may be a mesophilic species which prefer moderate high temperatures, and lower temperatures, rather than higher temperatures, constitute a stress condition. Based on the data in Table 2, and the cultivation period, the calculated biomass productivity and lipid productivity ofsp. MASCC 11 (63mgL−1d−1and 13.5mgL−1d−1at 35℃; 55mgL−1d−1and 12.3mgL−1d−1at 40℃) could be comparable with those ofsp. SB2 at 35℃ (93mgL−1d−1and 29 mg L−1d−1), whereas the growth of the latter at 40 ℃ was too weak to produce a detectable lipid content (Wu., 2013). Biomass productivity and lipid productivity ofhave not been reported at the similar temperatures, perhaps due to the poor tolerance to high temperatures.
4.3 Tolerance of Nannochloropsis sp. MASCC 11 to High CO2 Concentrations
CO2is an essential carbon source for algal autotrophic growth. Supplementing a microalgae culture with an appropriate level of CO2can promote photosynthetic efficiency by enhancing the CO2concentration around RuBisCO, and then increasing the ratio of the rates of carboxylation to oxygenation and the efficiency of CO2fixation (Long., 2006). However, when the CO2supply is much higher than that with which the microalgal metabolism can cope, the culture pH will decrease, possibly to less than 5.0 at 15% or 30% CO2(Meier., 2015), and the acidic pH would produce an adverse effect upon microalgal growth by inhibiting the activity of extracellular enzymes such as carbonic anhydrase (Tang., 2011). Another explanation for the low biomass productivity at higher CO2concentrations is that most of the CO2was consumed for metabolic activity to combat higher CO2stress, and less CO2was used in biomass syn- thesis accordingly (Chiu., 2009). Therefore, highly CO2-tolerant species would be necessary for efficient carbon capture from flue gases. According to this study, the use of high CO2concentrations (from 5% to 15%) led to a short decline of pH in the medium (mainly in the lag phase), but there was a rapid increase in pH levels due to the exponential cell growth (Fig.4). In the groups of 5% and 10% CO2, it only took two days to rise to be higher or close to pH 7.0 which was favorable to the elimination of growth inhibition from acidification, while pH rebounding needed a longer time in the 15% CO2group. Nevertheless,sp. MASCC 11 could grow well within a CO2range of 5% to 15% without any inhibition compared to the control group. The highest biomass productivity of 0.23gL−1d−1was obtained at a 5% CO2concentration. It has been reported thatgrew best at 2% CO2and was completely inhibited at CO2concentrations of 5%, 10%, and 15% (Chiu., 2009). In another study with(NAO), the biomass growth was completely inhibited by bubbling the medium with 10% CO2, accompanied by a pH decrease to approximately 5.0 (Hsueh., 2009). Growth inhibition was observed at ≥6.5% CO2in(Arudchelvam and Nirmalakhandan, 2012), and ≥9% CO2in(Meier., 2015). The effects of high CO2concentrations on the growth of the genusare strain-dependent: thesp. MASCC 11, used in this study, was more tolerant to high CO2concentrations than other strains. Miyachi. (2003) proposed a tolerance classification scheme in which microalgae that can tolerate 2 to 5%, 5 to 20%, and 20 to 100% CO2concentrations are classified as CO2tolerant, highly-CO2to- lerant, and extremely highly-CO2tolerant, respectively. From this point of view,sp. MASCC 11 should be classed as highly-CO2tolerant.
Lipid contents insp. MASCC 11 aerated with 5% and 10% CO2were 1.42 times and 1.60 times as high as that in the control group, respectively (Table 3). This enhancement is consistent with the chlorophyte,sp., which had high growth rate and lipid content at 5% to 10% CO2(Yoo., 2013).NIOCCV, cultivated in seafood processing industry wastewater, showed an increase trend in total lipid content at CO2concentration from 5% to 10% (Jain., 2019). Lipid contents insp. QLZ-3 aerated with 12% CO2were 1.18-fold higher than those of the control (Dong., 2019). Therefore, it is feasible to increase the lipid content in these species by using a high concentration of CO2. However, the lipid contents in other microalgae showed different response patterns to high CO2concentrations. Lv. (2010) propose that the lipid content indecreases when the CO2concentration exceeds 1%. In research by our team, lipid contents inunderwent a slight change (from 17.8% to 23.1%) when exposed to CO2at concentrations of 0.04% to 10%, with a maximum lipid content found at 2.5% CO2(Wang., 2015). Similarly, lipid contents (between 18.1% and 18.7%) ingrown in a column-type photobioreactor did not change significantly with the increase in CO2concentration (from 0.03% to 5 %) (Lam and Lee, 2013). Also, a mere 1% to 6% increase in the lipid contents inandunder high CO2(10% to 15%) was observed (Ho., 2010; Tang., 2011). In the present study, a CO2concentration of 5% produced the best lipid productivity (0.078gL–1d–1) insp. MASCC 11. Compared to other studies on the genusin batch culture, this lipid productivity is superior to those of(NAO) at 5% and 8% CO2(Hsueh., 2009),at 6.5% and 9.5% CO2(Arudchelvam and Nirmalakhandan, 2012), and four strains ofsp. at 5% CO2(Rodolfi., 2009) (Table 5). Even our second-highest value of lipid productivity (0.044gL−1d−1) obtained at 10% CO2was near to or higher than those of manyspecies. The greater tolerance to high CO2concentrations and the higher lipid productivity madesp. MASCC 11 a suitable microalga for CO2mitigation from flue gases containing 5% to 10% CO2while offering efficient lipid production.

Table 5 Biomass productivity and lipid productivity values for some species of genus Nannochloropsis cultured at different CO2 concentrations.
4.4 Fatty Acid Profiles at High CO2 Concentrations and Their Suitability for Biodiesel Applications
In addition to lipid productivity, an appropriate FA composition in the microalgal lipids needs to be considered when evaluating the suitability of microalgae for biodiesel production. C16–C18-enriched fatty acids, including C16:0, C18:0, C18:1, C18:2, and C18:3, are the most suitable feedstocks for biodiesel production (Knothe, 2009). The high proportion of C16–C18 FAs (greater than 97%, Table 4) insp. MASCC 11 can meet this requirement. Different CO2supply could influence intracellular fatty acid composition of microalgae (Wang., 2014; Mudimu., 2015; Dong., 2019). The PUFA content insp. MASCC 11 was greater than 80% in the control group and showed an increasing trend when the microalgae were subjected to increased CO2concentrations, a trend mainly contributed to the increase in the amounts of C16:3 and C16:2. Tang. (2011) also found that high levels of CO2enhanced the accumulation of PUFAs inSJTU-3 andSJTU-2. The increase in PUFA content probably arises because feeding the culture medium with a high concentration of CO2leads to a relative decrease in the O2concentration, thus affecting enzymatic desaturation (Vargas, 1998).
When using microalgal oil as diesel, some issues should be taken into consideration,, oxidation stability and cold flow, as well as,, and. Forsp. MASCC 11 microalgal oil, the presence of large amounts of PUFAs resulted in a higher average degree of unsaturation () ranging from 2.23 at 0.04 % CO2to 2.40 at 15% CO2(Table 6) than those of otherstrains (0.72 to 1.43) as reported elsewhere (Ma., 2014). There are two different effects generated by high levels of unsaturation: lowering of the melting point (MP) to make the biodiesel appear less viscous in cold weather (Isioma., 2013), and increasing the susceptibility of biodiesel to oxidation (Sarin., 2009). In fact, the oxidation stability can be improved by adding synthetic antioxidants such as pyrogallol, propyl gallate, and so on, which have been found to be very effective in biodiesels (Agarwal., 2015). Thevalue is a measure of the flow resistance of a biodiesel. A highmay lead to poor atomisation performance (Alptekin and Canakci, 2008), while a lower viscosity is insufficient to ensure the proper lubrication of the injector pump (Mohammad-Ghasemnejadmaleki., 2014).is an indicator of fuel ignition quality and a highervalue is conducive to decreasing ignition delay and avoiding diesel knock (Mohammad-Ghasemnejadmaleki., 2014). Both parameters should be in accordance with two world- wide standards,, European standard (EN 14214) and American standard (ASTM D6751), however, the latter one is considered to be more adapted to biodiesel from microalgae (ASTM 2015). In this study, the estimated values ofandforsp. MASCC 11 biodiesel are well within the specifications of ASTM standards (ASTM 2015), except for that ofat 15% CO2(Table 6).is a measure of the density of liquid fuels, which has direct effects on the amount of injected fuel, the injection timing, and injection spray pattern (Lee., 2002). Furthermore, high-density fuel always leads to an increase in particulate matter (PM) and NOx emission in diesel engines (Szybist., 2007).limits are not specified in ASTM D6751, but the estimatedvalue forsp. MASCC 11 biodiesel is within the range of EN 14214 specifications (0.86 to 0.90 kgL−1) for biodiesel (B100) and biodiesel blends (Mo- hammad-Ghasemnejadmaleki., 2014).

Table 6 Properties of biodiesel from Nannochloropsis sp. MASCC 11 oil at different CO2 concentrations
5 Conclusions
Compared to otherspecies,sp. MASCC 11, a freshwater species, was highly tolerant to acidic pH (4.0), high temperatures (40 ℃), and high CO2concentrations (15%). Changes in these conditions significantly affected the algal biomass production, with the highest values occurring at a pH of 9.0 (0.44gL−1), a temperature of 35℃ (0.63gL−1), and a CO2concentration of 5% (2.27gL−1). The maximum lipid yields were obtained at a pH of 6.0 (108.21mgL−1), a temperature of 35℃ (134.55mgL−1), and a CO2concentration of 5% (782.7mgL−1). The fatty acid profiles ofsp. MASCC 11 grown at CO2concentrations of between 5% and 10% featured a high degree of unsaturation, mainly due to the presence of large amounts of PUFAs such as C16:3, C18:2, and C18:3, leading to an algae-based biodiesel with a lower oxidation stability and better cold flow properties, and the values of,, andmet ASTM, or EN 14214, biodiesel specifications.
Acknowledgements
This study was supported by the National Key Technology R & D Programme (No. 2011BAD14B04). We gratefully acknowledge all members of the key laboratory who participated in the research. We also thank Dr. Yongfu Li for his valuable assistance with the experiments.
Agarwal, A. K., Khurana, D., and Dhar, A., 2015. Improving oxidation stability of biodiesels derived from Karanja, Neem and Jatropha: Step forward in the direction of commercialization., 107: 646-652.
Alptekin, E., and Canakci, M., 2008. Determination of the density and the viscosities of biodiesel-diesel fuel blends., 33: 2623-2630.
Arudchelvam, Y., and Nirmalakhandan, N., 2012. Energetic optimization of algal lipid production in bubble columns: Part II: Evaluation of CO2enrichment., 46: 765-772.
ASTM D6751-15c, 2015. Standard Specification for Biodiesel Fuel Blend Stock (B100) for Middle Distillate Fuels. West Conshohocken, PA: ASTM International. Available at: www.astm.org
Bartley, M. L., Boeing, W. J., Dungan, B. N., Holguin, F. O., and Schaub, T., 2014. pH effects on growth and lipid accumulation of the biofuel microalgaeand invading organisms., 26: 1431-1437.
Bligh, E. G., and Dyer, W. J., 1957. A rapid method of total lipid extraction and purification., 37: 911-917.
Boussiba, S., Vonshak, A., Cohen, Z., Avissar, Y., and Richmond, A., 1987. Lipid and biomass production by the halotolerant microalga., 12: 37-47.
Breuer, G., Lamers, P. P., Martens, D. E., Draaisma, R. B., and Wijffels, R. H., 2013. Effect of light intensity, pH, and temperature on triacylglycerol (TAG) accumulation induced by nitrogen starvation in., 143: 1-9.
Cai, T., Park, S. Y., Racharaks, R., and Li, Y., 2013. Cultivation ofusing anaerobic digestion effluent as a nutrient source for biofuel production (Article)., 108: 486-492.
Camacho-Rodríguez, J., Cerón-García, M. C., Fernández- Sevilla, J. M., and Molina-Grima, E., 2015. The influence of culture conditions on biomass and high value product generation byin aquaculture., 11: 63-73.
Cancela, A., Prez, L., Febrero, A., Snchez, A., Salgueiro, J. L., and Ortiz, L., 2019. Exploitation ofbiomass for biodiesel and pellet production., 133: 725-730.
Chisti, Y., 2007. Biodiesel from microalgae., 25: 294-306.
Chiu, S. Y., Kao, C. Y., Tsai, M. T., Ong, S. C., Chen, C. H., and Lin, C. S., 2009. Lipid accumulation and CO2utilization ofin response to CO2aeration., 100: 833-838.
Converti, A., Casazza, A. A., Ortiz, E. Y., Perego, P., and Borghi, M. D., 2009. Effect of temperature and nitrogen concentration on the growth and lipid content ofandfor biodiesel production., 48: 1146-1151.
Dong, X. Z., Han, B. T., and Zhao, Y. T., 2019. Enhancing biomass, lipid production, and nutrient utilization of the microalgasp. QLZ-3 in walnut shell extracts supplemented with carbon dioxide., 287: 121419.
Freire, I., Cortina-Burgueño, A., Grille, P., Arizcun, M. A., Abellán, E., Segura, M., Sousa, F. W., and Otero, A., 2016.: A freshwater microalga for marine aquaculture., 459: 124-130.
Hauck, J. T., Scierka, S. J., and Perry, M. B., 1996. Effects of simulated flue gas on growth of microalgae., 41: 1391-1396.
Havlik, I., Lindner, P., Scheper, T., and Reardon, K. F., 2013. On-line monitoring of large cultivations of microalgae and cyanobacteria., 31: 406-414.
Ho, S. H., Chen, W. M., and Chang, J. S., 2010.CNW-N as a potential candidate for CO2mitigation and biodiesel production., 101: 8725-8730.
Ho, S. H., Huang, S. W., Chen, C. Y., Hasunuma, T., Kondo, A., and Chang, J. S., 2013. Bioethanol production using carbohydrate-rich microalgae biomass as feedstock., 135: 191-198.
Hoekman, S. K., Broch, A., Robbins, C., Ceniceros, E., and Natarajan, M., 2012. Review of biodiesel composition, properties, and specifications., 16: 143-169.
Hsueh, H. T., Li, W. J., Chen, H. H., and Chu, H., 2009. Carbon bio-fixation by photosynthesis ofsp. CL-1 and.–, 95: 33-39.
Huang, X. X., Huang, Z. Z., Wen, W., and Yan, J. Q., 2013. Effects of nitrogen supplementation of the culture medium on the growth, total lipid content and fatty acid profiles of three microalgae (,and)., 25: 129-137.
Isioma, N., Muhammad, Y., Sylvester, O., Innocent, D., and Linus, O., 2013. Cold flow properties and kinematic viscosity of biodiesel., 1: 135-141.
Jain, D., Ghonse, S. S., Trivedi, T., Fernandes, G. L., Menezes, D. L., Damare, S. R., Mamatha, S. S., Kumar, S., and Gupta, V., 2019. CO2fixation and production of biodiesel byNIOCCV under mixotrophic cultivation., 273: 672-676.
Kan, S., Chen, B., and Chen, G., 2019. Worldwide energy use across global supply chains: Decoupled from economic grow- th?, 250: 1235-1245.
Kao, C. Y., Chen, T. Y., Chang, Y. B., Chiu, T. W., Lin, H. Y., Chen, C. D., Chang, J. S., and Lin, C. S., 2014. Utilization of carbon dioxide in industrial flue gases for the cultivation of microalgasp., 166: 485- 493.
Kebelmann, K., Hornung, A., Karsten, U., and Griffithsa, G., 2013. Intermediate pyrolysis and product identification by TGA and Py-GC/MS of green microalgae and their extracted protein and lipid components., 49: 38-48.
Khatoon, H., Rahman, N. A., Banerjee, S., Harun, N., Suleiman, S. S., Zakaria, N. H., Lananan, F., Hamid, S. H. A., and Endut, A., 2014. Effects of different salinities and pH on the growth and proximate composition ofsp. andsp. isolated from South China Sea cultured under control and natural condition., 95: 11-18.
Kim, C. J., Jung, Y. H., and Oh, H. M., 2007. Factors indicating culture status during cultivation of()., 45: 122-127.
Knothe, G., 2009. Improving biodiesel fuel properties by modifying fatty ester composition., 2: 759-766.
Krienitz, L., and Wirth, M., 2006. The high content of polyunsaturated fatty acids in(Eustigmatophyceae) and its implication for food web interactions, freshwater aquaculture and biotechnology., 36: 204-210.
Kumar, K., Dasgupta, C. N., Nayak, B., Lindblad, P., and Das, D., 2011. Development of suitable photobioreactors for CO2sequestration addressing global warming using green algae and cyanobacteria., 102: 4945-4953.
Lam, M. K., and Lee, K. T., 2013. Effect of carbon source towards the growth offor CO2bio-mitiga- tion and biodiesel production., 14: 169-176.
Lee, S., Tanaka, D., Kusaka, J., and Daisho, Y., 2002. Effects of diesel fuel characteristics on spray and combustion in a diesel engine., 23: 407-414.
Long, S. P., Zhu, X. G., Naidu, S. L., and Ort, D. R., 2006. Can improvement in photosynthesis increase crop yields?, 29: 315-330.
Lv, J. M., Cheng, L. H., Xu, X. H., Zhang, L., and Chen, H. L., 2010. Enhanced lipid production ofby adjustment of cultivation conditions., 101: 6797-6804.
Ma, Y., Wang, Z., Yu, C., Yin, Y., and Zhou, G., 2014. Evaluation of the potential of 9strains for biodiesel production., 167: 503-509.
Matsumoto, H., Hamasaki, A., Sioji, N., and Ikuta, Y., 1997. Influence of CO2, SO2and NO in flue gas on microalgae productivity., 30: 620-624.
Meier, L., Perez, R., Azocar, L., Rivas, M., and Jeison, D., 2015. Photosynthetic CO2uptake by microalgae: An attractive tool for biogas upgrading., 73: 102-109.
Miyachi, S., Iwasaki, I., and Shiraiwa, Y., 2003. Historical perspective on microalgal and cyanobacterial acclimation to low- and extremely high-CO2conditions., 77: 139-153.
Mohammad-Ghasemnejadmaleki, H., Almassi, M., and Nasirian, N., 2014. Biodiesel production from microalgae and determine properties of produced fuel using standard test fuel., 5: 47-55.
Moraesa, L., Rosaa, G. M., Morillas Españad, A., Santosb, L. O., Moraisc, M. G., Molina Grimad, E., Costaa, J. A. V., and Acién Fernández, F. G., 2019. Engineering strategies for the enhancement ofoutdoor production: Influence of the CO2flow rate on the culture performance in tubular photobioreactors., 76: 171-177.
Mudimu, O., Rybalka, N., Bauersachs, T., Friedl, T., and Schulz, R., 2015. Influence of different CO2concentrations on microalgae growth, α-tocopherol content and fatty acid composition., 32: 291-303.
Mwangi, J. K., Lee, W. J., Chang, Y. C., Chen, C. Y., and Wang, L. C., 2015. An overview: Energy saving and pollution reduction by using green fuel blends in diesel engines., 159: 214-236.
Parupudi, P., Kethineni, C., Dhamole, P. B., Vemula, S., Allu, P. R., Botlagunta, M., Kokilagadda, S., and Ronda, S. R., 2016. CO2fixation and lipid production by microalgal species., 33: 587-593.
Rodolfi, L., Zittelli, G. C., Bassi, N., Padovani, G., Biondi, N., Bonini, G., and Tredici, M. R., 2009. Microalgae for oil: Strain selection, induction of lipid synthesis and outdoor mass cultivation in a low-cost Photobioreactor., 102: 100-112.
Ronda, R. S., Kethineni, C., Parupudi, L. C. P., Thunuguntla, V. B. S. C., Vemula, S., Settaluri, V. S., Allu, P. R., Grande, S. K., Sharma, S., and Kandala, C. V., 2014. A growth inhibitory model with SOx influenced effective growth rate for estimation of algal biomass concentration under flue gas atmosphere., 152: 283-291.
Santikul, I. V. D., 2000. The pH tolerance of(Volvocales, Chlorophyta)., 38: 147-151.
Sarin, A., Arora, R., Singh, N. P., Sharma, M., and Malhotra, R. K., 2009. Influence of metal contaminants on oxidation stability of Jatropha biodiesel., 34: 1271-1275.
Sasaki, Y., Kozaki, A., and Hatano, M., 1997. Link between light and fatty acid synthesis: Thioredoxin-linked reductive activation of plastidic acetyl-CoA carboxylase., 94: 11096- 11101.
Shah, S. M. U., Radziah, C. C., Ibrahim, S., Latiff, F., Othman, M. F., and Abdullah, M. A., 2014. Effects of photoperiod, salinity and pH on cell growth and lipid content of., 64: 157-164.
Stanier, R. Y., Kunisawa, R., Mandel, M., and Cohen-Bazire, G., 1971. Purification and properties of unicellular blue-green algae (order Chroococcales)., 35: 171-205.
Szybist, J. P., Song, J., Alam, M., and Boehman, A. L., 2007. Biodiesel combustion, emission and emission control., 88: 679-691.
Taleb, A., Pruvost, J., Legrand, J., Marec, H., Le-Gouic, B., Mirabella, B., Legeret, B., Bouvet, S., Peltier, G., Li-Beisson, Y., Taha, S., and Takache, H., 2015. Development and validation of a screening procedure of microalgae for biodiesel production: Application to the genus of marine microalgae., 177: 224-232.
Tang, D., Han, W., Li, P., Miao, X., and Zhong, J., 2011. CO2biofixation and fatty acid composition ofandin response to different CO2levels., 102: 3071-3076.
Vargas, M. A., 1998. Biochemical composition and fatty acid content of filamentous nitrogen-fixing cyanobacteria., 34: 812-817.
Vuppaladadiyam, A. K., Yao, J. G., Florin, N., George, A., Wang, X., Labeeuw, L., Jiang, Y., Davis, R. W., Abbas, A., Fennell, P. S., Zhao, M., and Ralph, P., 2018. Impact of flue gas compounds on microalgae and mechanisms for carbon assimilation and utilization., 11 (2): 334-355.
Wang, B., Li, Y., Wu, N., and Lan, C. Q., 2008. CO2bio-miti- gation using microalgae., 79: 707-718.
Wang, X. W., Liang, J. R., Luo, C. S., Chen, C. P., and Gao, Y. H., 2014. Biomass, total lipid production, and fatty acid composition of the marine diatomin response to different CO2levels., 161: 124-130.
Wang, Y. J., Meng, F. P., Li, Y. F., and Cui, H. W., 2015. Internally LED-illuminated flat plate photobioreactor for microalgae cultivation-carbon-fixation and production of lipid incultured in photobioreactor., 35: 1526-1534 (in Chinese with English abstract).
Wijffels, R. H., and Barbosa, M. J., 2010. An outlook on microalgal biofuels., 329: 796-799.
Wu, L. F., Chen, P. C., and Lee, C. M., 2013. The effects of nitrogen sources and temperature on cell growth and lipid accumulation of microalgae., 85: 506-510.
Yoo, C., Choi, G. G., Kim, S. C., and Oh, H. M., 2013.sp. YC001 showing high growth rate and lipid content under high CO2., 127: 482-488.
Yoshihara, K. I., Nagase, H., Eguchi, K., Hirata, K., and Miyamoto, K., 1996. Biological elimination of nitric oxide and carbon dioxide from flue gas by marine microalga NOA-113 cultivated in a long tubular photobioreactor., 82: 351-354.
Zhao, B., and Su, Y., 2014. Process effect of microalgal-carbon dioxide fixation and biomass production: A review., 31: 121-132.
Zhu, B., Sun, F., Yang, M., Lu, L., Yang, G. P., and Pan, K. H., 2014. Large-scale biodiesel production using flue gas from coal-fired power plants withmicroalgal biomass in open raceway ponds., 174: 53-59.
. Tel: 0086-532-66782875
E-mail:mengfanping@ouc.edu.cn
August 3, 2019;
March 2, 2020;
May 1, 2020
(Edited by Ji Dechun)
 Journal of Ocean University of China2020年5期
- Journal of Ocean University of China的其它文章
- Phaeocystis globosa Bloom Monitoring: Based on P. globosa Induced Seawater Viscosity Modification Adjacent to a Nuclear Power Plant in Qinzhou Bay, China
- Fuzzy Sliding Mode Active Disturbance Rejection Control of an Autonomous Underwater Vehicle-Manipulator System
- The 9–11 November 2013 Explosive Cyclone over the Japan Sea- Okhotsk Sea: Observations and WRF Modeling Analyses
- Real-Time Position and Attitude Estimation for Homing and Docking of an Autonomous Underwater Vehicle Based on Bionic Polarized Optical Guidance
- Characterization of the Complete Mitochondrial Genome of Arius dispar (Siluriformes: Ariidae) and Phylogenetic Analysis Among Sea Catfishes
- Establishment and Characterization of Four Long-Term Cultures of Neural Stem/Progenitor Cell Lines from the Japanese Flounder Paralichthys olivaceus
