Shear wave elastography may be sensitive and more precise than transient elastography in predicting significant fibrosis
Tian-Tian Yao,Jing Pan,Jian-Dan Qian,Hao Cheng,Yan Wang,Gui-Qiang Wang
Tian-Tian Yao,Jing Pan,Jian-Dan Qian,Hao Cheng,Yan Wang,Gui-Qiang Wang,Department of Infectious Diseases,Peking University First Hospital,Beijing 100034,China
Gui-Qiang Wang,Peking University International Hospital,Beijing 102206,China
Gui-Qiang Wang,the Collaborative Innovation Center for Diagnosis and Treatment of Infectious Diseases,Zhejiang University,Hangzhou 310058,Zhejiang Province,China
Abstract
Key words:Liver stiffness measurements;Liver fibrosis;Shear wave elastography;Transient elastography;Chronic hepatitis B;Diagnostic efficiency
INTRODUCTION
Assessment of liver fibrosis in chronic hepatitis B (CHB) patients is crucial as different antiviral therapies exist for CHB patients with or without significant liver fibrosis.Precise evaluation of the liver fibrosis stage before initiating treatment is important in treatment-naive CHB patients[1].Liver biopsy is currently carried out to evaluate liver fibrosis stage[2].However,liver biopsy is limited due to complications that occur afterward[3],sampling error and the inability to monitor the process.Therefore,noninvasive liver stiffness measurements (LSMs) are more likely to be performed in CHB patients.These measurements are helpful in deciding whether to initiate antiviral therapy for treatment-naive CHB patients as well as for monitoring during the entire duration of therapy and the follow-up period.
Transient elastography (TE) is a noninvasive,valid,rapid,reproducible and widely used method to evaluate liver stiffness by measuring the velocity of elastic shear waves in the liver parenchyma[4].However,TE values are unreliable in some conditions,such as patients with high alanine aminotransferase levels (ALT),those who are overweight,and those with thick abdominal fat,hepatic inflammatory activity,extrahepatic cholestasis,ascites,older age,and a narrow intercostal space[5-7].Two-dimensional (2-D) shear wave elastography (SWE) is another noninvasive LSM assessment method that is available on traditional ultrasound machines.Compared to TE,SWE can be conveniently performed using a conventional ultrasound scanner to create a real-time,2-D map of liver tissue stiffness under the guidance of B-mode imaging.SWE has been proven to be a reliable method for measuring liver stiffness in chronic liver diseases[8-12].However,only a few studies have evaluated SWE in the assessment of treatment-naive CHB patients,and most of these studies focused oncomparing the diagnostic performance of SWE with TE[13-15].Furthermore,no published study has evaluated the diagnostic efficiency by exploring independent factors that affect SWE compared to TE.Therefore,the aim of this study was to analyze the potential influencing factors of SWE and TE and to compare the performance of SWE and TE for diagnosing significant fibrosis based on a cohort of treatment-naive CHB patients.
MATERIALS AND METHODS
Patients
Between October 2013 and May 2015,54 treatment-naive CHB patients who underwent liver biopsy to assess liver fibrosis were prospectively considered for inclusion in this study.The inclusion criteria were as follows:(1) Hepatitis B surface antigen present in the serum for at least 6 mo;and (2) Availability of liver histologic assessment and SWE and TE results determined within 1 mo.The exclusion criteria were (1) any previous anti-hepatitis B virus (HBV) therapy;(2) decompensated liver cirrhosis and hepatocarcinoma;(3) other chronic liver diseases,including hepatitis C virus,autoimmune liver disease,alcoholic liver disease,nonalcoholic fatty liver disease or drug-induced liver injury;and (4) age more than 65 years old or less than 18 years old,pregnant women and patients with psychiatric disorders.Clinical data,including basic information (age,sex,weight,and height),blood test results,LSMs,thickness of the spleen and diameter of the portal vein were recorded 1 mo before or after liver biopsy.The blood tests included white blood cell (WBC) count;neutrophil count (NEU);hemoglobin (HB);platelet count (PLT);ALT;aspartate aminotransferase(AST);total bilirubin (TBIL);cholinesterase (CHE);serum creatinine (SCR);prothrombin time (PT);activated partial thromboplastin time (APTT);prothrombin activity (PTA);international normalized ratio (INR);hepatitis B surface antibody(HBsAb);hepatitis B e antigen (HBeAg);hepatitis B e antibody (HBeAb);hepatitis B c antibody and HBV-DNA.Body mass index (BMI) was calculated as the weight(kg)/[height (m)]2.Written informed consent was obtained from all patients,and the study was approved by the Ethics Committee of Peking University First Hospital.
Liver histological assessment
All patients were subjected to liver biopsy under ultrasonographic guidance.Patients were placed in the supine position.Percutaneous liver biopsies were performed using 18-gauge automated needles.During the puncture,the large blood vessels,common bile duct and gallbladder were bypassed.Liver tissue specimens were obtained from the right hepatic lobe,and then these samples were fixed in formalin and embedded in paraffin for pathological interpretation.A minimum tissue specimen of 20 mm with at least 11 portal tracts was considered valid for diagnosis.All liver tissue specimens were blindly and independently reviewed by two hepatopathologists from Beijing You An Hospital affiliated with Capital Medical University.When discrepancies occurred,the final decision was made by a third,experienced hepatopathologist,who was also responsible for reassessment of 10% of samples chosen at random.The inflammation grade and fibrosis stage were assessed with the Ishak scoring system[16].Fibrosis was scored as follows:F 0-1,no/mild fibrosis;F ≥ 2,moderate fibrosis;F ≥ 3,significant fibrosis;F ≥ 4,advanced fibrosis;and F ≥ 5,cirrhosis.Inflammation grading was performed using the modified histology activity index (HAI) and scored as follows:HAI 0-4,no/mild inflammation;HAI 5-6,moderate inflammation;HAI ≥ 7,severe inflammation.
TE
TE was performed on fasting patients using a one-dimensional ultrasound TE device(FibroScan,Echosens,Paris,France) with an M probe.The experienced operator had carried out at least 100 TE procedures and was blinded to the patients’ clinical data.LSMs were obtained from the right lobe of the liver through the intercostal spaces with the patient lying in the dorsal decubitus position and the right arm in maximal abduction.The operator pressed the probe button to begin the measurements.LSM values are expressed in kPa.Measurements were considered reliable when at least 10 valid measurements,an interquartile range (IQR)/median value <30% and a success rate >60% were obtained[4].
SWE
Two-dimensional SWE was also performed on fasting patients using the AixPlorer US system (SuperSonic Imagine,Aix-en-Provence,France) with a convex broadband probe (SC6-1,1–6 MHz).A radiologist (X.L.Tian) with more than 30 years of experience in performing ultrasonic examinations carried out the procedures and was also blinded to the patients’ clinical data and TE results.The patients were placed in the supine position,and the right arm was in maximal abduction.The SWE measurements were then performed on the right lobe of the liver through the intercostal spaces.When the target area was located,SWE was started,and the patient was asked to hold their breath during quiet breathing for approximately 5 s.The elasticity image box,which was approximately 4 cm × 3 cm,was in an area of the liver parenchyma free of large vessels and bile ducts.A circular region of interest (ROI)with a 2 cm diameter was then positioned in an area of homogeneous color,and the mean,minimum,maximum,and standard deviation (SD) of liver stiffness values were calculated automatically.The mean value was used in the analysis to represent the LSMs.Measurements were considered to have failed when little or no signal was obtained.
Fibrosis-4 and aspartate aminotransferase to platelet ratio index scores
Two noninvasive indices for fibrosis were calculated based on the following formulas:Fibrosis-4 (FIB-4) = [(age × AST)/(platelet count) (× 109/L) × ALT1/2],and aspartate aminotransferase to platelet ratio index (APRI) = [AST/upper limit of normal(ULN)/platelet count (×109/L)] × 100[17,18].
Statistical analyses
A normal distribution test was performed for continuous data.Normal distributed data are presented as the means ± SD,and non-normally distributed data are presented as the median/IQR.Categorical data are expressed as the number of subjects (percentage).Factors affecting liver stiffness values obtained by SWE and TE were first analyzed with univariate linear analysis to perform comparisons between one dependent variable (SWE or TE) and independent variables.Variables with a value ofP<0.05 were included in a multivariate linear regression analysis.Orthogonal partial least squares (OPLS) discriminant analysis was used to rank the ability of the parameters to affect the LSMs of SWE and TE using SIMCA software(version 14.0;Umetrics AB,Umea,Sweden).Differences between SWE and TE were recorded as Bland-Altman plots to evaluate their agreement.Comparisons between groups were performed with a nonparametric test for quantitative variables.Correlations between noninvasive methods and liver fibrosis stages were identified with Spearman’s correlation test.The performance of noninvasive methods in the assessment of liver fibrosis stages was determined using receiver operating characteristic curves.Areas under the receiver operating characteristic curve(AUROCs) were used to estimate the probability of the correct prediction of liver fibrosis stages.Differences between AUROCs were calculated using the Delong test.The value of sensitivity+specificity-1 was used as the cutoff value.Positive and negative predictive values and positive and negative diagnostic likelihood ratios were calculated based on the cutoff values.All statistical tests were two-sided,andPvalues less than 0.05 indicate statistical significance.The statistical analyses were performed using SPSS 23.0 (SPSS Inc.,Chicago,IL,United States) and MedCalc (Version 19.0.7;MedCalc Software bvba,Mariakerke,Belgium).
RESULTS
Patient characteristics
Fifty-four treatment-naive CHB patients were eligible for the study (Table 1);their Ishak HAI grades,liver fibrosis scores,and LSMs were all available.All 54 patients were antiviral therapy-naive CHB patients and included 41 men and 13 women,with a mean age of 36.7 years.The median BMI was 23.9 kg/m2.The median and IQR of serum ALT were higher than those in previous reports (Supplementary Table 1).The median TBIL value was 14.5 μmol/L,ranging from 7.2 μmol/L to 45.0 μmol/L,which was the same as in previous reports (Supplementary Table 1).The mean log10HBVDNA value was 4.8,and the mean HBV-DNA level was 8.8 × 10⁴IU/mL.Almost half of the study population was diagnosed with no/mild fibrosis (F ≤ 2),and the other half was diagnosed with F >2 fibrosis,indicating histopathologically significantfibrosis.Approximately 80% of the population had significant-severe inflammation.The basic demographic,clinical and laboratory characteristics of these patients are summarized in Table 1,and the population characteristics are compared with previous reports in Supplementary Table 1.In addition,pathological images of liver sections and their corresponding SWE and TE images for F0-F5 CHB patients are shown in Supplementary Figures 1-6.
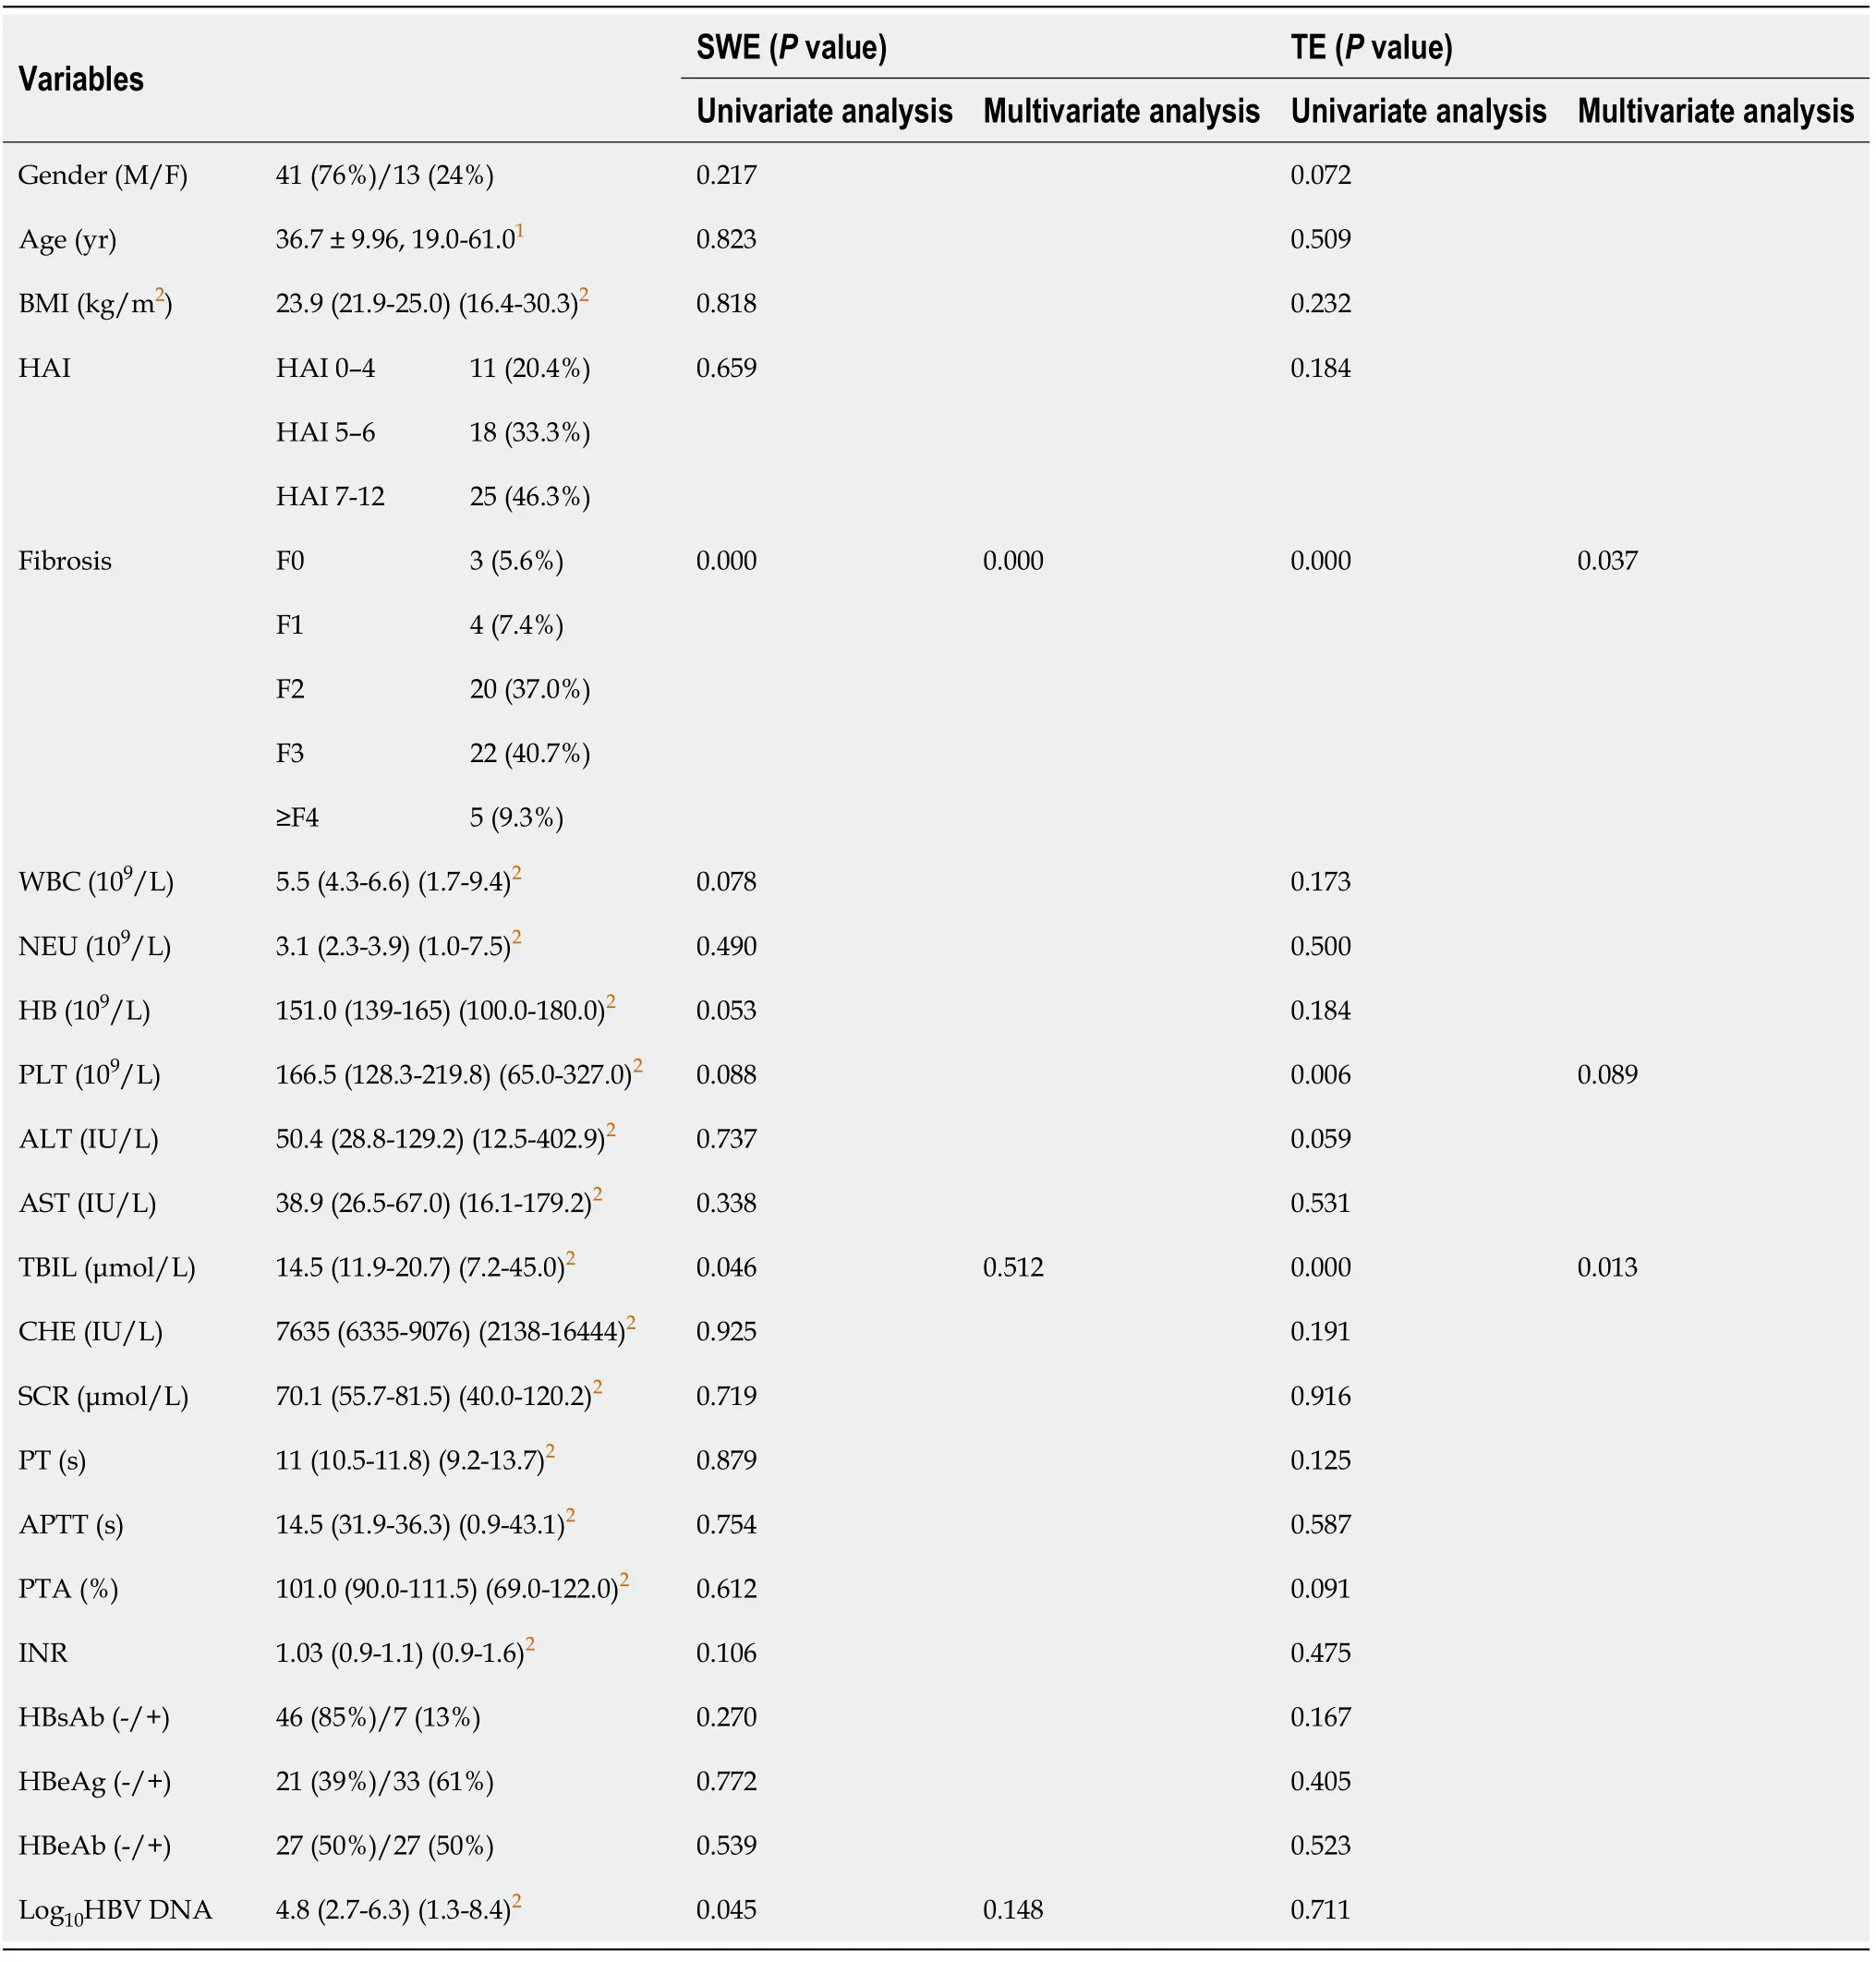
Table 1 Basic demographics and laboratory characteristics of the study population and factors associated with the liver stiffness measurements measured by shear wave elastography and transient elastography in univariate and multivariate linear regression analyses
Analyses of independent factors associated with LSMs of SWE and TE
We investigated the independent factors that affected liver stiffness values measured by SWE and TE.The factors included sex,age,BMI,inflammatory grade (HAI),liver fibrosis stage,WBC count,NEU count,HB,PLT count,ALT,AST,TBIL,CHE,SCR,PT,APTT,PTA,INR,HBsAb,HBeAg,HBeAb and log10HBV DNA (Table 1).With regard to SWE,univariate linear analysis revealed correlations between LSMs of SWE and liver fibrosis stage,TBIL,log10HBV-DNA and the diameter of the portal vein,while multivariate analysis showed that only the liver fibrosis stage was an independent factor that affected LSMs of SWE (P<0.05).With regard to TE,univariate analysis revealed correlations between LSMs of TE and liver fibrosis stage,PLT count and TBIL,while multivariate analysis showed that the liver fibrosis stage and TBIL were independent factors that affected LSMs of TE (P<0.05).
OPLS discriminant analysis was further used to rank the effects of the variables on SWE and TE.As shown in Figure 1,the top predictors were liver fibrosis for both SWE and TE,while higher VIP predictors (>1) were much more common in TE than SWE.Therefore,the SWE value was less affected by the above factors and is a reliable method that is expected to have broader clinical application prospects.
Agreement and correlation among SWE,TE,histological hepatitis fibrosis and liver functional variables
Bland-Altman analysis was used to assess the agreement between the two measurements.The mean difference between the two measurements was 1.3 kPa,the SD was 3.0 kPa,and the upper and lower limits of the mean difference (95%CI) were 11.2 kPa and -8.7 kPa,respectively (Figure 2).These values showed satisfactory agreement of LSMs between SWE and TE.
All 54 patients had been given a confirmed histologic diagnosis using the Ishak score as the reference method.Increasing LSMs values were highly correlated with the progression of fibrosis stages.The LSMs increased as the fibrosis stage increased on both SWE and TE (P<0.001,Figure 3A and B),but TE showed a wider IQR of SDs than SWE.SWE and TE also showed statistical significance in distinguishing mild liver fibrosis (F ≤ 2) and significant liver fibrosis (F >2,Figure 3E and F).However,the FIB-4 and APRI did not show any difference with the progression of fibrosis stage(Figure 3).
Spearman’s correlation between the different noninvasive approaches was also analyzed.The correlation was stronger between the fibrosis stage and SWE,which showed a moderate correlation (r= 0.65,P<0.001),than the association between fibrosis stage and TE,which showed a weak correlation (r= 0.50,P<0.001).The correlations between SWE/TE and liver function variables (ALB,PT,PLT,and ALT)are presented in Supplementary Table 2.TBIL was correlated with both SWE and TE,but thervalue was low.PLT was correlated with TE but not SWE,which is in accordance with our univariate analysis (Table 1).
Comparison of the performance of SWE and TE for diagnosing significant liver fibrosis stage
The AUROCs,cutoff values,sensitivity,specificity,positive predictive values and negative predictive values for the diagnosis of mild liver fibrosis (F ≤ 2) and significant liver fibrosis (F >2) using SWE and TE are shown in Table 2.When predicting significant fibrosis (F >2,Figure 4),the AUROCs of LSMs were 0.786 for SWE (95%CI:0.661-0.911) and 0.714 for TE (95%CI:0.573-0.855) (Figure 4).There were no statistically significant differences in the AUROCs between SWE and TE for significant fibrosis (P>0.05).The optimal cutoff values of LSMs for significant fibrosis were 9.05 kPa for SWE and 8.15 kPa for TE (Table 2).
DISCUSSION
Early diagnosis of significant liver fibrosis is particularly important for clinical treatment decisions in treatment-naive CHB patients,especially in patients with normal ALT and mildly elevated ALT (<2 ULN) who are considered “inactive”[1].Therefore,55% (24/44) of patients with normal or mildly elevated ALT analyzed in our study should initiate antiviral therapy because they were histopathologically diagnosed with significant fibrosis.However,the use of liver biopsy is limited due to its associated complications and sampling errors.Therefore,noninvasive assessments of LSMs are the first choice for CHB patients,especially for treatment-naive CHBpatients who would like to initiate antiviral treatment.Thus,finding precise noninvasive methods for the evaluation of liver fibrosis is an urgent issue.

Table 2 Performance characteristics of shear wave elastography and transient elastography for staging liver fibrosis in chronic hepatitis B patients
SWE is a relatively new technique that is based on estimation of the speed of shear waves on a diagnostic ultrasound system to provide a quantitative estimate of tissue stiffness,similar to TE[19].Considering the interfering factors that may affect the reliability of LSMs,we analyzed the independent factors that affected the liver stiffness values of SWE and TE.The results showed that liver fibrosis stage was the only independent factor that affected the LSMs of SWE,and OPLS analysis also showed that the most important factor for SWE was fibrosis stage.This result was consistent with a previous study that showed that hepatic fibrosis stage was independently correlated with SWE measurements (P<0.001)[20].However,some differences were noted between our findings and previous results.One study indicated the LSMs of SWE were affected not only by the liver fibrosis stage but also by variables such as liver inflammation,AST,ALT,and glutamyl transpeptidase levels[20].Another analysis also demonstrated that aminotransferase levels influenced LSMs of SWE in the index cohort and that TBIL levels influenced LSMs in the validation cohort[13].In the present study,the SWE value was not significantly associated with the above factors,possibly because the cohort in the present study consisted of CHB patients whose aminotransferase levels were higher than those in the reported SWE results (Supplementary Table 1).The higher aminotransferase levels led to no factor being selected in SWE.To investigate whether different inflammatory grades affected the performance of SWE or TE,stratification analysis in subgroups was performed.The results revealed that for both the F ≤ 2 and F >2 groups,the inflammation grade had no significant impact on the performance of SWE or TE.This inconsistent result for the inflammation grade may be caused by the higher inflammatory grade of our study population,in which the percentage of moderate to severe inflammation was 80% (Table 1).Further large-scale research is needed to verify whether aminotransferase levels and a severe inflammatory response in the liver could impact the LSMs of SWE.However,the LSMs of TE were affected by the liver fibrosis stage as well as the TBIL level.This result could be explained by a previous study that indicated that the liver stiffness values were significantly correlated with TBIL[5].The decrease in liver stiffness values was significantly correlated with a decline in serum TBIL levels.Moreover,the number of independent factors (VIP >1) was greater for TE than SWE.TE can be influenced by several factors including aminotransferase levels,liver inflammatory grade and other factors[6,7].Therefore,the present study revealed that SWE is less affected by other factors and is more reliable than TE.This is the only study to compare the independent influencing factors between SWE and TE in the same cohort.
The comparison between the liver elasticity values assessed by SWE and TE showed a good measurement with a mean difference of 1.3 kPa.This result indicated that the measurement results of the two methods exhibited good consistency.Our results showed that both SWE and TE were able to discriminate significant fibrosis from normal or mild fibrosis,and TE showed a broad range of LSMs.Compared to TE,SWE showed a stronger correlation with fibrosis stage (r= 0.65 and 0.50).Spearman’s correlation coefficients between the LSMs and fibrosis stages were similar to those of a previous study (r= 0.78 and 0.65 for SWE and TE,respectively)[15].
We further validated SWE and TE and the diagnostic accuracy of the two methods in CHB patients.The AUROCs were numerically slightly higher for SWE than for TE,although the difference was not significant.SWE had higher accuracy,sensitivity,and specificity than TE.The findings in our study indicated that SWE has better diagnostic accuracy in the assessment of significant liver fibrosis in patients with CHB infection,although both methods could make an accurate assessment between mild fibrosis and significant fibrosis based on the histologic diagnosis.One possible explanation is that SWE has the advantage of real-time 2-D imaging under the guidance of B-mode imaging,allowing this method to yield a circular ROI positioned in a homogeneous area of liver stiffness and avoiding large blood vessels and other tissues in the liver.In contrast to SWE,the probe location of TE is the only factor determined by the operator.The results of our study are similar to those of a previous study on the elastography assessment of liver fibrosis comparing SWE and TE in CHB patients[14,15].The cutoffvalue of SWE for identifying significant fibrosis (F >2) in our treatment-naive CHB patients was 9.05 kPa,which is higher than previous values[13-15],while the mean liver stiffness determined by SWE in the cohort of participants with healthy livers was 5.1 ±1.3 kPa[21].The cutoff TE value for identifying significant fibrosis in our CHB patients was 8.15 kPa,which is also higher than the previously reported value[15].The higher cutoff values in our cohort may be due to elevated transaminase and severe inflammation compared to reported studies (Supplementary Table 1)[7,21].The patients in our study consisted of individuals with active hepatitis B,which was supported by liver biopsy HAI scores,rather than a mixed cohort of hepatitis B carriers and inactive CHB patients.These data may provide evidence for therapeutic decision-making.
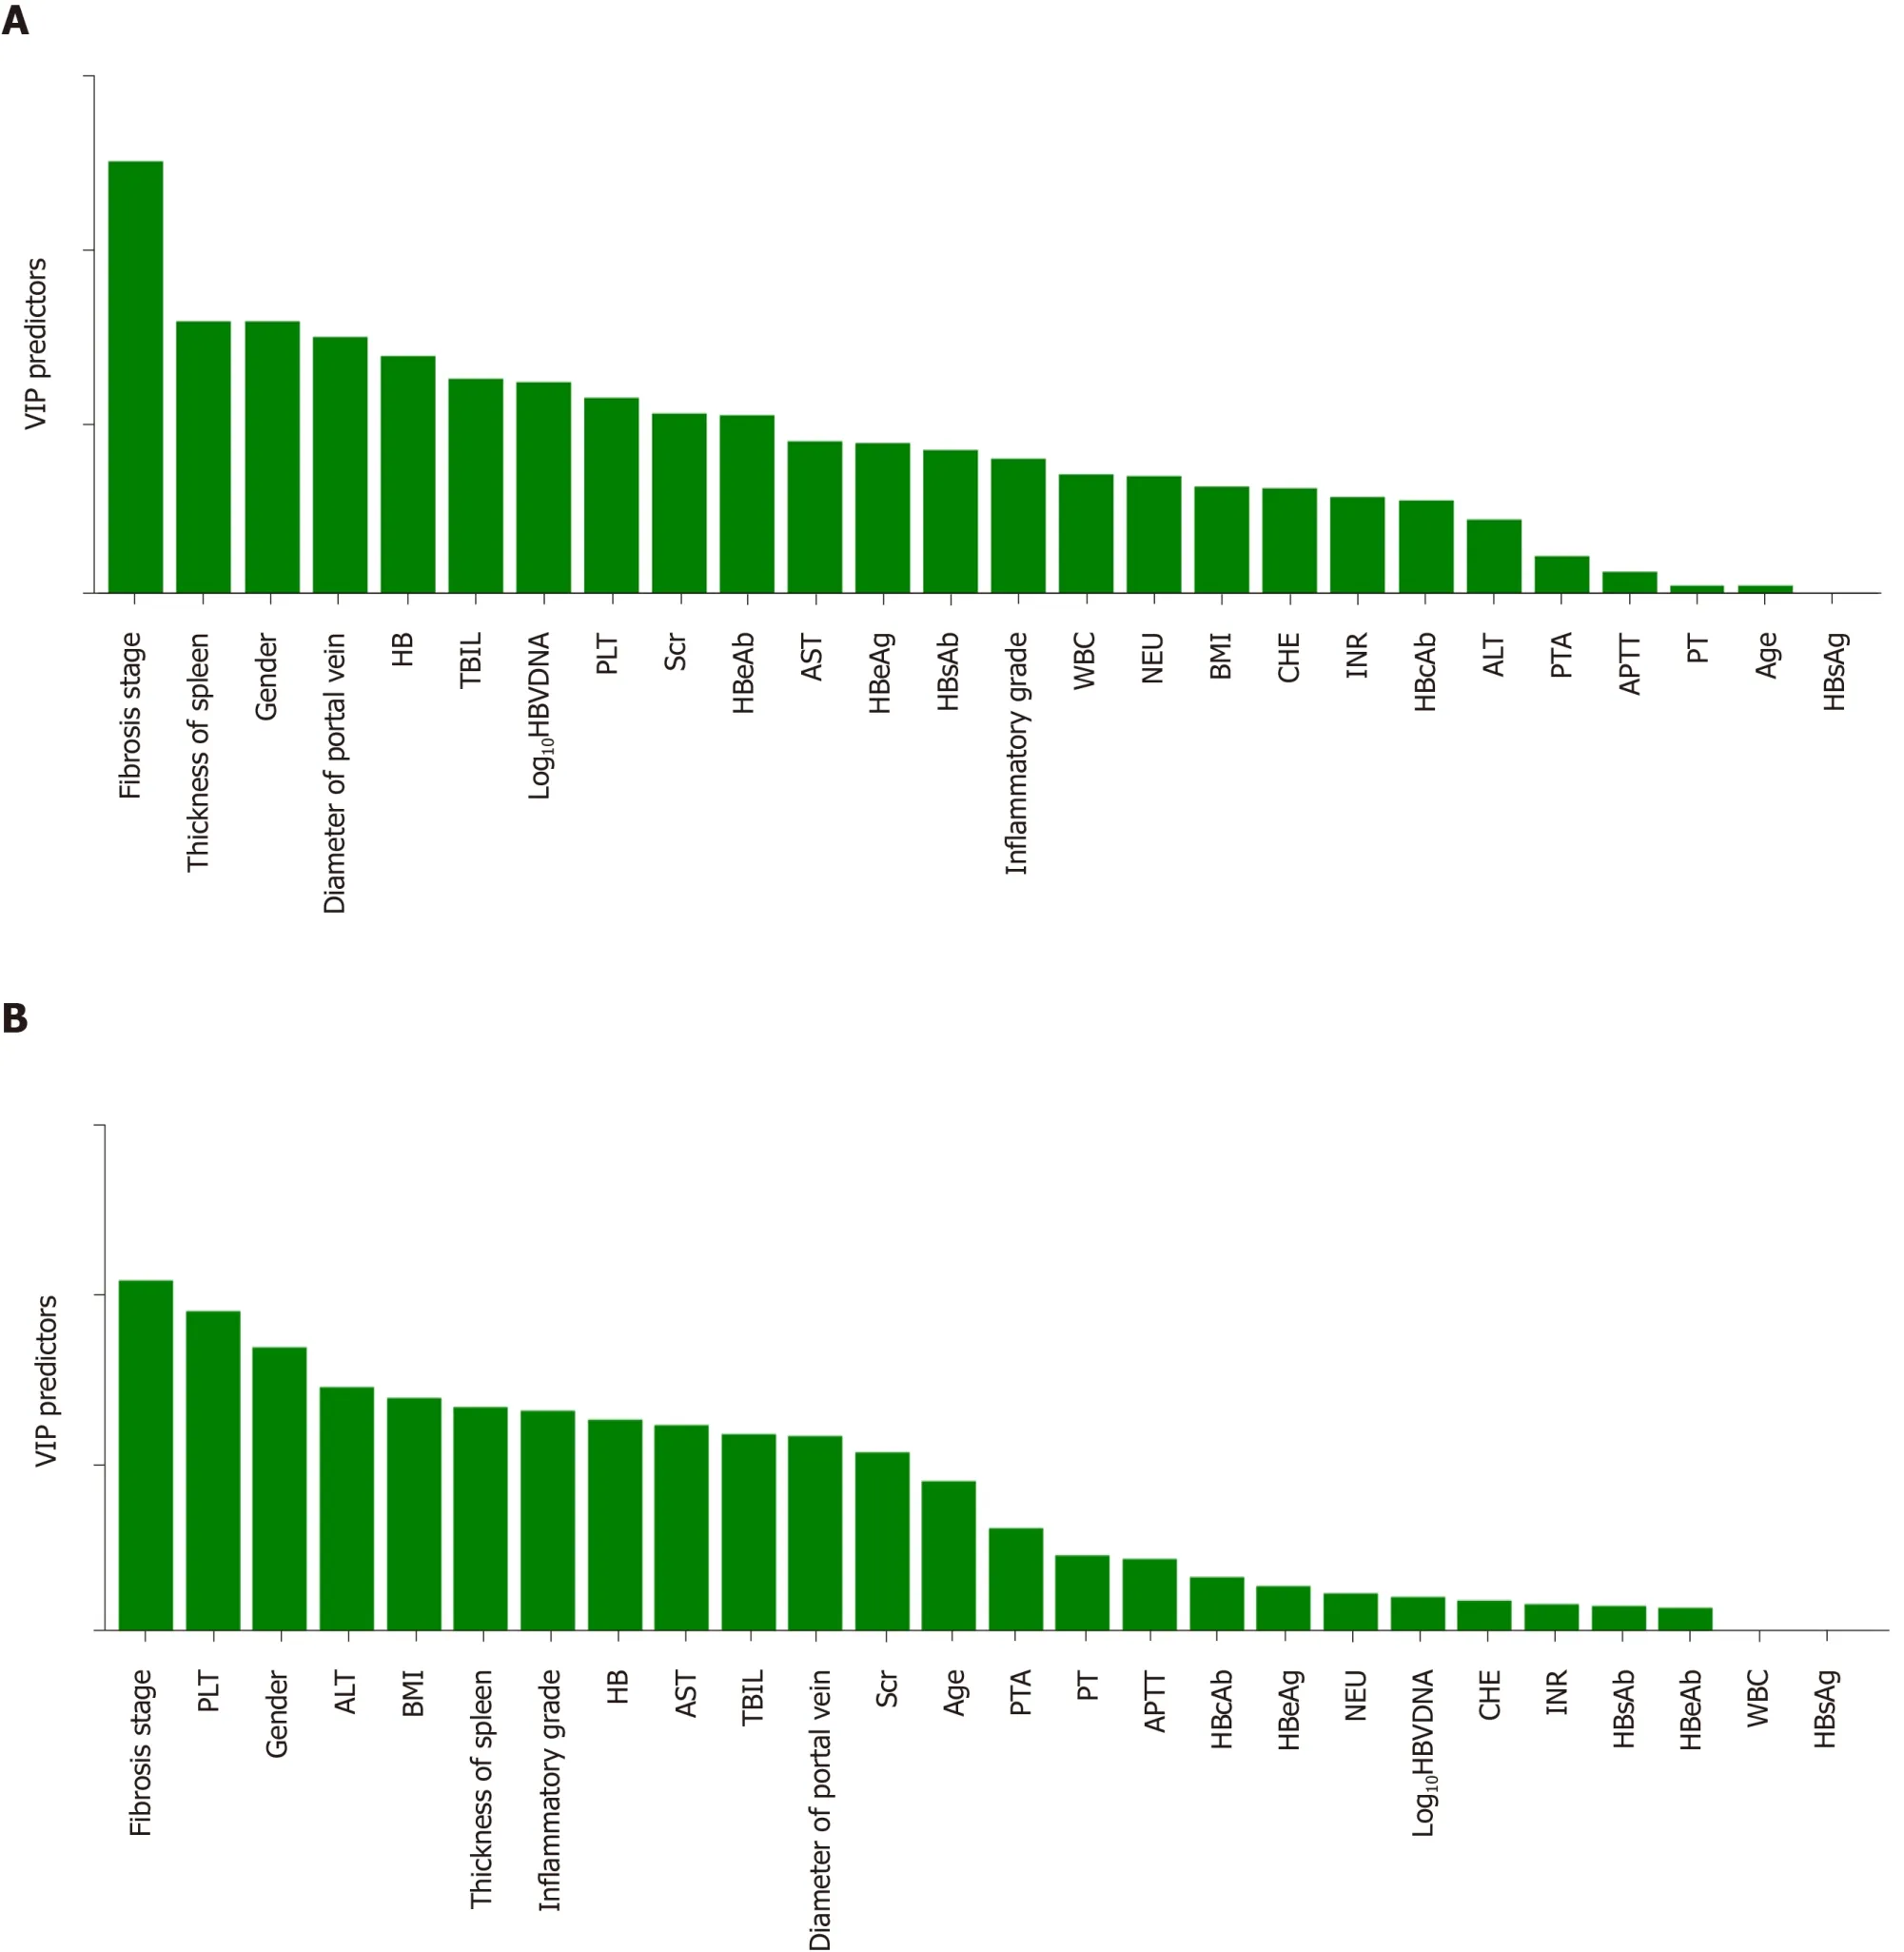
Figure 1 Results of orthogonal partial least squares discriminant analysis.The abscissa indicates various factors and is arranged from left to right according to the influence on liver stiffness measurements.The ordinate shows the VIP value,which represents the power of the effect.A:The results of orthogonal partial least squares (OPLS) discriminant analysis of shear wave elastography;B:The results of OPLS discriminant analysis of transient elastography.HB:Hemoglobin;TBIL:Total bilirubin;PLT:Platelet;AST:Aspartate aminotransferase;HBeAb:Hepatitis B e antibody;HBeAg:Hepatitis B e antigen;HBsAb:Hepatitis B surface antibody;HBsAg:Hepatitis B surface antigen;HBV-DNA:Hepatitis B virus DNA;WBC:White blood cell;NEU:Neutrophils;BMI:Body mass index;CHE:Cholinesterase;INR:International normalized ratio;ALT:Alanine aminotransferase;PTA:Prothrombin activity;APTT:Activated partial thromboplastin time;PT:Prothrombin time.
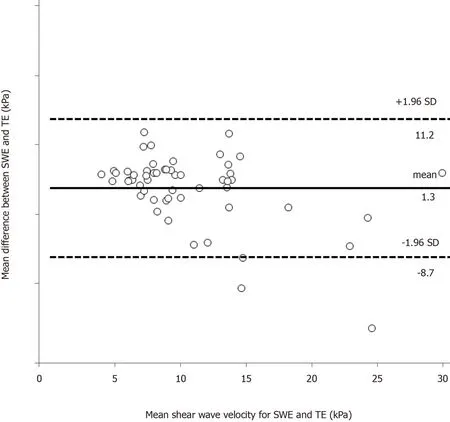
Figure 2 Bland-Altman analysis:Agreement between liver stiffness measurements obtained with shear wave elastography and transient elastography.The abscissa shows the mean of the two measurement methods,and the ordinate shows the difference between the two measurement methods.A:The solid line represents the mean of the difference in shear wave velocity of shear wave elastography (SWE),the dashed lines represent the 95% upper and lower limits of agreement of SWE;B:The solid line represents the mean of the difference in shear wave velocity of transient elastography (TE),the dashed lines represent the 95% upper and lower limits of agreement of TE.SWE:Shear wave elastography;TE:Transient elastography.
The strength of this study is that 54 treatment-naive CHB patients were prospectively enrolled in our study.Additionally,the liver biopsy specimens were standard samples as they met the American Society for the Study of Liver Diseases criteria of being at least 2-3 cm in length and having at least 11 portal tracts[3].Pathological interpretation of biopsy specimens was performed by experienced hepatopathologists.The assessment of interobserver variability was controlled by a third experienced liver pathologist.In addition,considering that the SWE and TE data may have biases between different operators,we designated one operator for SWE and TE.Based on our reliable data,we analyzed the dependent factors that affected the measurement of SWE and TE,which revealed that SWE was less affected than TE.According to the AUROCs of SWE and TE,SWE may be more sensitive and precise than TE in discriminating significant fibrosis (>F2).This modality might help identify CHB patients who may benefit from treatment.Thus,SWE may have broader clinical application prospects in standard examinations for HBV patients.The limitation of the study is that the sample size was relatively small,and the present results need to be verified in further large-scale trials.
In conclusion,SWE can be successfully used for the assessment of liver fibrosis stages in CHB patients.It can provide comparable diagnostic accuracy without being affected by various factors.
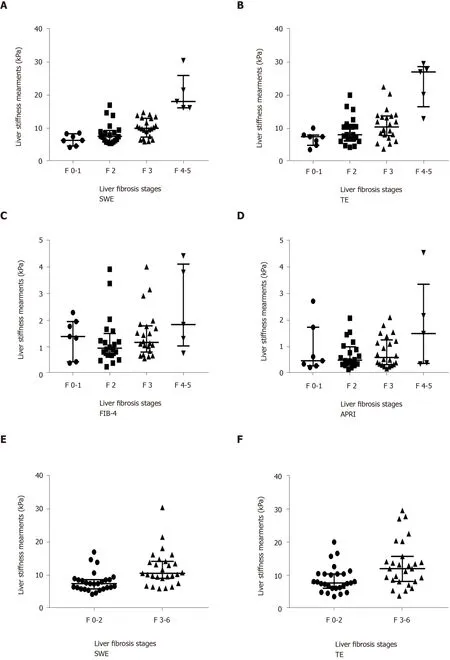
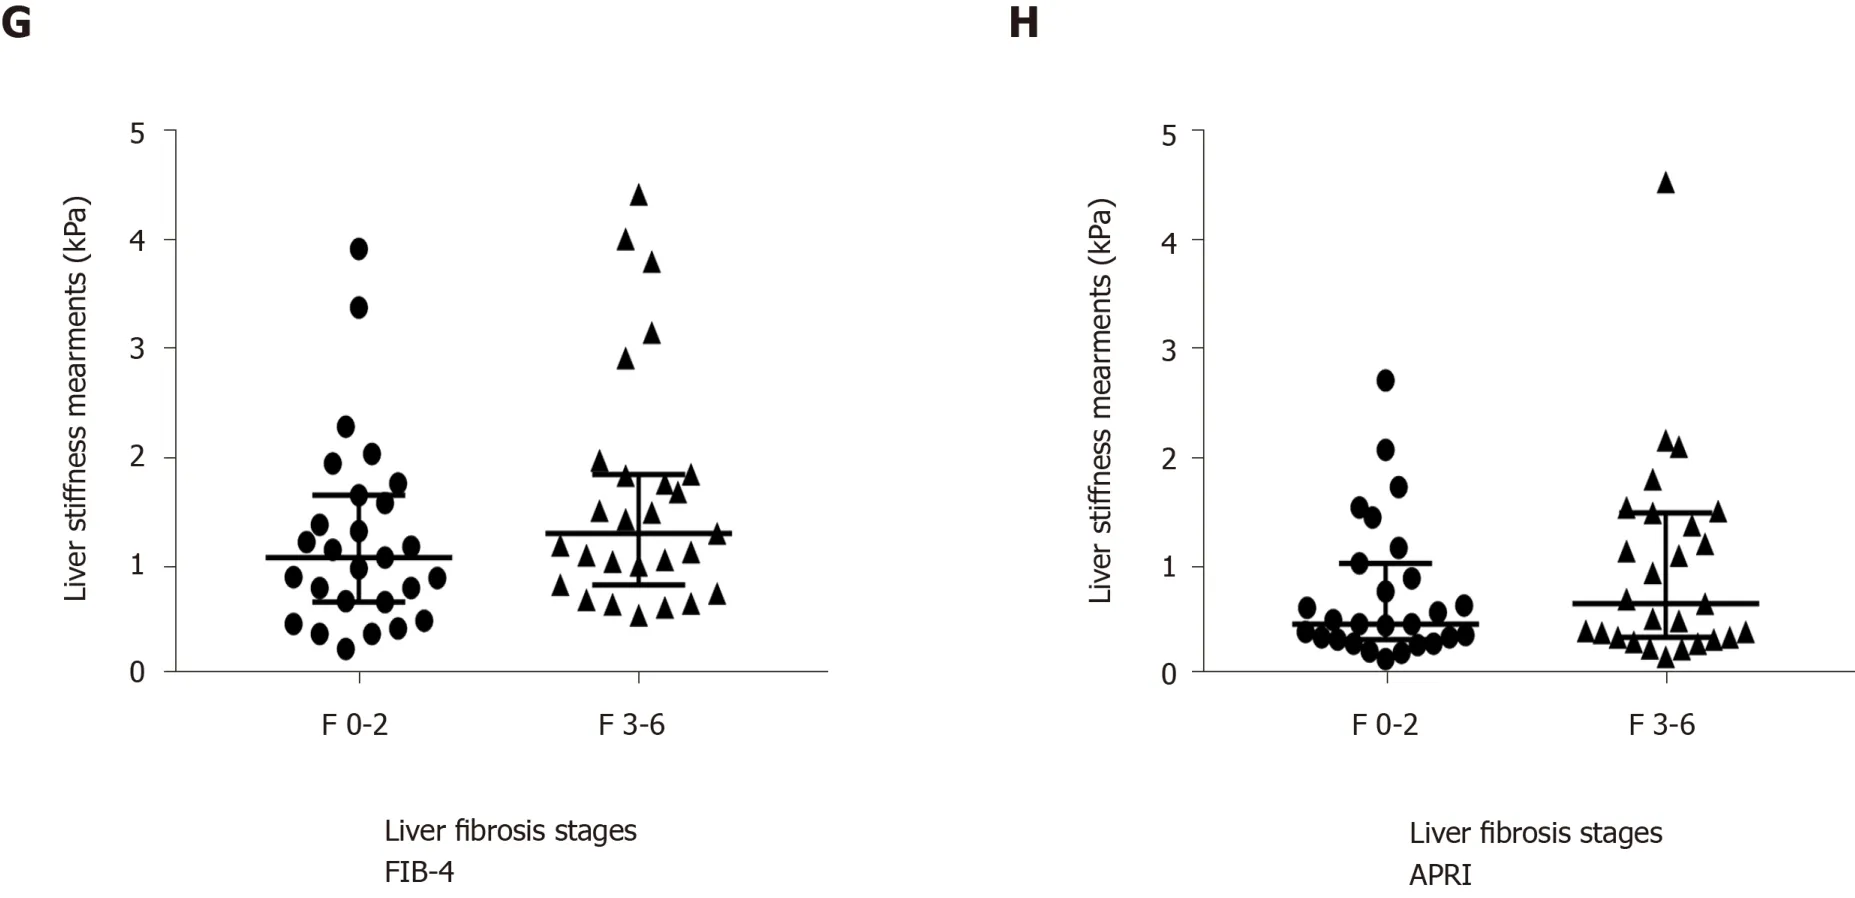
Figure 3 Liver stiffness measurements obtained using shear wave elastography,transient elastography,fibrosis-4 and the aspartate aminotransferase to platelet ratio index in chronic hepatitis B patients.The long line indicates the medians,and the two outer lines indicate the interquartile ranges.SWE:Shear wave elastography;TE:Transient elastography;FIB-4:Fibrosis-4;APRI:Aspartate aminotransferase to platelet ratio index.

Figure 4 Areas under the receiver operating characteristic curves.Areas under the receiver operating characteristic curves (AUROCs) for shear wave elastography and transient elastography in assessing significant liver fibrosis (F >2) in patients with chronic hepatitis B infection.There were no significant differences in the AUROCs between the two examination methods.SWE:Shear wave elastography;TE:Transient elastography.
ARTICLE HIGHLIGHTS
Research background
Precise evaluation of the liver fibrosis stage before initiating treatment is important for treatment-naive chronic hepatitis B (CHB) patients.Noninvasive measurements including transient elastography (TE) and two-dimensional shear wave elastography(SWE) have been used clinically instead of liver biopsy for regular assessment of liver fibrosis in CHB patients.SWE has been proven to be a reliable method for measuring liver stiffness in chronic liver diseases.
Research motivation
However,only a few studies have evaluated SWE in the assessment of treatment-naive CHB patients,and most of these studies focused on comparing the diagnostic performance of SWE with TE.Furthermore,no published study has evaluated the diagnostic efficiency by exploring independent factors that affect SWE compared to TE.
Research objectives
We aimed to investigate the diagnostic efficiency of SWE compared to TE by exploring independent influencing factors and performance for diagnosing significant fibrosis based on our cohort of treatment-naive CHB patients.
Research methods
Fifty-four treatment-naive CHB patients who underwent liver biopsy to determine whether to initiate antiviral therapy were enrolled.SWE,TE,serum tests and liver biopsy were performed for all participants.The fibrosis-4 and aspartate aminotransferase to platelet ratio index scores were also calculated.Potential independent influencing factors of SWE and TE values were analyzed.Based on the liver pathology results,the agreement and correlation were determined,and a comparison of the two methods was performed.
Research results
There were 27 cases (50%) of mild fibrosis (F0-F2) and 27 (50%) cases of significant fibrosis (F3-F6);fibrosis was assessed with the Ishak scoring system.Multivariate linear regression analyses revealed that the fibrosis stage was the only factor that affected the SWE values (P<0.001),whereas the total bilirubin level (P= 0.013) and fibrosis stage (P= 0.037) were independent factors that affected TE values.Orthogonal partial least squares discriminant analysis showed that the number of independent factors (VIP >1) was higher for TE than SWE.Bland-Altman analysis showed satisfactory agreement between the liver stiffness measurements (LSMs) of SWE and TE.
Research conclusions
Both SWE and TE could significantly discriminate significant fibrosis from mild fibrosis (P<0.001).SWE exhibited a higher correlation with LSMs of liver fibrosis than TE (r= 0.65 and 0.50,P<0.001).The diagnostic performance of SWE was better than that of TE for significant fibrosis (F >2).
Research perspectives
Thus,SWE may have broader clinical application prospects in standard examinations for HBV patients.The finding in the present study might help identify CHB patients who may benefit from treatment.Due to the limitation of the study,the present results need to be verified in further large-scale trials.
ACKNOWLEDGEMENTS
We sincerely thank Dr.Tian XL and Dr Zhu SN for their contributions to this study.
 World Journal of Clinical Cases2020年17期
- World Journal of Clinical Cases的其它文章
- Autoimmunity as the comet tail of COVID-19 pandemic
- Gender medicine:Lessons from COVID-19 and other medical conditions for designing health policy
- Complexities of diagnosis and management of COVID-19 in autoimmune diseases:Potential benefits and detriments of immunosuppression
- Incidental anal 18fluorodeoxyglucose uptake:Should we further examine the patient?
- Emergency surgery in COVID-19 outbreak:Has anything changed?Single center experience
- Somatostatin receptor scintigraphy in the follow up of neuroendocrine neoplasms of appendix
