CO2 flux of soil respiration in natural recovering karst abandoned farmland in Southwest China
Yanwei Wang · Weijun Luo · Guangneng Zeng · Hanling Yang ·Meifang Wang · Yina Lyu · Anyun Cheng · Lin Zhang · Xianli Cai ·Jia Chen · Shijie Wang
Abstract To estimate carbon sequestration potential in the karst area, soil respiration in a natural recovering karst abandoned farmland in Shawan, Puding, Guizhou, southwest China was continuously and automatically monitored for more than two years. The results show that the CO2 flux of soil respiration (2.63 ± 1.89 μmol m-2 s-1) is higher in the karst area than in non-karst areas under similar conditions but that regional value (1.32 μmol m-2 s-1) is lower because of larger rock fragment coverage (~ 50 %). At the same time, the temperature sensitivity of soil respiration (Q10) in this study area is significantly higher than that of non-karst areas under similar conditions. Soil respiration has an obvious temporal variation, which is reflected in a significant exponential relationship between soil respiration and soil temperature, but the relationship between soil respiration and soil moisture is very complex. Especially,soil respiration has an obvious spatial variation, which is likely affected by different diffusion or water-rock reaction processes.
Keywords Karst critical zone · Abandoned land · Soil respiration · Carbon cycle
1 1 Introduction
Soil is the largest carbon pool (Batjes 1996) in the terrestrial ecosystem, containing approximately three times the amount of carbon in the atmosphere (Falkowski et al. 2000)and four times the amount of carbon in the phytomass(Goldewijk et al. 1994). Moreover, soil respiration is an important carbon flux between the terrestrial ecosystem and the atmosphere (Zhang et al. 2013). Therefore, soil respiration is a major carbon source of the atmosphere through exchange with it. Even though only a small change occurs in the soil carbon pool, it has an important impact on the atmospheric carbon pool (Raich and Schlesinger 1992).
Since the 1980s, there have been many important scientific achievements made through systematic monitoring of soil respiration. First, monitoring methods for soil respiration, such as chamber methods and micro-meteorological methods, have been devised (Maier and Schack-Kirchner 2014). Second, soil respiration flux values have been measured from high-latitude areas (Qi et al. 2010; Han et al. 2009) to subtropical karst shrubland (Liu et al. 2009),as well as in the Masson pine forest (MPF), coniferous and broad-leaf mixed forest (MF), and subtropical monsoon evergreen broad-leaf forest (MEBF) in South China (Yan et al. 2006), with mean rates of soil respiration in different types of vegetation being ~0.16-3.31 μmol m-2s-1(Raich and Schlesinger 1992). Third, many factors affecting soil respiration have been established; these include soil temperature, soil moisture, and soil organic carbon (SOC)(Jassal et al. 2004; Fo´ti et al. 2016; Zhang et al. 2005, 2013;Liu and Fang 1997; Gomes et al. 2016; Chang et al. 2009;Cook and Orchard 2008; Yi et al. 2007; Murthy et al. 2003;Ouyang and Zheng 2000; Andrews et al. 2000; Fang and Moncrieff 1999; Raich and Schlesinger 1992). At the same time, the temperature-sensitive coefficient (Q10value) of soil respiration has been commonly used to express the relationship between soil respiration and soil temperature,and this has attracted the attention of many scholars (Do¨rr and Mu¨nnich, 1987; Qi et al. 2010; Gomes et al. 2016;Ouyang et al. 2015; Zhang et al. 2013; Bond-Lamberty and Thomson 2010; Murthy et al. 2003). The global average Q10value is 1.57 (Liu and Fang 1997) or 1.5 (Bond-Lamberty and Thomson 2010), though values are lower in the Qinghai-Tibet Plateau (Ouyang et al. 2015) and higher in the Intensive Forestry Biome (IFB) at the Biosphere 2 Center located in Oracle, AZ, USA (Murthy et al. 2003). Finally, a distinction between heterotrophic respiration (RH) and autotrophic respiration (RA) can be made using mainly isotopic and root cutting methods (Moinet et al. 2016;Cheng and Zhang 2003; Yi et al. 2007; Andrews et al.1999, 2000; Hanson et al. 2000). In conclusion, soil respiration and its material sources include biological processes and nonbiological processes. The former mainly include plant root respiration, soil microbial respiration, and soil animal respiration, and the latter are chemical processes(such as dissolution and precipitation) and physical processes (such as ventilation and diffusion). These various processes suggest that the impacts of these factors on soil respiration and its value may vary across different ecosystems.
Previous studies employing corrosion testing and/or chemical water runoff methods have revealed that the karst carbon sink is up to hundreds of millions of tons of carbon per year (tC yr-1) (Liu 2000; Liu and Zhao 2000; Gombert 2002), which is an important and non-negligible part of the‘‘missing carbon sink’’ (Zhou et al. 2015; He et al. 2019).In the karst area of China, karst carbon flux is 10 million tC yr-1(Jiang et al. 2011, 2012) to 18 million tC yr-1(Liu and Zhao 2000), in which the bare area accounts for 4.8 million tC yr-1(Jiang and Yuan 1999; Liu and Zhao 2000)to 7.4 million tC yr-1(Qiu et al. 2004). The main contribution area to the carbon sink is centered on Guizhou (Liu and Zhao 2000; Qiu et al. 2004; Jiang et al. 2011, 2012). In past decades, agricultural activity in this area was very strong. However, with the development of China’s industry and society, much-cultivated land has been abandoned in China (Tu et al. 2018), and most of these areas are recovering naturally. This land could absorb and immobilize considerable atmospheric CO2through vegetation photosynthesis, making it an important carbon accumulator in the soil carbon pool.
Soil respiration monitoring in the karst area has been conducted for many years and considerable research progress has been made. Researchers have monitored soil respiration mainly using static closed chambers (Eko Haryono et al. 2016), such as EGM-4 (Kobler et al. 2015)and LI-6400 (Eler et al. 2013), and other methods or equipment. These are short-term, noncontinuous methods to monitor soil temperature and soil moisture simultaneously. Soil respiration in the karst area has been found to have obvious characteristics: compared with soil respiration in non-karst areas under similar climate and vegetation, the value in the karst area is lower (Yang et al. 2015)or higher (Liu et al. 2009; Ding et al. 2010; Wu et al.2013), the Q10value is higher (Luo and Zhou 2006; Ding et al. 2010; Wu et al. 2013; Tang et al. 2016), and the stable carbon isotope has a higher mass (Yang et al. 2015).However, long-term and continuous automatic monitoring has not been reported, and such measurements are very important for estimating accurately soil respiration in these fragile, changeable, and sensitive karst areas.
In this study, more than two years of soil respiration measurements are reported for a typical karst abandoned land area in Guizhou, southwest China. The main objectives of this study are to provide support for accurate estimation of carbon sequestration potential in the karst area through systemically monitoring and statistically analyzing spatiotemporal variations of soil respiration.
2 Materials and methods
2.1 Monitoring site
The study area (26°22′05′′N, 105°45′08′′E, 1170 m) is located in Shawan, Longga village, which is 5 km north of Puding City in central Guizhou province, southwestern China (Fig. 1). This region has a subtropical monsoonal climate with an average annual precipitation of 1378 mm,which mainly occurs between April and September. Its air temperature ranges from - 1 to 28 °C, with an annual average of 15.1 °C. The highest monthly temperature occurs in July and the lowest is in January. The annual average sunshine duration is 1165 h; the frost-free period lasts for 301 days.
The dominant lithology in the study area is the pure,thick limestone of the Guanling Formation of the Middle Triassic (T2g). The limestone has a dip angle of <10°. The black limestone soil (rendzina, in FAO and China’s soil taxonomy classifications) is shallow (20-50 cm) and discontinuous with high heterogeneity. The soil has a clay content of 24 %-32.5 % and a bulk density of 1.13 g cm-3(Peng and Wang 2012). Vegetation in the area has been naturally recovering since 2010 (Fig. 2a) when maize was one of the main crops; current vegetation consists of shrubs and grass with a small number of trees (Fig. 2b). Rain and heat are contemporaneous (Fig. 3).

Fig. 1 Geographic sketch map of the study area
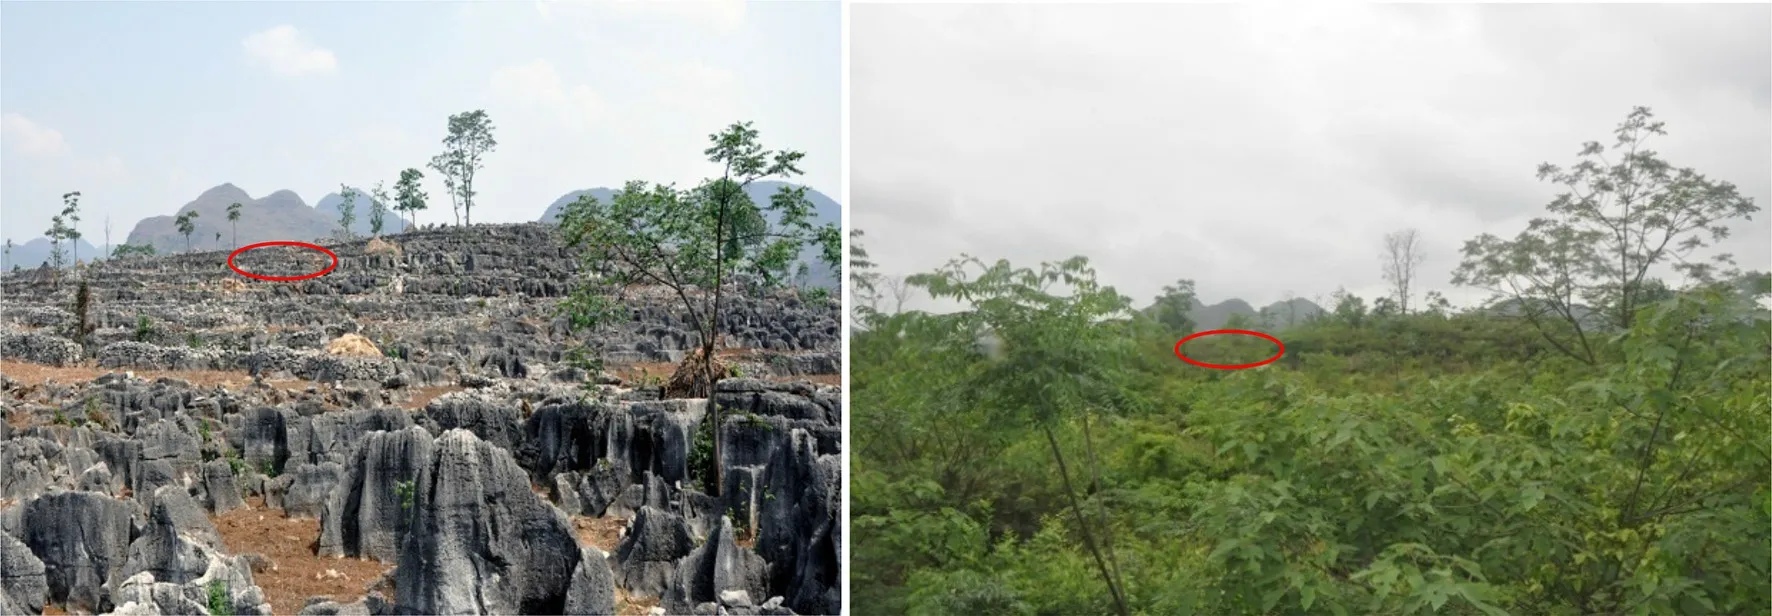
Fig. 2 Photographs of the monitoring site taken in a April, 2010, and b April, 2016. The red ellipse represents the monitored area (see Fig. 4)
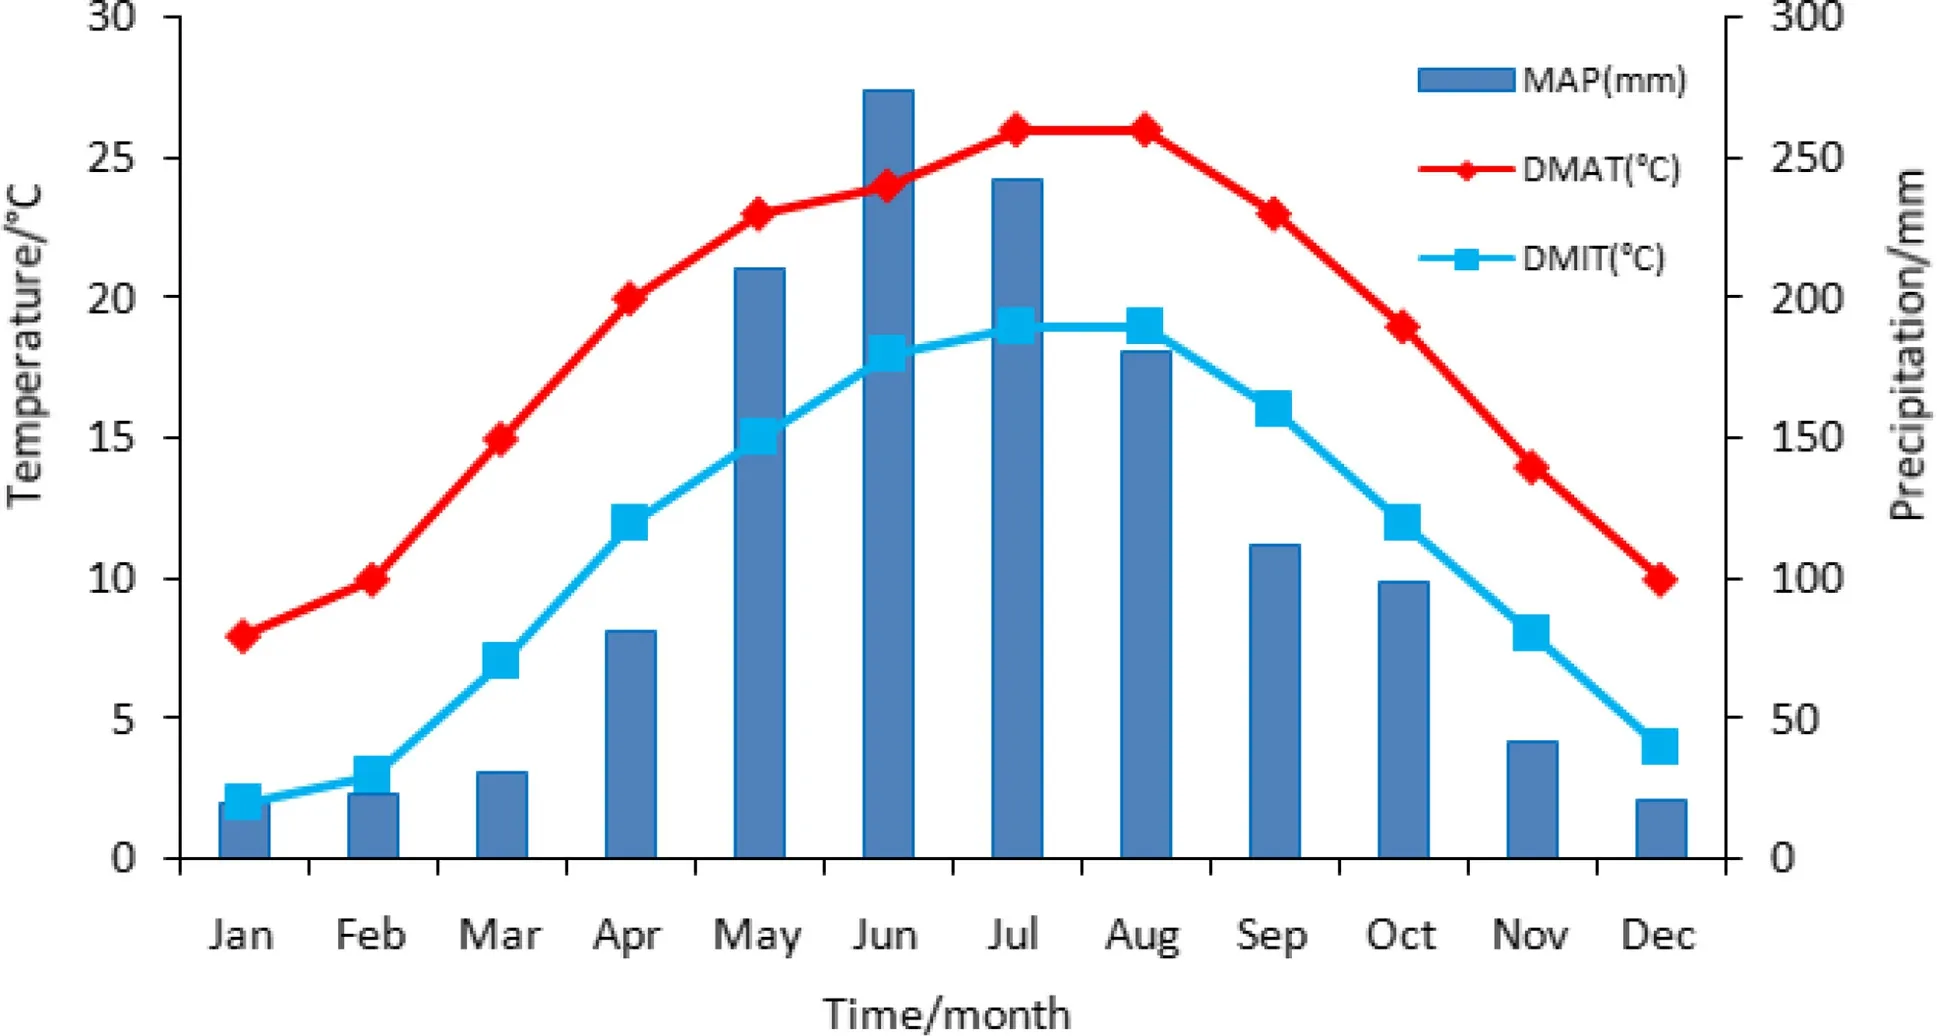
Fig. 3 Annual average temperature and precipitation in the study area. (MAP: monthly average precipitation; DMAT: daily maximum temperature; DMIT: daily minimum temperature) (Data are from a local weather station)
2.2 Monitoring methods
To monitor soil CO2flux at different positions for minimizing the impact of soil heterogeneity, an eight-chamber multiplexed automated soil gas flux system (LI-8150,LiCor, USA) was installed on the abandoned land. This system permanently monitored the soil CO2flux, soil temperature, and water content of 5 cm deep soil below the surface from March 13, 2015, to May 2, 2016, for all eight positions, and from March 13, 2015, to July 29, 2017, for three positions (sites #2, #5, and #8). The system has the following features for measuring CO2: a range of 0-20,000 μmol/mol, an accuracy of 1.5 %, and an RMS noise of <1 ppm at 370 ppm with 1-s signal averaging.Soil temperature and soil moisture measurements were accurate to ± 1.0 °C and ± 1 %, respectively.
At the same time, a sample plot of the monitoring area was investigated in August 21, 2015, and the aboveground biomass was measured by the harvest method. Surface soil samples (0-20 cm or from the interface between soil and bedrock when the soil depth was <20 cm) near the eight soil respiration monitoring sites and a soil sample from a soil profile (from the surface to the interface between soil and bedrock) in this area were sampled in 2016. Their N,C, H and S elements were analyzed by an elemental analyzer, with analytical errors of <0.5 %.
3 Results
3.1 Canopy cover and soil attributes
In the monitoring area, the vegetation consists of shrubs and grass. The community coverage is >85 %, and the vegetation height is ~1.8 m (Fig. 4). Shrubs includeRubus coreanus Miq.,Catalpa ovata G. Don(seedlings),Rhus chinensis Mill.,Broussonetia papyrifera Linn.,Rubus parvifolius Linn., andCeltis sinensis Pers.(seedlings) and herbs mainly includeArtemisia dubia Wall. ex Bess.,Picris hieracioides Linn.,Bidens pilosa Linn.,Erigeron annuus(Linn.) Pers.,Glechoma longituba (Nakai) Kupr.,Sedum sarmentosum Bunge,Elsholtzia rugulosa Hemsl.,Carpesium cernuum Linn.,Setaria viridis (Linn.) Beauv.,Senecio scandens Buch.-Ham. ex D. Don,Imperata cylindrica(Linn.) Beauv., andEupatorium adenophora Spreng. At present, the aboveground biomass is ~5.38 t ha-1, but the biomass will continue to increase with vegetation restoration (Liu et al. 2016). For example, survey data from a fenced monitoring plot show that the aboveground biomass of the tree and shrub layers increased to 8.90 and 0.53 t ha-1, respectively, from 2015 to 2016 (unpublished data from Y.C. Zhou); i.e., the annual growth rate of biomass in study area is ~11 to 15 %.
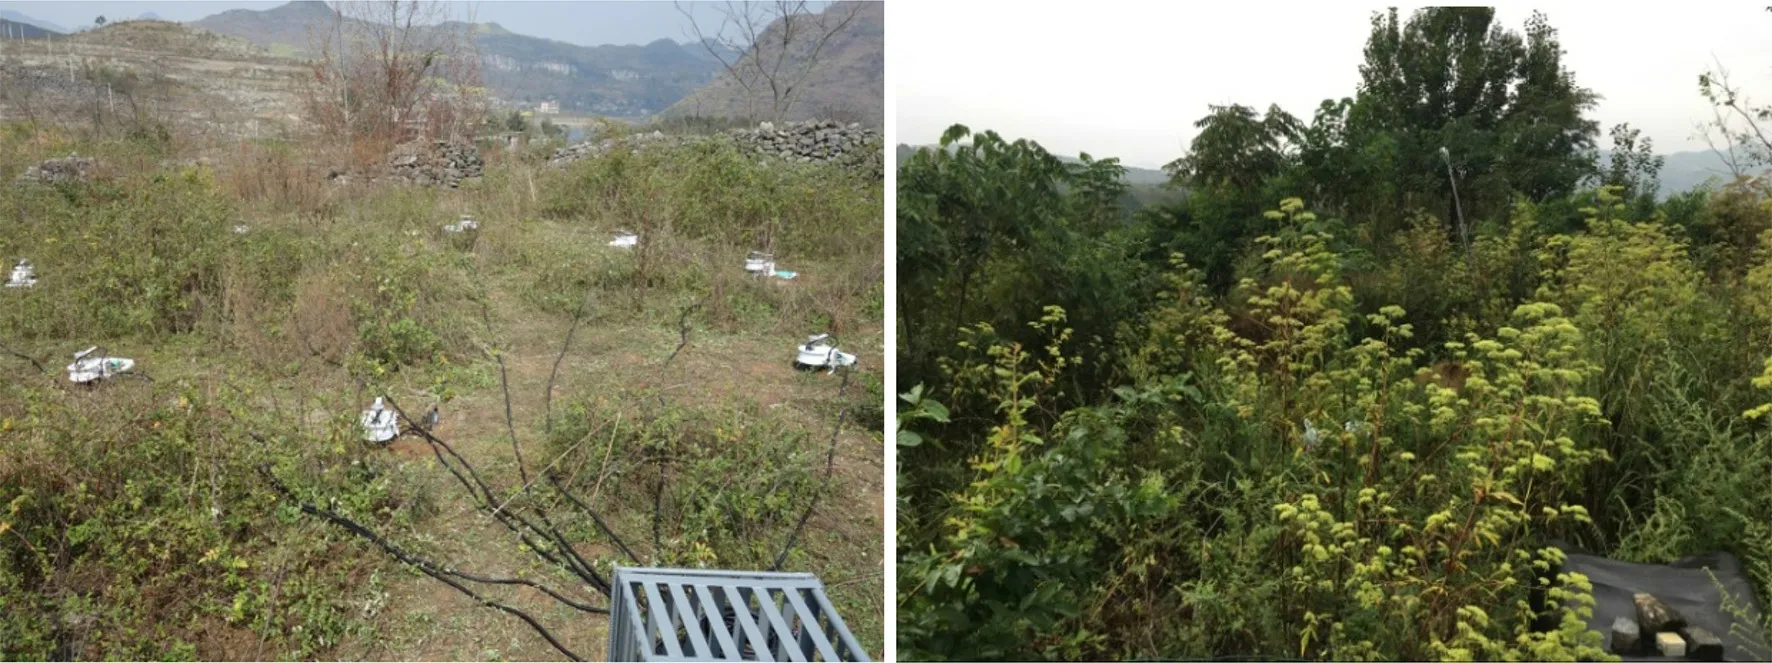
Fig. 4 Photographs of monitoring eight chambers in March, 2015 (left), and October, 2017 (right)
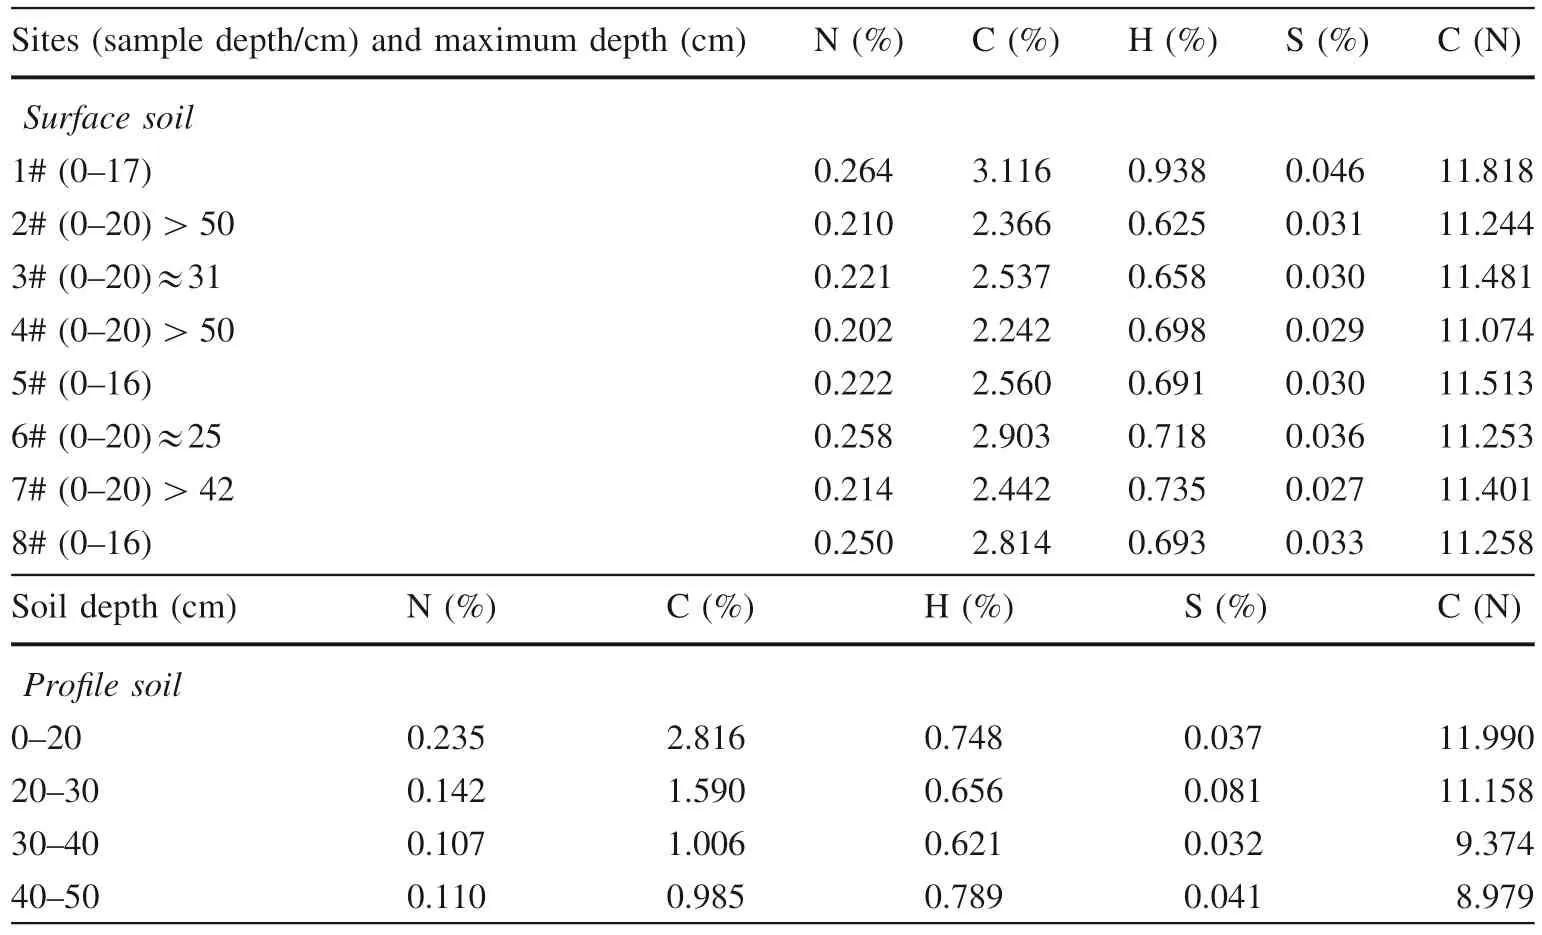
Table 1 Element contents ofeight surface soils near the eight monitoring soil respiration sites and a profile soil inside the monitoring area
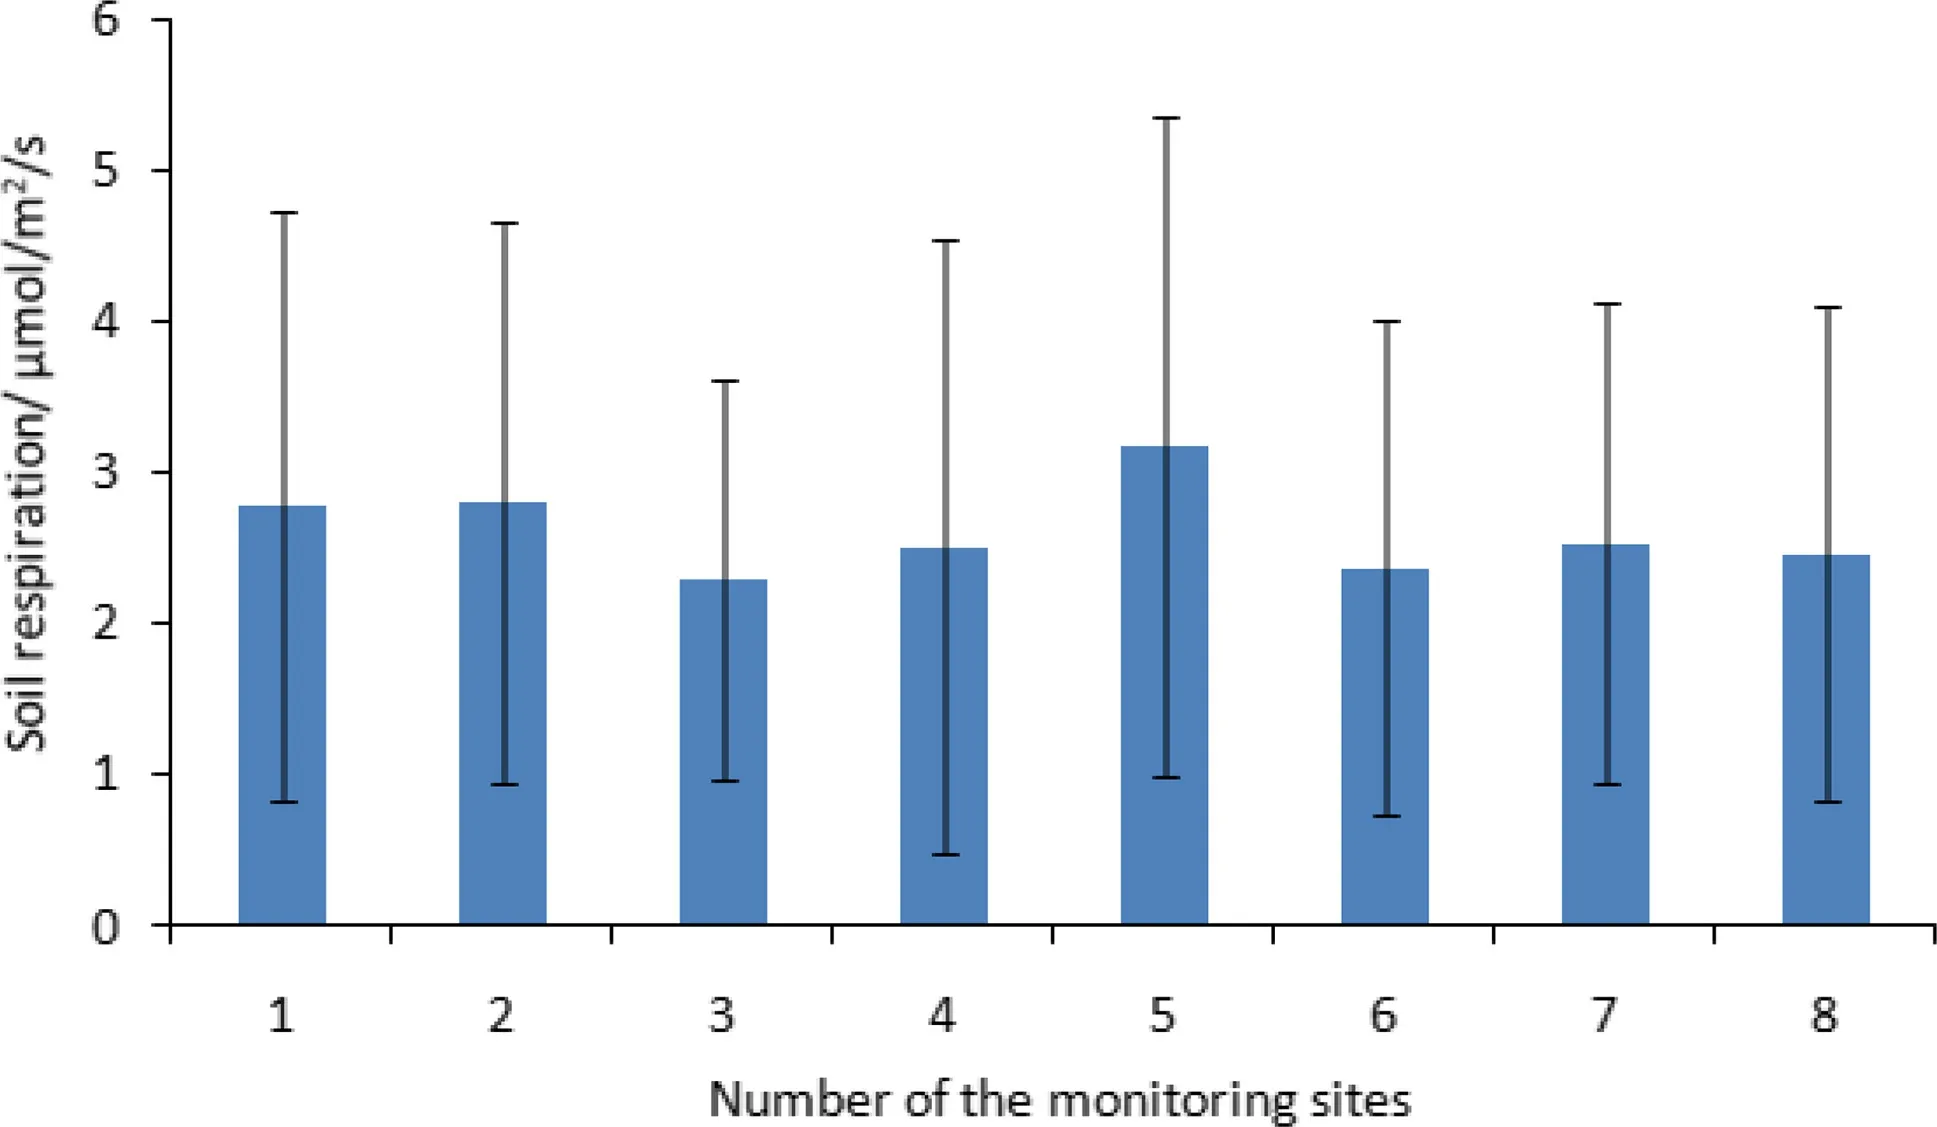
Fig. 5 Average values and standard deviations of soil respiration at the eight monitoring sites
Of the eight surface soils (~20 cm or up to the bottom when the soil depth was <20 cm), element contents and C/N ratios were higher at site #1 and slightly lower at site#4. Nitrogen and carbon contents and C/N ratios of these surface soils decrease notably with the increase in soil depth among these eight sites. At the same time, in the soil profile, N, C, and C/N also decrease with the increase in soil depth (Table 1). These results are similar to those from previous studies in this region (Yang et al. 2008; Zhang et al. 2017).
3.2 Spatiotemporal variability of soil respiration
Soil respiration data from the eight monitoring sites from more than two y ears exhibit a range between 0.02 and 14.68 μmol m-2s-1, with theaverage values being between 2.31 and 3.18 μmol m-2s-1. The average value of all soil respiration data from March13, 2015, to March 12, 2017, is 2.63 ± 1.89 μmol m-2s-1, which is significantly higher than that of the non-karst area under similar conditions (e.g., Do¨rr and Mu¨nnich 1987; Yan et al. 2006;Luo and Zhou 2006) and the global value (98 ± 12 Pg of C in 2008, i.e., ~1.74 μmol m-2s-1) (Bond-Lamberty and Thomson 2010). However, the higher soil respiration value does not represent the regional average value in the karst area, where there is considerable rock fragment coverage(Fig. 2). Given that ~50 % of the rock is exposed in the monitoring area (unpublished data from Xing et al.) and is ~43.34 % in the Houzhai catchment near this study area (Zhang et al. 2018) (Fig. 1), the regional average soil respiration value should be ~1.32 μmol m-2s-1, which is a lower value than the other values mentioned above for the non-karst area under similar conditions.
Among the eight monitoring sites, the average value at site #5 is highest, sites #1 and #2 follow, sites #3 and #6 have slightly lower values, and sites #4, #7, and #8 have slightly higher values (Fig. 5). These data also show that the average value (2.65 ± 1.95 μmol m-2s-1) of all soil respiration is very close to the average value(2.75 ± 2.14 μmol m-2s-1) at sites #2, #5, and #8 from March 13, 2015, to March 12, 2016, which suggests that it is feasible to use the average value of three points (#2, #5,and #8) instead of all eight points.
However, nearly the same soil respiration variations with time are observed at all eight sites, which suggests that the soil respiration data from any monitoring site is a feasible choice. On the seasonal scale, soil respiration is higher in the summer season (rainy season) and lower in the winter season (dry season) (Figs. 6 and 7). From April 1, 2015, to March 31, 2016, the average values of soil respiration from the eight sites are 3.88 μmol m-2s-1in the rainy season (April to September) and 1.46 μmol m-2s-1in the dry season (October to the following March). On the hourly scale, for both the rainy and dry seasons, higher soil respiration at all monitoring sites occurs in the afternoon and lower values occur in the morning (Fig. 6). Analyzing soil respiration data at any time period gives the following approximate rule: The soil respiration value at 11 am every day is very close to the daily average value (Figs. 7 and 8).
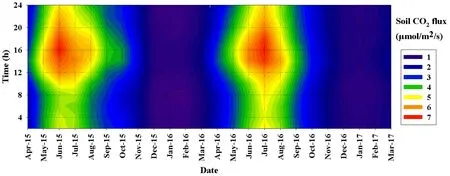
Fig. 6 Temporal (hourly and annual) variation of soil respiration at site #8
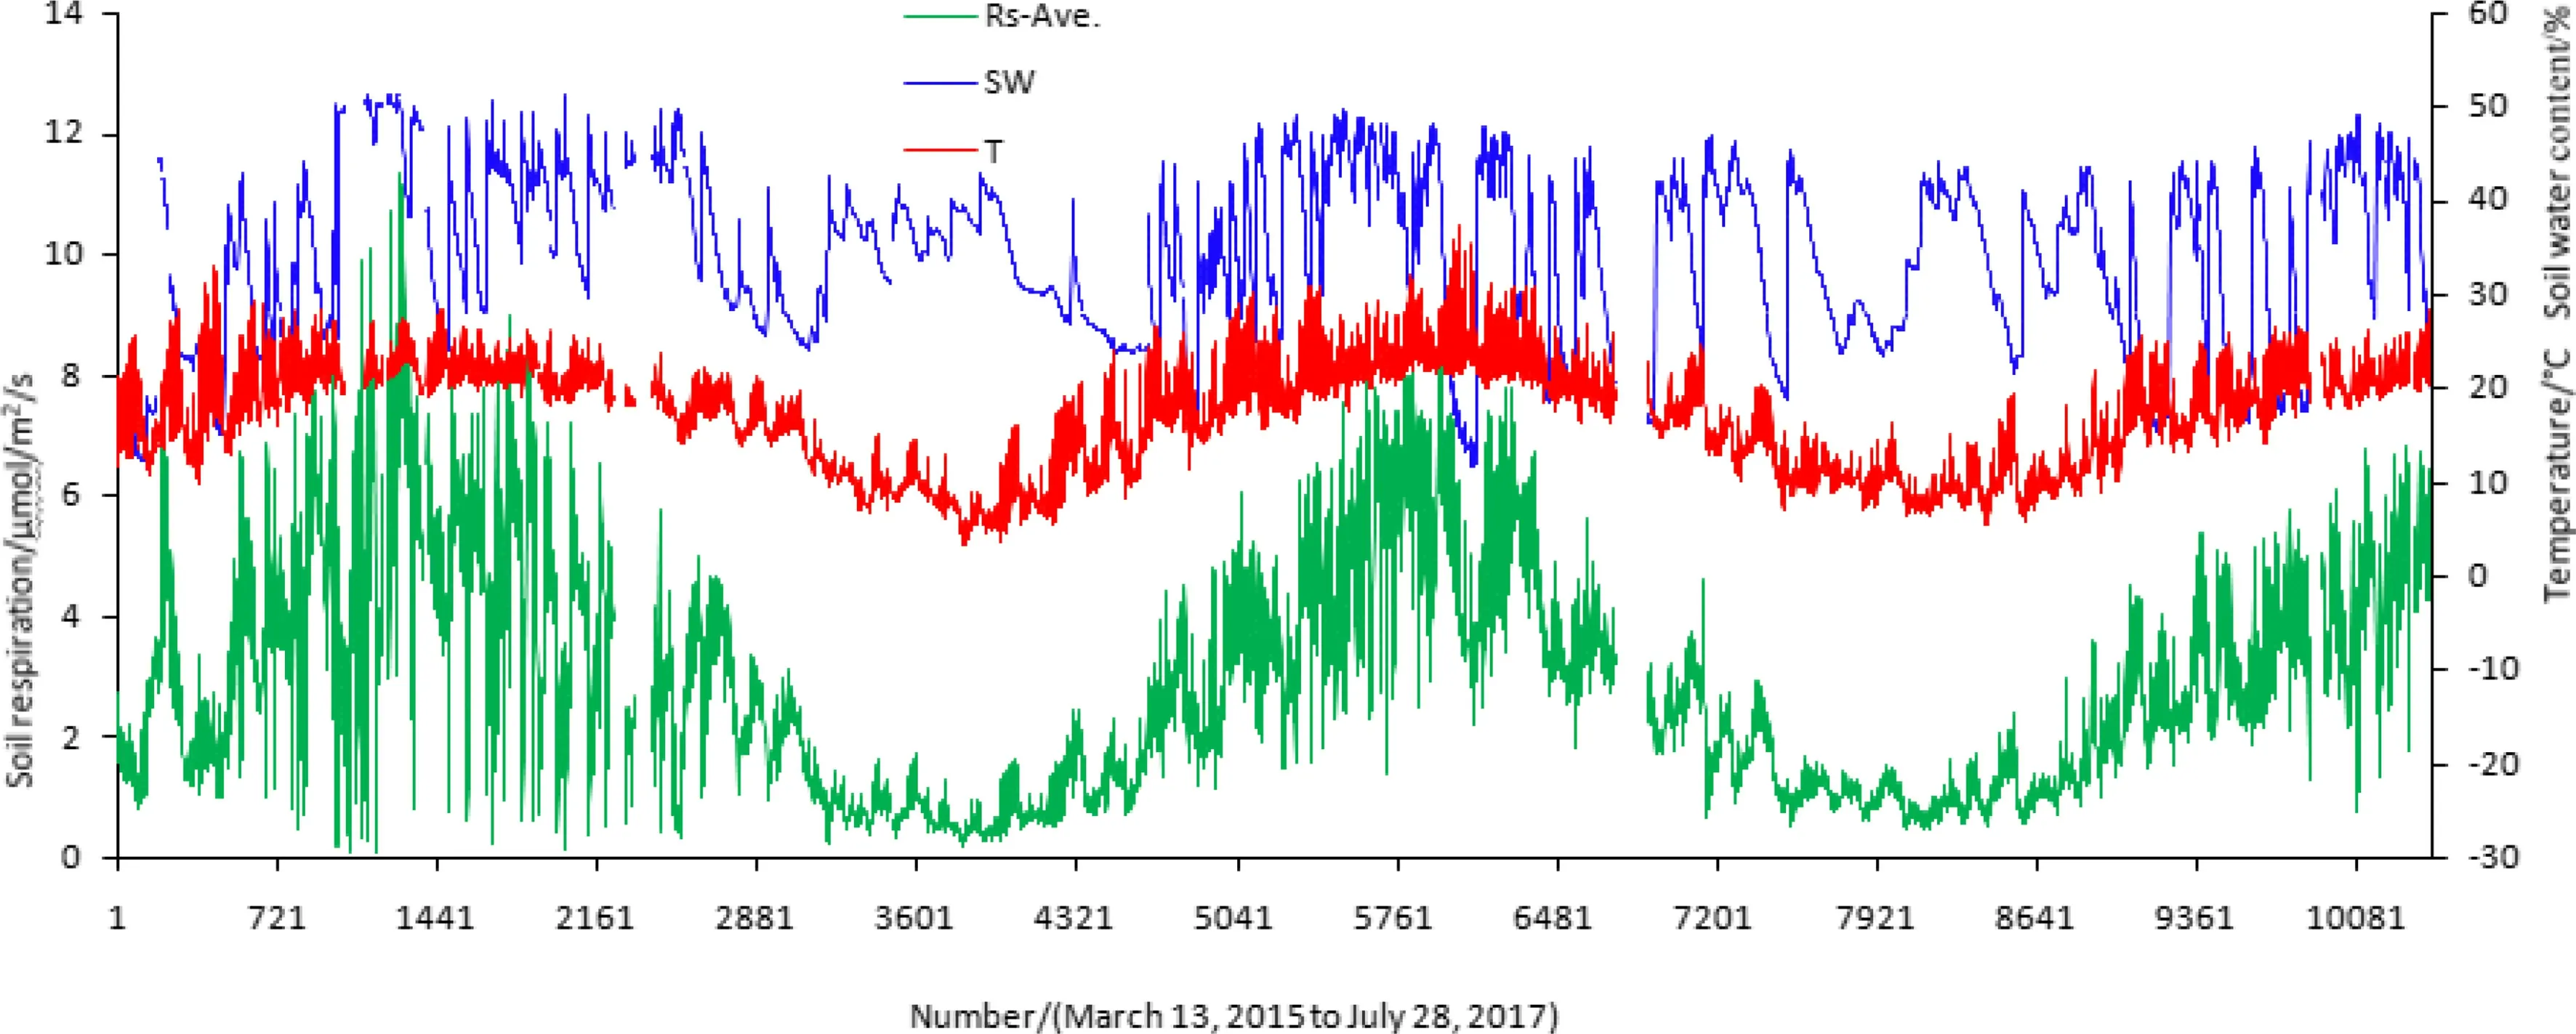
Fig. 7 Relationships among soil respiration (Rs-ave.: average values of sites #2, #5, and #8), soil moisture (SM), and temperature (T) under the 5 cm soil layer

Fig. 8 Average daily variation of soil respiration from site #5
On the annual scale, the average values of soil respiration for sites #2, #5, and #8 are 2.75 ± 2.14 μmol m-2s-1from March 13, 2015, to March 12, 2016, and 2.76 ± 1.87 μmol m-2s-1from March 13, 2016, to March 12, 2017, suggesting that interannual changes are minor. However, there are slight decreases at most monitoring sites during the corresponding period except for site#8 (Table 2). This may suggest that some carbon is being fixed in the soil during the preliminary stage of the rapid restoration of the vegetation (Fig. 4). The reason for the increase with time of soil respiration at site #8 needs to be further studied.
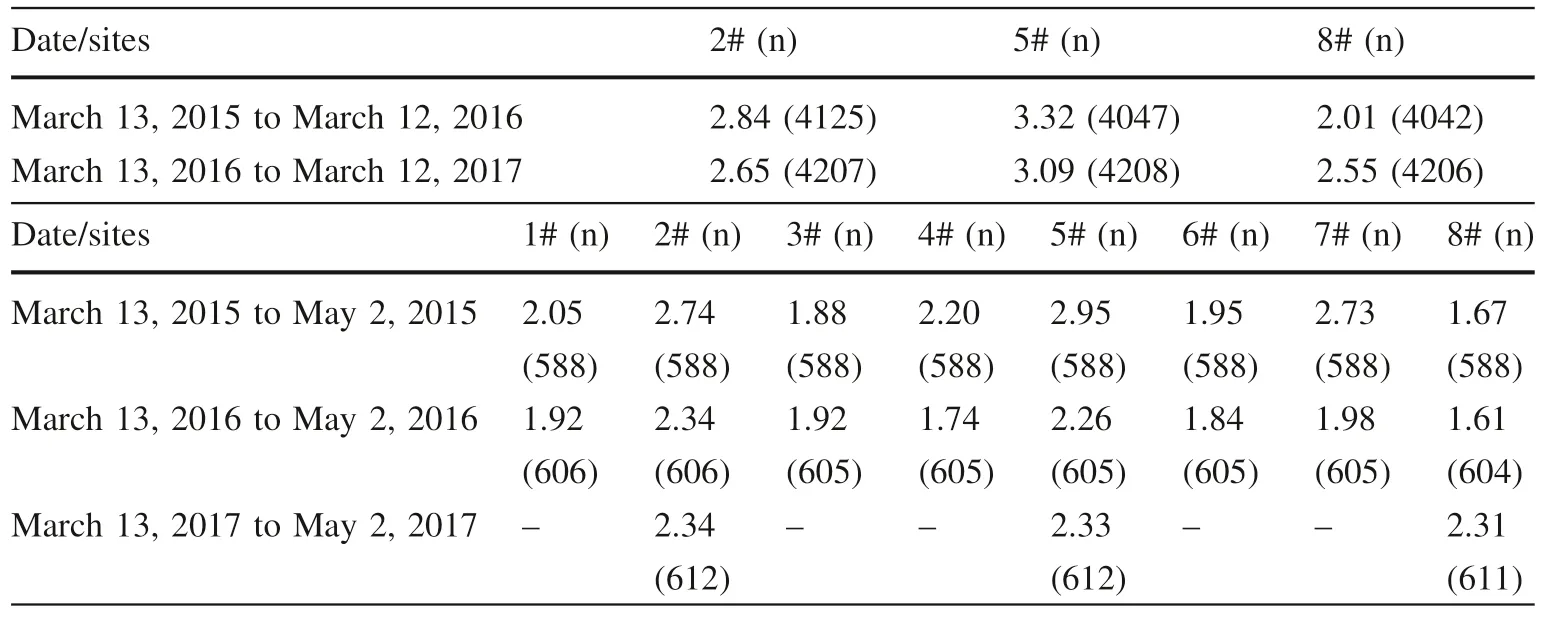
Table 2 Interannual changes of soil respiration
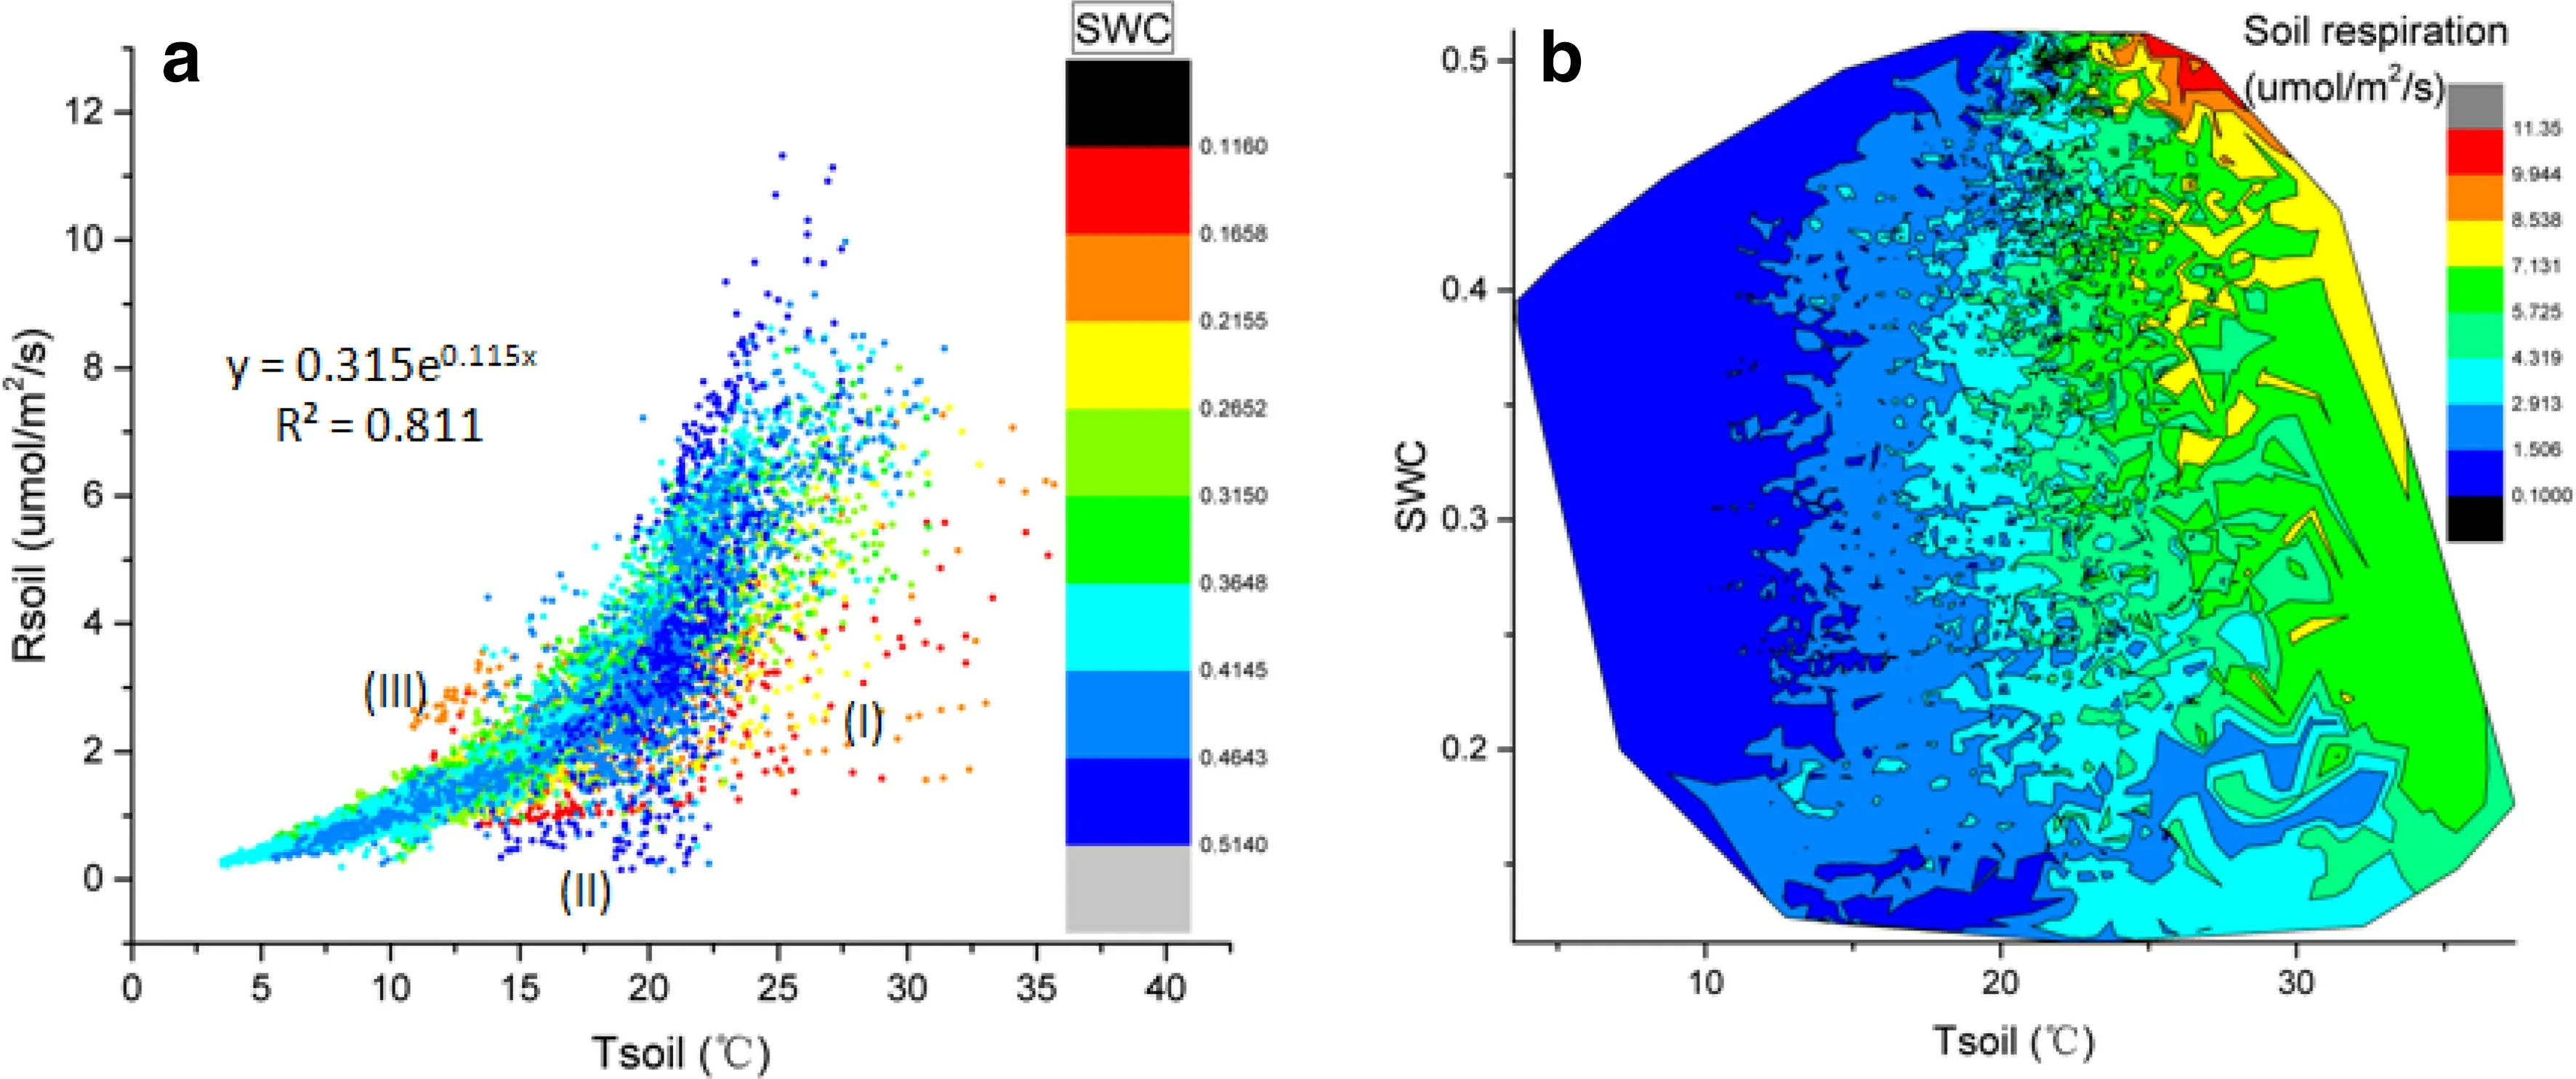
Fig. 9 Relationships between soil respiration and 5 cm soil temperature (a) and 5 cm soil water content (b) from average values of sites #2, #5,and #8. (The extreme environment leads to relatively low soil respiration, such as (I) the limit of higher temperature and lower humidity, (II) the limit of high humidity (close to saturation at the preliminary stage of rainfall), and (III) small precipitation events after extreme drought)
3.3 Relationships between soil CO2 flux and potential control factors
Soil respiration flux has an obvious seasonal variation,which is basically consistent with the trend in soil temperature at a depth of 5 cm. However, its relationship with soil moisture at a depth of 5 cm is very complex, demonstrating a different correlation at different time scales(Fig. 7). Soil respiration has a significant exponential correlation with soil temperature at a depth of 5 cm, but soil respiration is abnormally very low (Fig. 9a) under extreme weather conditions (e.g., under higher temperature and lower humidity, such as during April 15-19, 2015; during initial rainfall when humidity is close to saturation, such as June 18 and August 28, 2015; and after extreme drought,such as at the end of March 2015). Under sunny weather lasting for many days, soil respiration has a significantly positive relationship with humidity. At the beginning of rainfall, soil respiration almost ceases, then increases rapidly. On the hourly scale, variation of soil respiration is almost simultaneous with soil temperature but unrelated to soil moisture (Fig. 9b), which differs from what is observed on the global scale (Raich and Potter 1995). This may be because the study area belongs to the subtropical humid zone. However, soil respirations do not correlate with soil carbon pools, soil nitrogen pools, or soil C/N ratios (Table 1), which may be related to the smaller changes of carbon and nitrogen concentrations in the study area.
4 Discussion
4.1 Effects of soil temperature and moisture on soil respiration (CO2)
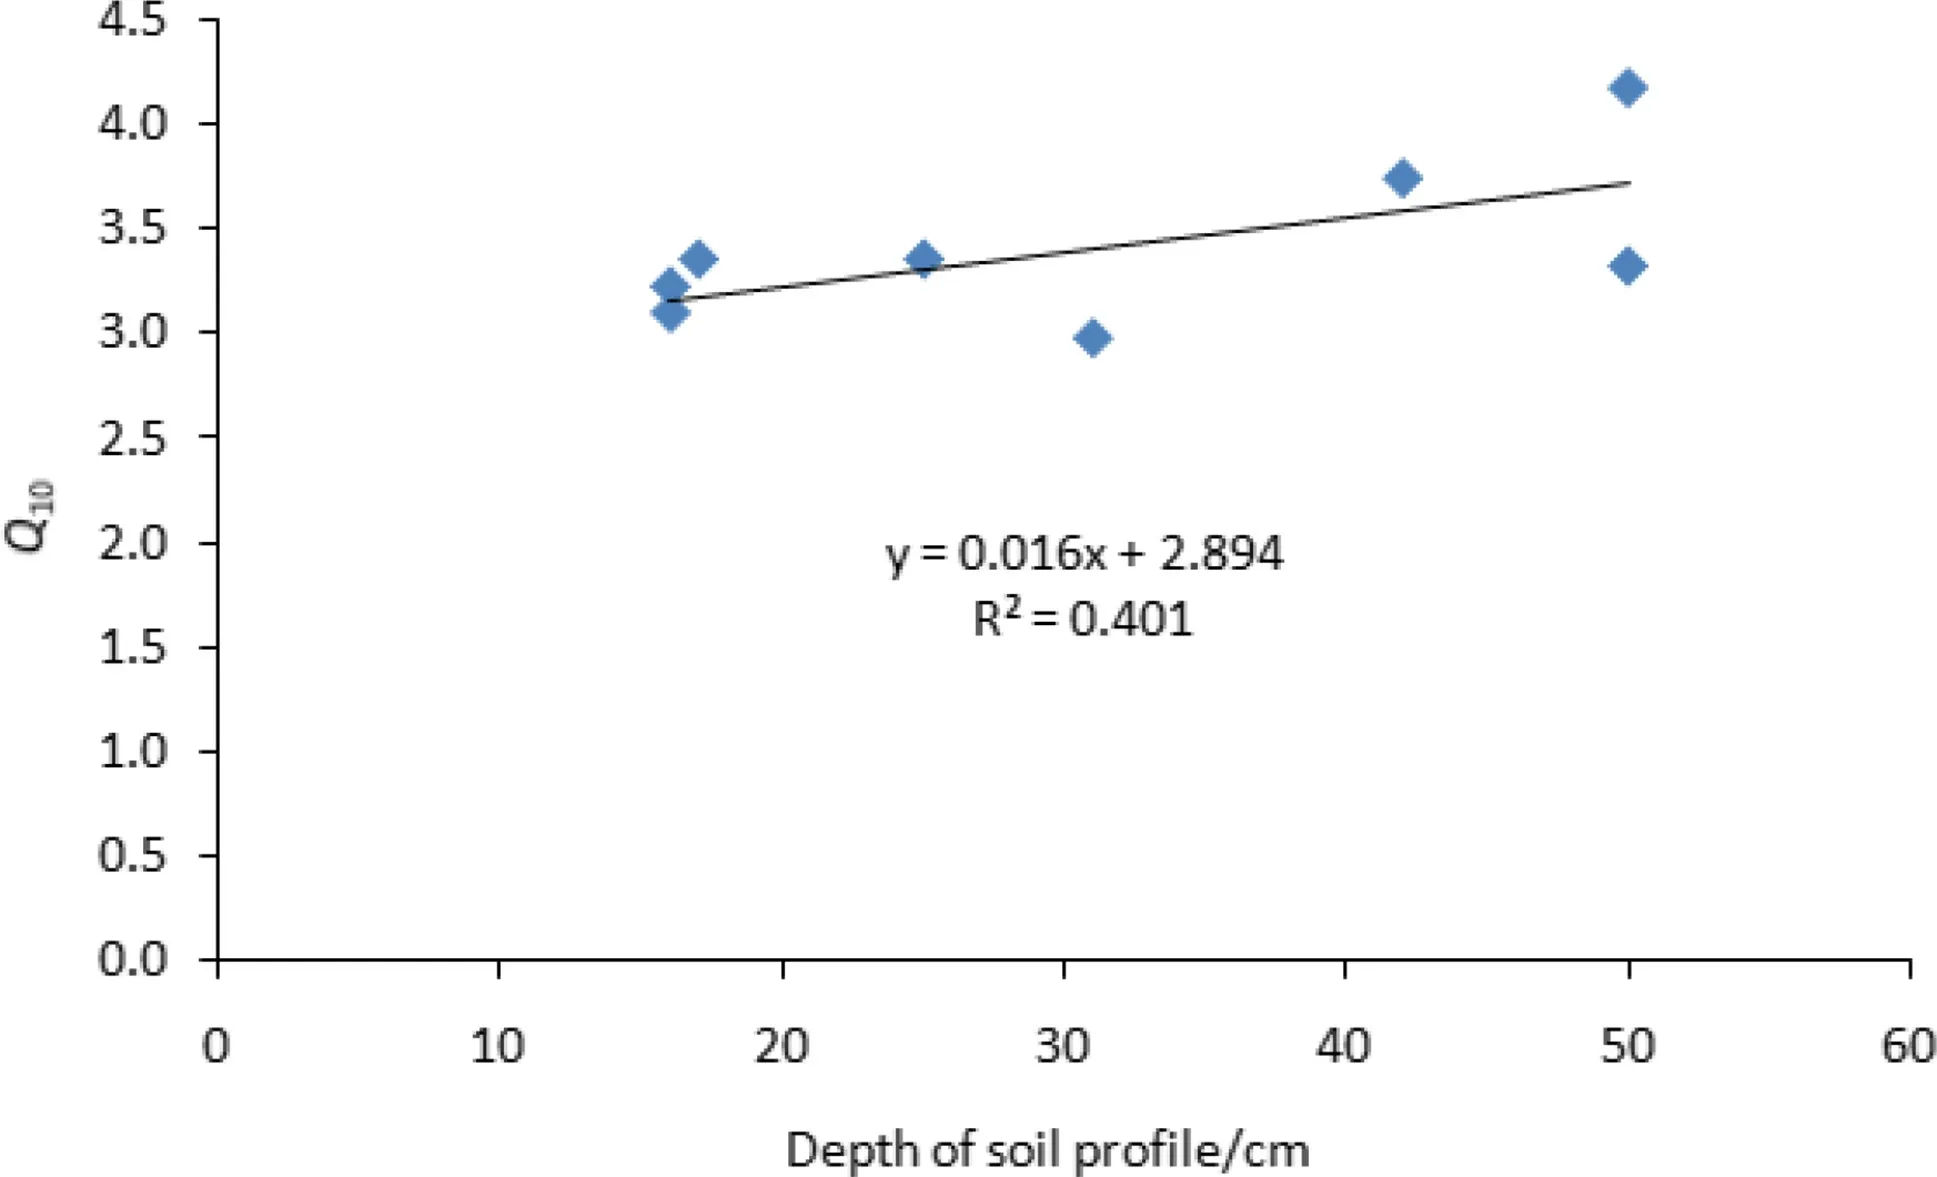
Fig. 10 Relationship between soil depth and Q10 among the eight monitoring sites
Soil respiration is affected by many factors, including the soil microenvironment (such as soil temperature and soil moisture), soil organic matter from plant litter, and root respiration (Fang and Moncrieff 1999). However, air temperature or soil temperature and rainfall or soil moisture are the most important and common factors (e.g.,Gomes et al. 2016; Zhang et al. 2013; Chang et al. 2009;Cook and Orchard 2008; Yan et al. 2006; Andrews et al.2000). Almost all the research shows that soil respiration has a significant exponential relationship with soil temperature. However, the relationships with soil moisture are found to be different among different research groups.Various efforts have yielded a negative correlation (Gomes et al. 2016), a positive correlation (Chang et al. 2009), a linear correlation (Moinet et al. 2016; Cook and Orchard 2008), and a complete reverse correlation in different soil moisture ranges (Luo and Zhou 2006), and there is some evidence that soil moisture may not even be one of the main influencing factors (Jassal et al. 2004).
4.1.1 Soil temperature
In the study of soil respiration, in addition, the exponential relationship between soil temperature and soil respiration,the temperature coefficientQ10is an important parameter.The value ofQ10that denotes a change in the rate of a reaction with a 10 °C increase can be calculated using the equation (Salisbury and Ross 1985)

wherek1is the CO2efflux rate at the lower measurement temperatureT1andk2is the CO2efflux rate at the higher measurement temperatureT2(Murthy et al. 2003).
In our study area,Q10falls between 2.97 and 4.18, with an average of 3.41 ± 0.39, which is close to the previous research result in the karst area (Wu et al. 2015), but it is higher than that in the non-karst area (Luo and Zhou 2006).This indicates that the soil respiration in the karst area is more sensitive to temperature. Moreover, with the increase of soil depth at any point, the value ofQ10increases(Fig. 10), which demonstrates that, in the karst area, soil respiration is more sensitive to temperature when the soil is deeper. This is opposite to the trends in nitrogen and carbon contents and C/N ratios (Table 1) of these surface soils,all of which exhibit obvious decreasing trends with the increase of soil depth among these eight monitoring sites.This difference may be because, in the deeper soil profile,surface soil (20 cm) has a relatively high resistant soil organic matter (SOM) content, and theQ10value of resistant soil OM pools is greater than that for labile soil OM (Conant et al. 2008). Of course, the difference might also be related to the deeper soil profile, in which the relative contribution of autotrophic respiration to soil respiration is larger than that of heterotrophic respiration because theQ10value of autotrophic respiration is significantly greater than that of heterotrophic respiration (Zhang et al. 2013).
4.1.2 Soil moisture
As mentioned above, the effect of soil moisture on soil respiration is a very complicated process. The main weather processes in the study area since 2011 are precipitation (rain and snow), accounting for ~57.6 % of the time, and non-precipitation conditions (cloudy 30.1 %,overcast 10.7 %, and sun 1.6 %), accounting for 42.4 %,respectively (as determined from local weather station data). However, the precipitation pattern exhibits significant variability, with short periods of heavy rains or showers and long periods of light or continuous rain.Therefore, the relationships between soil respiration and soil moisture can be summarized as follows: (1) On the annual and seasonal scales, no obvious relationship between soil respiration and soil moisture exists (Figs. 7 and 9b). (2) On the hourly scale, no obvious relationship between soil respiration and soil moisture exists (Fig. 11b).(3) During a large precipitation event, soil respiration decreases dramatically, then slowly recovers to normal range, even after a certain period (which may depend on many factors, such as soil properties, temperature, and rainfall patterns), until reaching a higher value (Fig. 11a).(4) There is a positive correlation between soil respiration and soil moisture when there is a low rate of rainfall but for an extended period (Fig. 11c). (5) Under sunny, cloudy or overcast conditions, soil respiration exhibits an almost synchronous trend with that of soil moisture (Fig. 11d).Previous research has revealed that from 1963 to 2011 in Guizhou, the total numbers of rainy days, light rainy days,moderate rainy days, and heavy rainy days have all decreased, but the number of storm rainy days have increased slightly (Wang et al. 2015). The frequency of extreme weather events has increased as a result of global climate change; this may reduce the emission flux of soil,but soil temperature synchronously rises (as a result of global warming), which will cause more CO2emission(Fig. 9a). Therefore, the effect of rain or soil moisture on soil respiration is a very complex process, which is related to weather.

Fig. 11 Relationships between soil respiration and environmental parameters (precipitation, 5 cm soil moisture, and soil temperature)
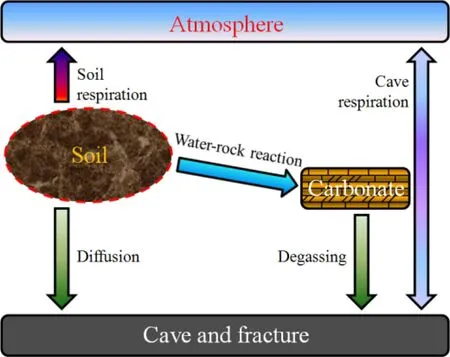
Fig. 12 Conceptual model of soil air CO2 emissions in the KCZ. The water-rock reaction and degassing are positive and negati ve reactions of CO2 + H2O + M(Ca or CaMg)CO3 ⇋M2++ 2HCO-3 ,respectively.
4.2 Effects of soil organic carbon and nitrogen on soil respiration (CO2)
There are slightly different soil organic carbon and nitrogen contents among the samples from the eight sites(Table 1), but no obvious correlations with soil respiration could be discerned. The values and variation trends of both soil temperature and soil moisture at 5 cm soil depth among the eight sites are almost the same, respectively. Of course, it is probable that the differences in soil respiration among the eight sites could be attributable to differences in the distribution of vegetation (Fang and Moncrieff 1999);however, such vegetation differences are also not obvious among the eight sites (Fig. 4a). Therefore, there must be other factors at play.
4.3 Effects of caving or fracturing and water-rock reaction on soil respiration (CO2)
In the Karst Critical Zone (KCZ), there are numerous carbonate rocks distributed around and below the soil and even within the soil. Caves and rock fractures are developed, providing processes for soil carbon cycling that differfrom those in non-karst areas (Fig. 12). These processes include not only soil respiration but also the diffusion of soil air CO2to underground caves or fissures (Kowalczk and Froelich 2010) and water-rock reactions between seepage water containing large amounts of CO2and carbonate rock (Liu and Zhao 2000; Zou et al. 2019). The former is similar to soil respiration, and the CO2diffused into caves or fissures will be discharged into the atmosphere under certain conditions, while the latter will consume and absorb CO2by carbonate rock dissolution at the soil-rock interface in the karst area (Yang et al. 2015). The total worldwide consumed carbon mass is ~0.3 GtC/yr(Gombert 2002) to 0.5 PgC/yr (Liu et al. 2018). Therefore,it is likely that the obvious differences in soil respiration values among the eight monitoring sites in this study are affected by different diffusion or water-rock reaction processes, which are due to different soil depths (Table 1)and connectivity between soil and caves or fractures.Obviously, these two processes may also be important reasons for the lower regional average soil respiration value (~1.32 μmol m-2s-1) than that of the non-karst area under similar conditions.

Table 3 Interannual variations of soil respiration and its major factors
4.4 Estimation of potential carbon sink
The annual average value of soil respiration increased by 0.01 μmol m-2s-1from 2015-2016 to 2016-2017 (from March 13, 2015, to March 12, 2016, March 13, 2016, and March 12, 2017). The increases value of soil respiration is lower than the ~0.07 μmol m-2s-1caused by soil temperature according to the relationship(Rs = 0.314e0.115T) between soil respiration and soil temperature in Fig. 9a and Table 3; that is, soil respiration decreased by 0.06 μmol m-2s-1from 2015-2016 to 2016-2017 if the effect of temperature is excluded. Similarly, given that ~50 % of the rock is exposed in the monitoring area (unpublished data from Xing et al.), the regional difference is 0.03 μmol m-2s-1. Although there is no significant correlation between soil respiration and soil moisture in the study area, soil moisture decreases 0.48 % from 2015-2016 to 2016-2017, which suggests that the karst carbon sink in 2015-2016 is slightly greater than that in 2016-2017 (Yan et al. 2006). Therefore, the difference (0.03 μmol m-2s-1, i.e., 11.35 tC/km2/yr) in soil respiration from 2015-2016 to 2016-2017 may be attributed mainly to diffusion of CO2to caves or fractures under the vegetation restoration (Figs. 4 and 12 and Table 3), which needs to be confirmed by further research,such as carbon cycle monitoring of cave systems and carbonate rock tablet testing.
5 Conclusions
We have drawn the following conclusions from our study:(1) Soil respiration exhibits an obvious spatiotemporal variation that was likely affected by different diffusion or water-rock reaction processes, and the flux is higher in the karst area than in the non-karst area under similar conditions, but the regional value is lower. (2) There is a significant exponential relationship between soil respiration and soil temperature, but the relationship between soil respiration and soil moisture is very complex, exhibiting an inconsistent or even contradictory relationship under different weather processes and conditions or time scales. (3)The soil respiration value at about 11 am each day can better represent the average value of the day, according to statistics and analyzing all of our data. (4) The temperature sensitivity of soil respiration (Q10) in the karst area is significantly higher than that of non-karst areas under similar conditions, which suggests that the response of soil respiration to global change in the karst area perhaps is more obvious. (5) On the annual scale, soil respiration decreased by 0.03 μmol m-2s-1from 2015-2016 to 2016-2017 when excluding the influence of temperature,but water-rock reaction, fracturing, and caving may play an important role.
Acknowledgements This study was supported jointly by the National Key Research and Development Program of China(2016YFC0502300 and 2016YFC0502102), the United Fund of the Karst Science Research Center (No. U1612441), and the National Natural Science Foundation of China (41571130042, 41673121, and 41571130074). We sincerely thank Dr. Libin Liu and Dr. Xuegang Xing for providing investigation data about vegetation and rock fragment coverage, respectively, and especially the anonymous reviewers for their valuable comments and suggestions on this manuscript.
- Acta Geochimica的其它文章
- In-situ formation of perylene in lacustrine sediments and its geochemical significance
- U-Pb dating and geochemistry of granite porphyry dykes in the Xicha gold-(silver) deposit, southern Jilin Province, China,and their metallogenic significance
- Maturity effects on steranes of source rocks in Lishu fault depression, Songliao Basin
- Comparative geochemical study of the cherty rocks of the Taukha terrane (Sikhote-Alin) and its paleogeodynamic significance
- REE geochemistry of core sediments of Cauvery delta, India for provenance studies
- Fluid inclusion and H-O isotope study of the Jiguanshan porphyry Mo deposit, Xilamulun Metallogenic Belt: implications for characteristics and evolution of ore-forming fluids

