Multiphase convolutional dense network for the classification of focal liver lesions on dynamic contrastenhanced computed tomography
Su-E Cao, Lin-Qi Zhang, Si-Chi Kuang, Wen-Qi Shi, Bing Hu, Si-Dong Xie, Yi-Nan Chen, Hui Liu, Si-Min Chen,Ting Jiang, Meng Ye, Han-Xi Zhang, Jin Wang
Abstract
Key words: Deep learning; Convolutional neural networks; Focal liver lesions; Classification; Multiphase computed tomography; Dynamic enhancement pattern
INTRODUCTION
The frequency of detection of focal liver lesions (FLLs) has increased due to the widespread application of imaging techniques[1,2]. Because the treatment of FLLs depends on the nature of the lesion, the ability to accurately distinguish the types of FLLs is an important step in the management of these patients. Currently, dynamic contrast-enhanced computed tomography (DCE-CT) is commonly used for the noninvasive detection and characterization of FLLs due to its high scanning speed and high-density resolution[3,4]. The appearances, especially the dynamic enhancement patterns of FLLs on CT imaging, are essential for categorizing lesions. With the careful evaluation of CT images, diagnosis with a relatively high accuracy can be achieved for most liver lesions. However, in current clinical practice, the evaluation of CT images is mainly performed by radiologists. The results are influenced by the radiologist’s experience and are generally subjective. Radiologists have began investigating the potential of computer-aided diagnostic systems to overcome these limitations. Rather than using qualitative reasoning, artificial intelligence (AI) conducts quantitative assessments by automatically identifying imaging information[5]. Therefore, AI can assist radiologists in making more accurate imaging diagnoses and substantially reduces the radiologists’ workload.

Traditional machine learning algorithms need features to be predefined and require the placement of complexly shaped regions of interest (ROIs) on images[6-8]. The predefined features are applied in various combinations to effectively determine the diagnosis using traditional machine learning algorithms, but the combinations are usually incomprehensive and result in low accuracy. Today, deep learning-based algorithms are widely used due to their automatic feature generation and image classification abilities[9,10]. A convolutional neural network (CNN) is considered the first truly successful deep-learning method based on a multilayer hierarchical network, and shows high performance in the image analysis field[9-11]. CNN has been successfully applied to analyze the medical images of patients with many diseases such as pulmonary tuberculosis, breast cancer, brain tumors, and some hepatic diseases[12-19]. However, few studies have attempted to apply CNN in the differential diagnosis of FLLs, and these studies have limited value. The dynamic enhancement pattern of FLLs is essential for making differential diagnoses and may have a complementary role to CNN in the diagnostic workup of FLLs.
Hence, we developed and evaluated an automated multiphase convolutional dense network (MP-CDN) that uses four channels of input data to classify FLLs on fourphase CT.
MATERIALS AND METHODS
Patients
The retrospective study was reviewed and approved by our institutional review board, and written informed consent was obtained from the patients whose data were analyzed. Two radiologists (Cao SE and Shi WQ, both with 5 years of experience in imaging diagnosis) searched for patients with FLLs in the picture archiving and communication system (PACS). The images of patients who underwent a four-phase DCE-CT examination and for whom FLLs were confirmed by histopathological evaluation or were diagnosed based on a combination of clinical and radiological findings with follow-up were collected for further screening. The exclusion criteria were as follows: Lesions larger than 10 cm; images with prominent artifacts; and prior local-regional therapy prior to the CT examination.
Standard of classification
The lesions were classified into four categories according to different pathological types and treatment decisions. (1) Category A was hepatocellular carcinoma (HCC), which was confirmed by histopathologic evaluation after surgery or biopsy. (2) Category B represents liver metastases derived from different primary sites such as colorectal cancer, gastric carcinoma, breast cancer, lung cancer, thyroid cancer, malignant jejunal stromal tumor, duodenal papillary carcinoma, and laryngocarcinoma. The primary lesions were confirmed by a pathological examination, but the metastatic lesions were diagnosed based on the clinical data, patient history, other follow-up CT, magnetic resonance imaging, and positron emission tomography/CT scans. For liver metastases, the follow-up time was 60 d to 1230 d, and the median was 300 d. (3) Category C was defined as benign non-inflammatory FLLs, including hemangiomas, focal nodular hyperplasias (FNHs), and adenomas. A total of 27 lesions, including all adenomas, were confirmed by a histopathological evaluation after surgery, while the remaining 135 lesions were diagnosed based on imaging diagnostic criteria from the CT scan in combination with the clinical information and follow-up MRI; the follow-up time was 90 d to 1800 d, and the median was 330 d. And (4) Category D was hepatic abscesses. The diagnosis of hepatic abscess was based on typical imaging findings, clinical aspects, laboratory findings, and microbiology on blood or aspirate culture results. While all patients received early empirical antibiotic treatment, 37% patients underwent percutaneous or surgical drainage. A longer follow-up with a median time of 100 d (range, 60-365 d) confirmed the remission or absence of signs and symptoms together with imaging studies without findings compatible with hepatic abscess after treatment.
Finally, a total of 375 patients with 517 lesions were enrolled in this study from 2012 to 2017. Each category was split into a training set and test set. Patients who underwent CT scan before June 2016 were used for training, while those after June 2016 were used for testing. The ratio between training set and test set was approximately 8:2.
Basic information about the patients was obtained from the hospital information system, including gender, age, surgical and pathological reports, lesion size, and follow-up time.
Input data: CT imaging protocol
A 320-detector CT scanner (Aquilion ONE; Toshiba Medical Systems, Otawara, Japan) was used to acquire four-phase DCE-CT imaging protocols including precontrast phase (PP), arterial phase (AP), portal venous phase (PVP), and delayed phase (DP). The following scan parameters were used: A peak tube voltage of 120 kV, a tube rotation time of 0.5 s per rotation, a pitch factor of 0.828, a field of view of 35 cm × 35 cm, a matrix of 512 × 512, and automatic tube current modulation.
The first phase was PP to cover the whole liver. The next three phases were contrastenhanced phases with the same scanning range after the intravenous injection of low osmolar nonionic contrast medium (Ioversol-350; Tyco Healthcare, Montreal, Quebec, Canada and Isovue-370, Bracco Diagnostics, Guangzhou, China) into the right antecubital vein at an injection rate of 3 mL/s and a dose of 1.5 mL/kg body weight, followed by a 20-mL saline chaser.
The AP was acquired by performing a bolus tracking technique. The AP was scanned 15 s after CT attenuation of the aorta at the level of the diaphragm had reached 200 Hounsfield Units. For the PVP, images were acquired 30 s after the AP. The DP was scanned 45 s after the PVP. All images were reconstructed in the axial plane with a slice thickness of 5 mm and interval of 5 mm using a kernel for the evaluation of soft tissues (FC19) and then sent to the PACS.
Input data: CT imaging annotation
The CT imaging annotation was manually and independently performed by four radiologists (all had at least 4 years of imaging experience), and the results were reviewed by a radiologist with 20 years of imaging experience. For each patient, the four-phase CT images were manually loaded into 3D Slicer (https://www.slicer.org). The boundary of each lesion was manually drawn slice-by-slice along the visible borders of the lesion using the annotation module available in 3D Slicer. The classification of the type of each lesion was manually annotated using a homedeveloped lesion annotation module in 3D Slicer.
Input data: CT imaging processing pipeline
The four phases were organized in a sequence according to the acquisition time and fed into the image processing pipeline, as shown in Figure 1. The inner-phase registration and normalization were used to achieve volume-wise processing. The inner-phase registration was performed by using a nonrigid registration module implemented in Elastix (http://elastix.isi.uu.nl) with PVP as the reference phase, and then each phase was linearly normalized to (-1, 1) with a corresponding HU of (0, 300). Cropping and resizing were performed for lesion-wise processing using the Python library scikit-image 0.15.0 (https://scikit-image.org/scikit-image 0.15.0). For each lesion, a three-dimensional bounding box was generated to cover the lesion boundary and extended with a spare boundary of 10 mm along each direction. After extracting the bounding box of the lesion, ROIs were cropped from the PVP. The ROI was a square on each axial plane, the length of the side was 1.5 times the value of the longest side of the bounding box on the axial plane, and the center point was the projection of the center point of the bounding box on each axial plane. Then the bounding boxes were propagated on other phases to crop the lesion. Following lesion cropping, each cropped ROI was resized into an identical shape in the size of 128 × 128. ROIs from five slices centered at the lesion were extracted and stacked together to form a (128, 128, 5) tensor as the input data for each phase.
Deep convolutional network architecture
The deep convolutional network was designed following the concept of the automatic extraction of useful features from each phase and then the sequential combination of each phase's features to achieve classification, as detailed in Figure 2. Each phase’s automatic feature extraction was implemented using a densely connected stack of twodimensional convolutional, center-cropping and max-pooling layers, where the convolutional kernel size was 3 × 3; the cropping and pooling size was 2 × 2; and the activation layer used the “ReLU” activation function. Then, the four-phase convolutional layers were flattened and sequentially connected to the last dense layer with SoftMax activation for classification purposes. The sequential connection of each phase's CNN network block was designed to preserve the dynamic enhancement properties.

Figure 1 Four-phase images processing pipeline for multiphase convolutional dense network. AP: Arterial phase; DP: Delayed phase; HU: Hounsfield unit; MD-CDN: Multiphase convolutional dense network; PP: Precontrast phase; PVP: Portal venous phase; ROI: Region of interest.
The deep convolutional network was a 2.5 D MP-CDN with the four phases of resized multichannel images as the input (the slice was used as the channel dimension in this network). The classification tasks consisted of training and testing, in which the training task was performed with a batch size of 100 and the test task was performed once for each lesion.
Training and evaluation
For the training set, data augmentation options, which include scaling and rotation, were applied to each ROI. An augmented training dataset with a size 21 times greater than the raw dataset was used to train the model. The test set without augmentation was directly used to assess the model.
During the training phase, the category label was converted to 0.0 or 1.0 as the SoftMax probability to train the model. During the testing phase, the category label included the binary label and probability label, where the binary label was 1.0 or 0.0 corresponding to the class with the largest or non-largest probability from the SoftMax layer. In terms of probability label, the result was derived from the SoftMax probability outputted from the last layer of the MP-CDN.
Model implementation
The model was programmed using Python3.7 (https://www.python.org/) under the deep learning model development framework of Keras (https://keras.io) with the TensorFlow (https://www.tensorflow.org) backend. The network weights were optimized using the Adam optimizer, the learning rate was 0.00001 and the loss function was categorical cross-entropy. A graphics processing unit (GPU) (NVIDIA Titian 1080Ti) was used to accelerate the model training and testing phases.
Statistics
The distributions of age, sex, and lesion size in each of the sets (training and test sets) were compared using SPSS 17.0 software (SPSS Inc., Chicago, IL, United States). Quantitative variables were compared using the Wilcoxon rank sum test ort-test, and qualitative variables were compared using the chi-squared test.
The classification performance of the model was assessed on the test set: The accuracy, specificity, and sensitivity for differentiating each category from the others were calculated from the confusion matrix from the confusion matrix, and the area under the receiver operating characteristic (ROC) curve (AUC) was calculated from the SoftMax probability outputted from the last layer of the MP-CDN using SPSS 17.0 Software.
The model was further evaluated by applying a “phase cheating” experiment on the test set. The “phase cheating” experiment was implemented by eliminating one or more phases from the four phases and replacing it with the wrong phase(s) before feeding it into the model. The design idea of this experiment was based on the following concepts: (1) The liver lesion's dynamic enhancement pattern is vital in differential diagnosis; (2) Our model was designed to accommodate the correct sequence of four phases, which preserved the dynamic enhancement properties; and (3) The “phase cheating” experiment was used to test whether our model had learned this important dynamic enhancement pattern. If the phases were replaced by a certain phase (the so-called “phase cheating” experiment), its dynamic enhancement pattern might be different and may result in an incorrect category prediction. We re-evaluated the classification performance by comparing the AUCs between the model in the normal set and that in the “phase cheating” sets by using MedCalc Software (version 11.4.2 for Windows, MedCalc Software bvba).
Statistical significance was defined asP< 0.05.
RESULTS
Of the 15680 patients with FLLs treated at our hospital from 2012 to 2017, 375 patients with 517 lesions met the inclusion criteria. Of the 517 FLLs, 410 FLLs (88 HCCs, 89 metastases, 128 benign non-inflammatory FLLs, and 105 abscesses) were used for training, and 107 FLLs (23 HCCs, 23 metastases, 34 benign non-inflammatory FLLs, and 27 abscesses) were used for testing. Table 1 presents the basic and detailed information of each dataset.
The confusion matrix analysis on the test set is shown in Table 2. Of the 23 HCCs, 17 lesions were correctly classified, 4 lesions were misclassified as benign noninflammatory FLLs, and the remaining 2 lesions were misclassified as metastases. It was interesting to note that all metastases (23 lesions) were correctly classified. Of the 34 benign non-inflammatory FLLs, 25 lesions were correctly classified, 3 lesions were misclassified as HCC, 3 lesions were misclassified as metastases, and the remaining 3 lesions were misclassified as hepatic abscesses. Of the 27 hepatic abscesses, 22 lesions were correctly classified, 3 lesions were misclassified as metastases, and the remaining 2 lesions were misclassified as benign non-inflammatory FLLs. The representative correctly classified and misclassified examples of each category are shown in Figure 3. The accuracy/specificity/sensitivity of differentiating each category from others were 0.916/0.964/0.739, 0.925/0.905/1.0, 0.860/0.918/0.735 and 0.925/0.963/0.815 for HCC, metastases, benign non-inflammatory FLLs, and abscesses, respectively.
ROC analysis was performed on the test set. The AUC (95% confidence interval [CI]) for differentiating each category from the others was 0.92 (0.837-0.992), 0.99 (0.967-1.00), 0.88 (0.795-0.955) and 0.96 (0.914-0.996) for HCC, metastases, benign noninflammatory FLLs, and abscesses, respectively (Figure 4A). The model's classification probability was calibrated for each category, as shown in Figure 4B, and the Brier scores were 0.104, 0.080, 0.124, and 0.074 for HCC, metastases, benign noninflammatory FLLs, and hepatic abscesses, respectively.
Table 3 shows the AUC andPvalue when using the “phase cheating” setscompared to the normal set. The AUCs were lower for the “phase cheating” set with eliminating AP and/or PVP than for the normal set in differentiating HCC from the others (P< 0.05). When we replaced PP with AP, there was no significant difference between the AUCs of the normal set and “phase cheating” sets in differentiating HCC from the others (P> 0.05). Figure 5 shows the heatmaps of the predicted category when using the “phase cheating” sets compared to the normal set.
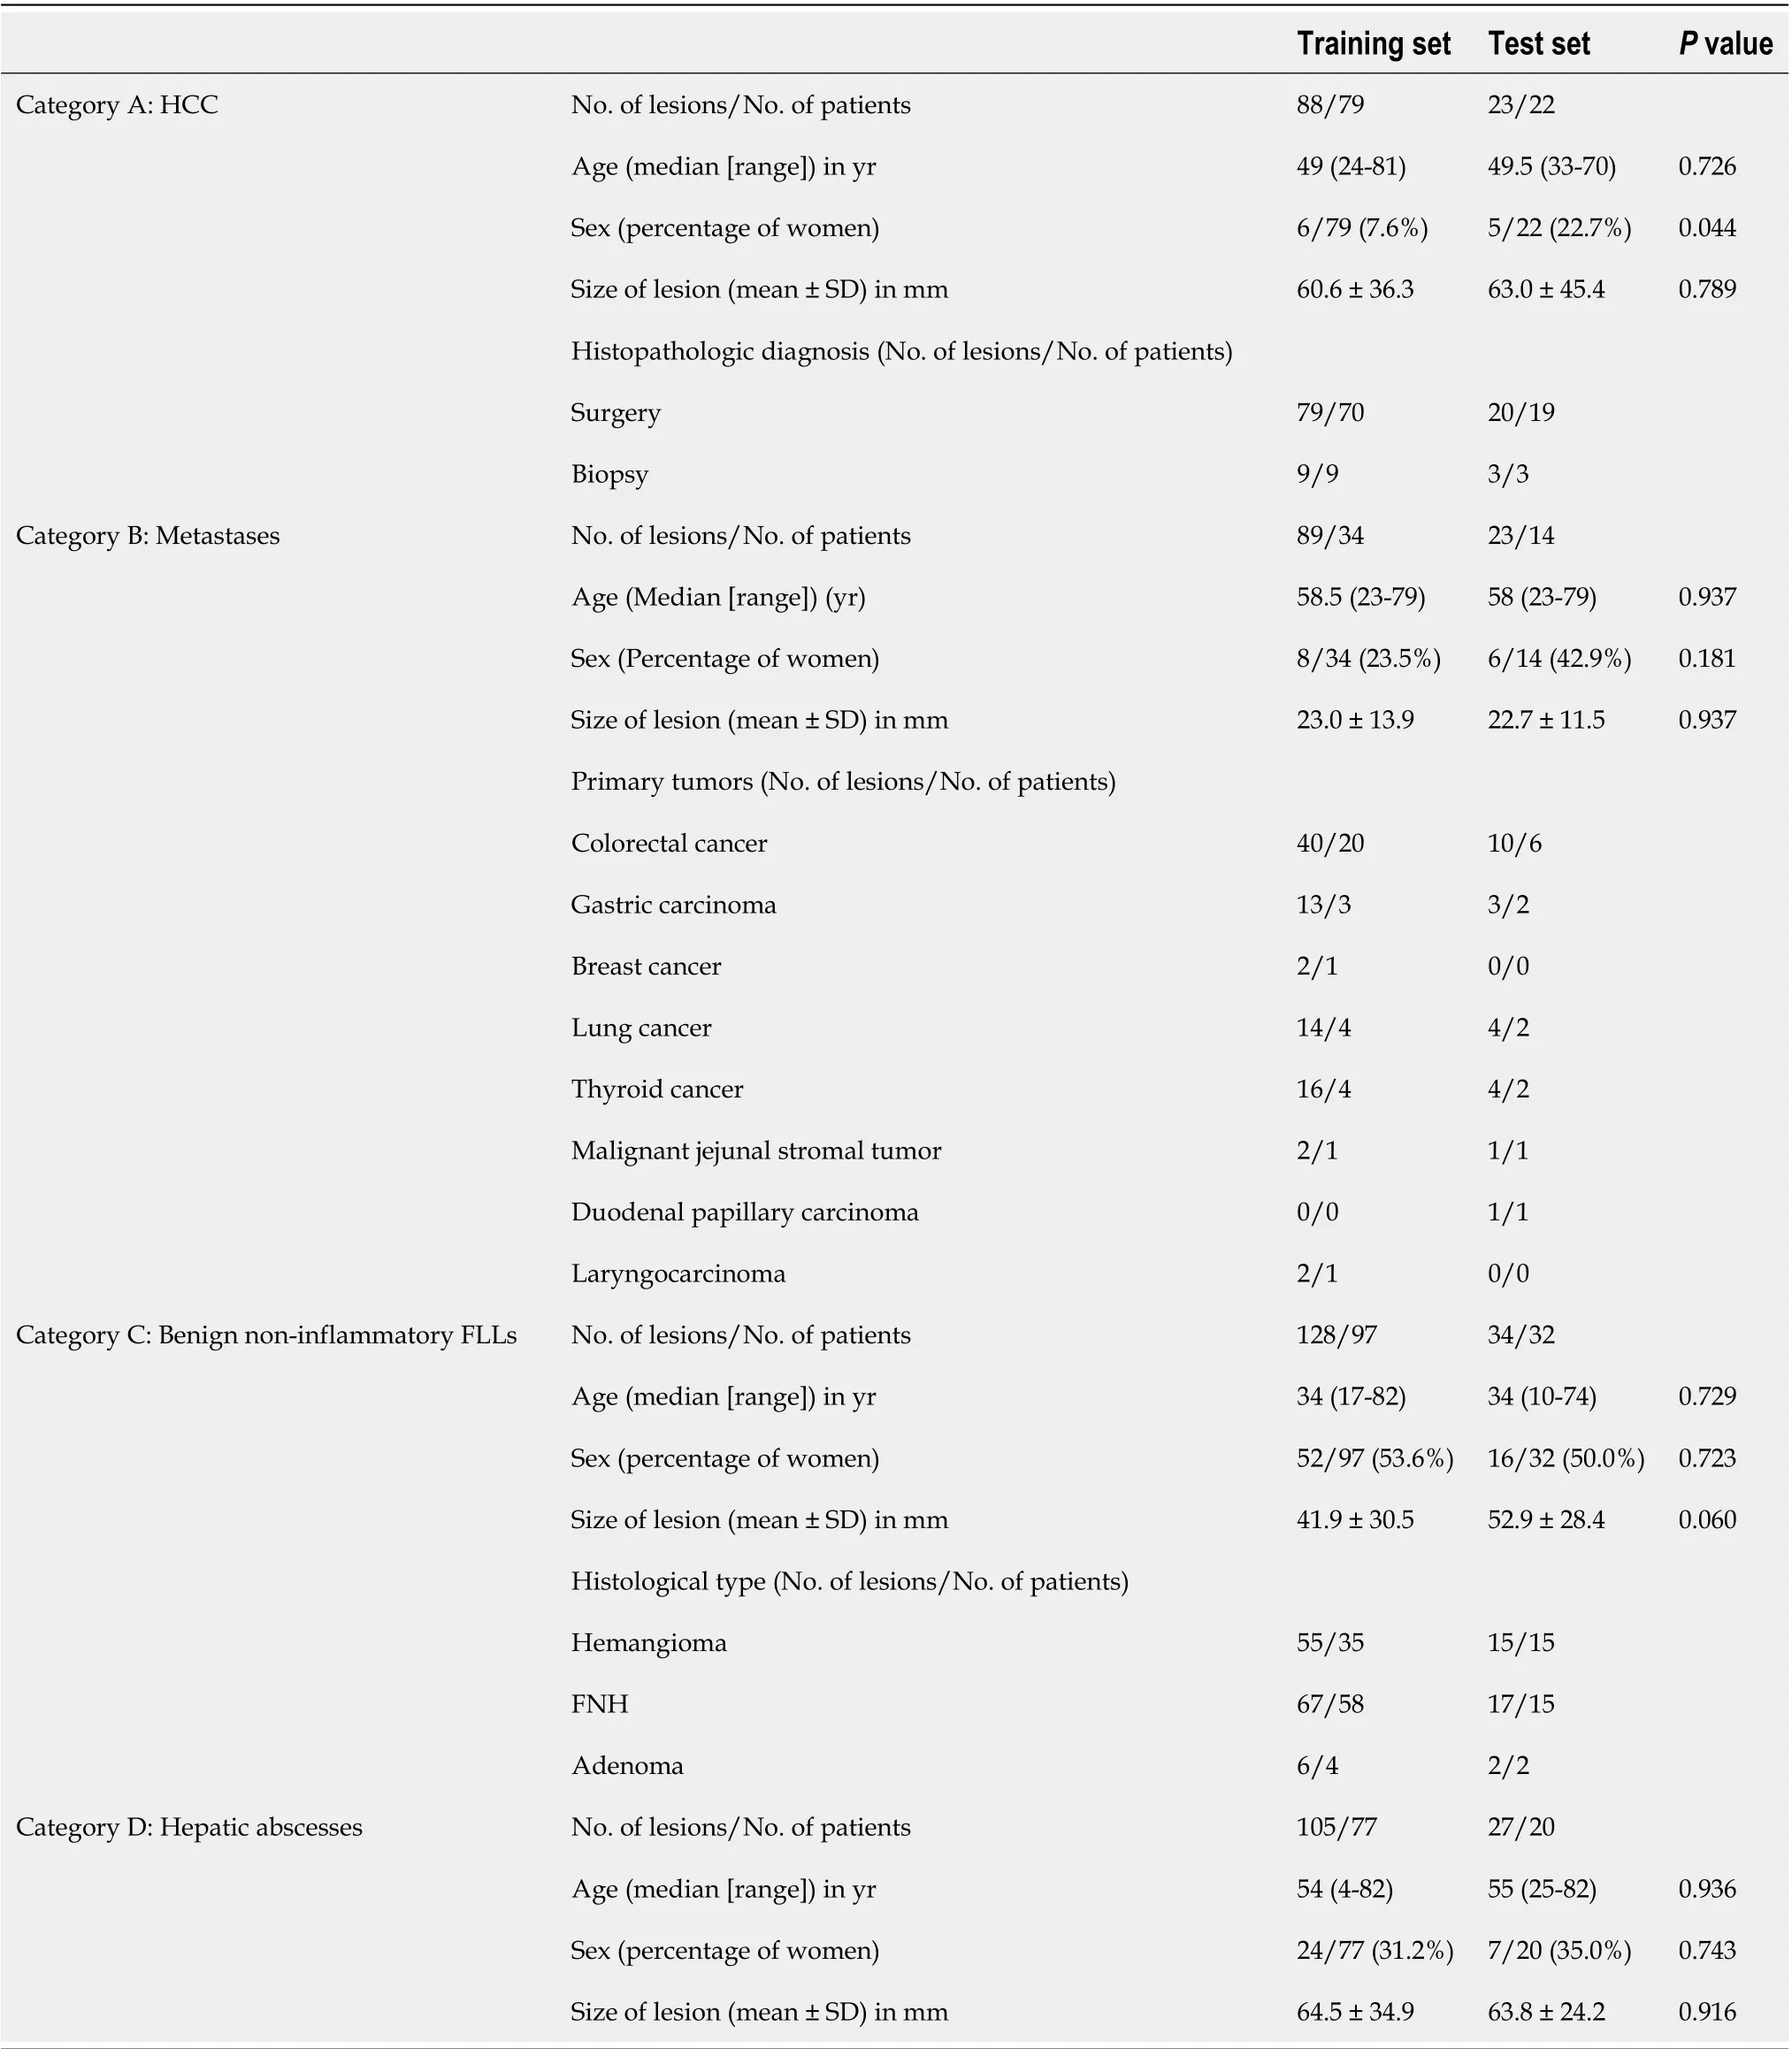
Table 1 The basic information and detail distribution of each dataset
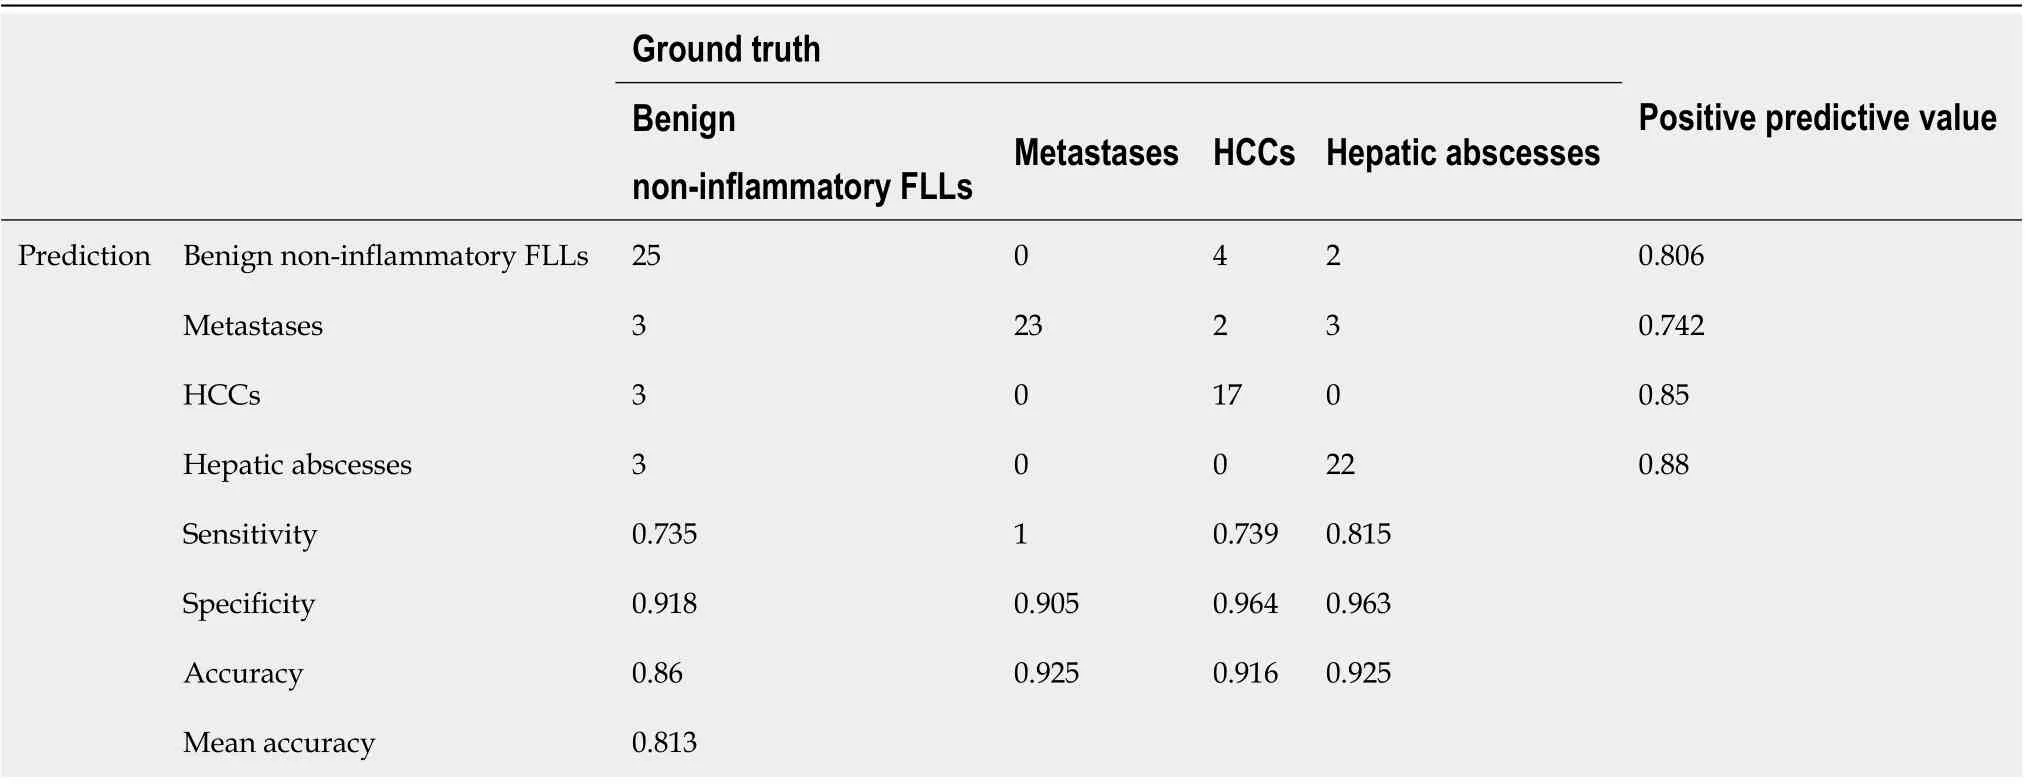
Table 2 The confusion matrix analysis on test set
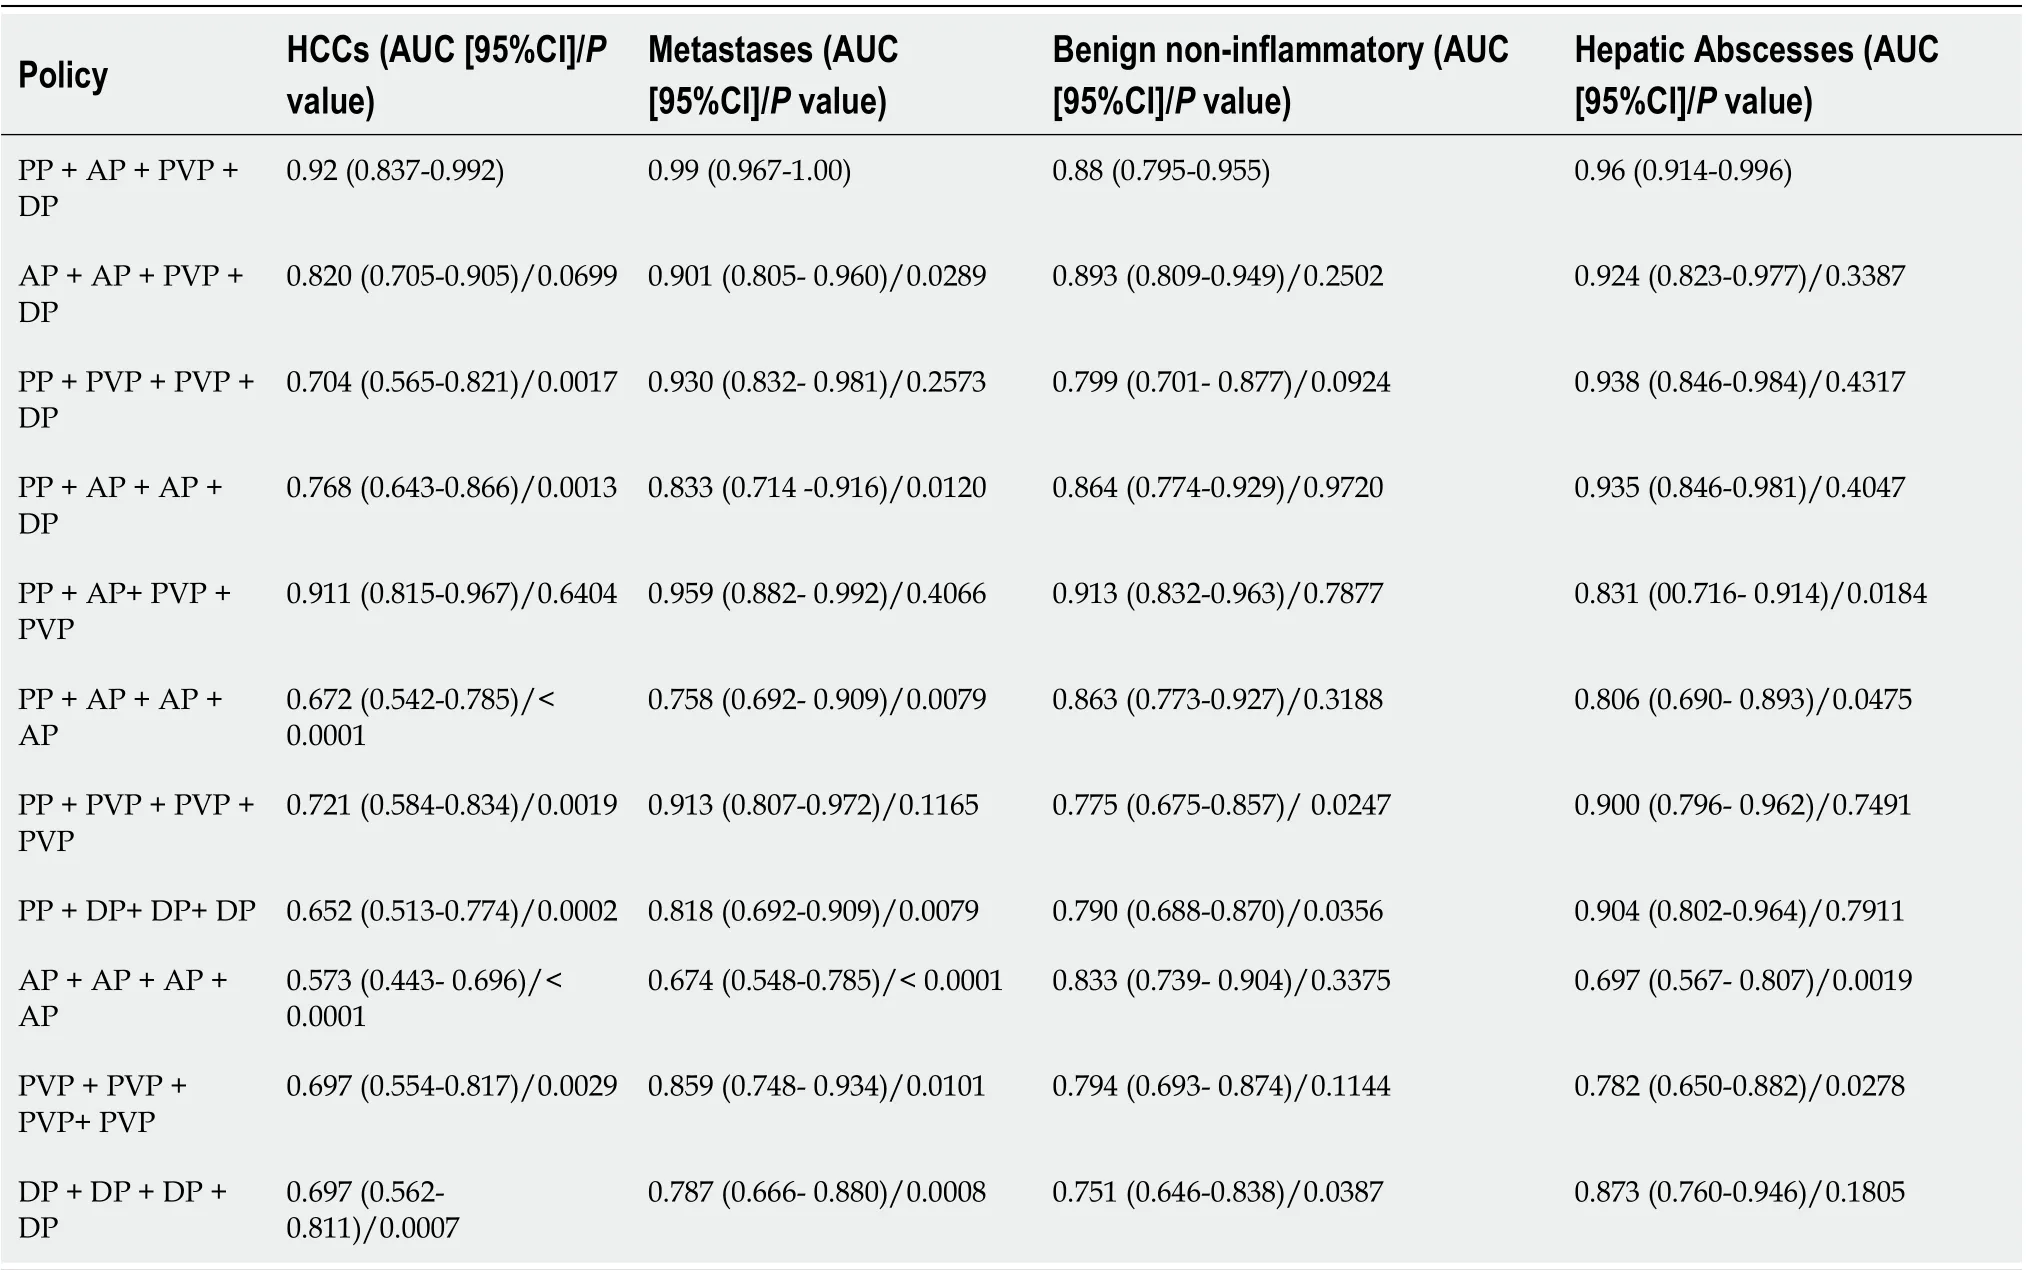
Table 3 The model's performance comparison between the normal set and “phase cheating” sets
DISCUSSION
The correct diagnosis of liver lesions before treatment is of great significance. In our study, a classification system was proposed based on the features derived from the four-phase DCE-CT images. The AUC (95%CI) for differentiating each category from the others was 0.92 (0.837-0.992), 0.99 (0.967-1.00), 0.88 (0.795-0.955), and 0.96 (0.914-0.996) for HCC, metastases, benign non-inflammatory FLLs, and hepatic abscesses, respectively, indicating that the classification system is highly capable of distinguishing one lesion type from the others.
本文选取的国际石油公司包括2家国际大石油公司埃克森美孚、埃尼,1家国家石油公司中国海油,2家独立石油公司阿帕奇(Apache)和康菲石油,力图探析这三类不同石油公司群体及公司个体在勘探布局上的特点,并总结规律。

Figure 3 The representative correctly classified and misclassified categories. For each patient, axial four-phase (PP, AP, PVP, DP) computed tomography images were obtained and focal liver lesions were diagnosed by histopathologic evaluation after biopsy or surgery. A: A 33-year-old man with focal nodular hyperplasia was correctly classified as category C; B: A 54-year-old woman with hemangioma was misclassified as category D; C: A 52-year-old man with hepatic abscess was correctly classified as category D; D: An 82-year-old woman with hepatic abscess was misclassified as category B; E: A 55-year-old man with HCC was correctly classified as category A; F: A 38-year-old woman with HCC was misclassified as category C; G: A 75-year-old man with liver metastases derived from colorectal cancer was correctly classified as category B. And there was no misclassification for the metastasis group. AP: Arterial phase; DP: Delayed phase; PP: Precontrast phase; PVP: Portal venous phase.
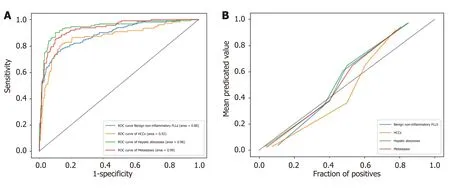
Figure 4 The receiver operating characteristic analysis of model's classification performance on test set and calibration curve of model's classification probability for each category. A: The receiver operating characteristic analysis of model's classification performance on test set; B: Calibration curve of model's classification probability for each category. FLLs: Focal liver lesions; HCC: Hepatocellular carcinoma; ROC: Receiver operating characteristic.
Since the different types of FLLs have different outcomes and require different clinical interventions, the current challenge in determining an accurate diagnosis involves not only effectively differentiating between benign and malignant FLLs according to the medical image but also accurately recognizing the different types of FLLs. A previous study[20]proposed a novel two-stage multiview learning framework for the ultrasound-based computer-aided diagnosis of benign and malignant liver tumors. Although both HCC and metastases are malignant liver tumors, their treatment strategies are completely different; thus, more accurate classification is needed. Yasakaet al[15]investigated the feasibility of applying deep learning models for liver lesion classification using CT images and showed good model performance. However, their standard of classification was based on the radiologic features. HCC is treated differently from metastases, as are abscesses and FNHs. In our study, the category label obtained from the combination of contemporaneous histology and treatment decisions should have more practically applicable value.
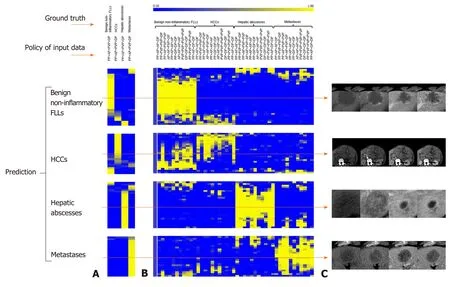
Figure 5 Predicted probability heatmaps. The top color bar represents the classification probability of the model from 0 to 1, which corresponds to dark blue to bright yellow. A: Shows the results from normal four-phase input; B: Shows the results from different “phase cheating” sets as indicated in the policy of input data; C: Shows the representative examples. AP: Arterial phase; DP: Delayed phase; PP: Precontrast phase; PVP: Portal venous phase.
Notably, the sensitivity for distinguishing HCC was not high (0.739) in our study, similar to that of previous studies. The range of sensitivities reported in the literature for the detection of HCC on DCE-CT is 50%-75%[21-24]. However, the diagnosis of the lesions may vary depending on the imaging modality. Hammet al[18]developed a CNN model based on MRI images for liver lesion classification, demonstrating high sensitivity. Previous studies[24,25]also reported the superiority of MRI over CT. However, in clinical practice, CT is more accessible and more inexpensive than MRI. Those patients who have a contraindication for MRI due to a comprehensive past history and clinical evaluation are candidates for the CT examination. Our model should be made available to these patients.
The interpretation of how neural networks, particularly deep neural networks, obtain the conclusion is difficult, and these networks are criticized as black boxes[26]. To evaluate whether our model correctly learned useful features from the four-phase CT images, we applied a “phase cheating” experiment on the test set. Compared to the normal set, the performance of the deep-learning network in differentiating HCC from others was dramatically degraded once the placeholder on AP and/or PVP was occluded (P< 0.05). This finding probably indicates that the networks make decisions by using accurate distinguishing features, AP hypervascularity and washout in the PVP, which is consistent with the clinical diagnostic criteria for HCC[26]. However, there was no significant difference in the AUCs for differentiating HCC from others between the normal set and the “phase cheating” set when PP was replaced by AP. This result was likely because most lesions are hypodense in the PP[27,28]and the normal hepatic parenchyma shows only minimal enhancement during the AP. The degree of enhancement of lesions in the AP was obtained by comparing the normal hepatic parenchyma around the lesions. In addition, the enhanced scans and the PP have the same value in the diagnosis of calcium, necrosis and gas in the lesion.
One issue for supervised learning is overfitting[29], which normally shows good fit on training data but performs poorly on unseen test data. When the size of training set is small, this phenomenon becomes more apparent. To avoid overfitting, we applied various regulation techniques in the model during training, such as adding normalization layers to generalize the model, applying L2 regulation to the filters, adding a dropout layer, and augmenting the data to accommodate data variation. The Brier scores for HCCs, metastases, benign non-inflammatory FLLs and hepatic abscesses also suggest that our model is accurate and reasonable.
Our study had several limitations. First, we only evaluated the four-phase CT images and did not consider the clinical information, such as an increased alphafetoprotein level and a history of hepatitis B, C infection or liver cirrhosis, which might suggest HCC[29]. Second, we only trained and evaluated the model in a single center setting using a single CT scanner, where there might be a data bias that may lead to model bias. The model should display better generality if more variable data are analyzed. Third, the sample size of the test set was relatively small. Therefore, a larger sample is needed for further studies. Finally, we did not include lesions larger than 10 cm due to the balance among network depth, input matrix size, receptive field size, and memory load. For larger lesions, a higher matrix input size and a deeper network depth are needed, causing a rapid increase in memory requirement, which exceeds the capacity of the current GPUs.
In conclusion, the MP-CDN showed a high differential diagnostic performance for classifying FLLs as HCC, metastases, benign non-inflammatory FLLs and hepatic abscesses in four-phase CT images. If trained on a larger sample or a diverse cohort imaged with a variety of CT scanners, the MP-CDN could become an efficient tool to assist radiologists in accurate identification of the different types of FLLs. However, further evaluation of this model in a multicenter setting is necessary to evaluate its clinical utility.
ARTICLE HIGHLIGHTS


Research results
A total of 410 FLLs were used for training and 107 FLLs were used for testing. The accuracy/specificity/sensitivity of differentiating each category from others were 0.916/0.964/0.739, 0.925/0.905/1.0, 0.860/0.918/0.735 and 0.925/0.963/0.815 for HCC, metastases, benign non-inflammatory FLLs, and abscesses on the test set, respectively. The AUC (95% confidence interval) for differentiating each category from others was 0.92 (0.837-0.992), 0.99 (0.967-1.00), 0.88 (0.795-0.955) and 0.96 (0.914-0.996) for HCC, metastases, benign non-inflammatory FLLs, and abscesses on the test set, respectively. Also, for this study, we only trained and evaluated the CNN model in a single center setting using a single CT scanner, where there might be a data bias that may lead to model bias. Further evaluation of this model in a multicenter setting is needed to evaluate its clinical utility.
Research conclusions
Overall, our CNN model showed a high differential diagnostic performance for classification FLLs as HCC, metastases, benign non-inflammatory FLLs and hepatic abscesses in four-phase CT image and could become an efficient tool to assist radiologists in accurate identification of the different types of FLLs.
Research perspectives
Further multicenter studies are necessary to evaluate the clinical utility of our CNN model. In addition, it’s worth to evaluate the clinical information whether can further improve the perform of CNN model.
 World Journal of Gastroenterology2020年25期
- World Journal of Gastroenterology的其它文章
- TBL1XR1 induces cell proliferation and inhibit cell apoptosis by the PI3K/AKT pathway in pancreatic ductal adenocarcinoma
- Development of innovative tools for investigation of nutrient-gut interaction
- Practical review for diagnosis and clinical management of perihilar cholangiocarcinoma
- Management of nonalcoholic fatty liver disease in the Middle East
- Quality of life in patients with gastroenteropancreatic tumours: A systematic literature review
- Functionality is not an independent prognostic factor for pancreatic neuroendocrine tumors
