Association of dyslipidemia with severity of meibomian gland dysfunction in a tertiary care hospital of Uttarakhand region
2020-08-06 03:19:54
国际眼科杂志 2020年8期
Abstract
•KEYWORDS:meibomian gland dysfunction; dyslipidemia; lipid profile
INTRODUCTION
Meibomian gland dysfunction (MGD) is a broad term used to describe a group of disorders, both congenital and acquired, linked by functional abnormalities of the meibomian glands[1].MGD is commonly characterized by terminal duct obstruction and/or qualitative/quantitative changes in glandular secretion.It may result in alteration of the tear film, symptoms of eye irritation, clinically apparent inflammation and ocular surface disease[2].With a number of changes in lifestyle involving dietary preferences and work habits, the incidence and prevalence of dry eye has increased in the general population.MGD is a major cause of dry eye, but is often overlooked in busy out-patient settings.Recent studies showed that the prevalence of MGD in general population varies between 30.5% and 54.1%[3-4].The lipid layer is an essential component of the tear film, which maintains a smooth corneal surface and controls the evaporation rate from the eye[5].Chemical analysis of lipids secreted from normal meibomian glands shows that it consists of a mixture of non-polar lipids (wax esters, cholesterol, and cholesterol esters) and polar lipids (phospholipids)[6].Since meibomian gland secretion is lipid in nature, a possible link between the systemic dyslipidemia and severity of MGD seems logical.
To the best of our knowledge, no study has been conducted in the Uttarakhand population which analyses the correlation between dyslipidemia and MGD severity.In this study we analysed the correlation between serum lipids levels and severity of MGD in a tertiary care hospital of Uttarakhand region.
SUBJECTS AND METHODS
This was a prospective observational study conducted over a period of one year in a tertiary care hospital of Uttarakhand.Ethical approval was obtained from the Institutional Ethics Committee.Fifty consecutive patients visiting the eye OPD and diagnosed with MGD were enrolled after taking their informed consent.The study adhered to the tenets of Declaration of Helsinki.The inclusion criteria was: patients aged 20-60 years and diagnosed with MGD.
ExclusionCriteriaPatients suffering from infectious kerato-conjunctivitis or inflammatory ocular surface disorder unrelated to MGD; recent ocular surgery; recent use of anti-glaucoma medication or topical steroids; use of medication causing dry eye (antihypertensive/cholinergic/OCPs/isotretinoin); rosacea; pregnancy; Sjogren syndrome; Parkinson’s disease and patients with diabetes mellitus, cardiovascular disease or cholestatic liver disease.
Once included, the patients underwent a detailed history and ocular examination: 1) Symptoms scaled according to Ocular Surface Disease Index Questionnaire as mild, moderate or severe[7]; 2) Blink rate (average taken 12-15/min)[8]; 3) Tear meniscus height (cut off: 1.5 mm)[9-10]; 4) Tear film breakup time (cut off: 10s)[9-10]; 5) Grading of corneal and conjunctival fluorescein staining: Oxford[10]and DEWS scale; 6) Schirmer’s test (cut off: 10 mm)[9-10].
MeibomianGlandStatusAssessed by the following indices[1]: 1) Meibum quality: Assessed in each of the eight glands of central third of the lower eyelid on a 0-3 scale for each gland: 0=Clear meibum; 1=Cloudy meibum; 2=Cloudy with debris; 3=Thick like toothpaste (range 0-24); 2) Expressibility of meibum: Assessed from 5 glands of central third of the lower eyelid on a scale of 1-3: 1=3-4 glands expressible; 2=1-2 glands expressible; 3=No glands expressible; 3) Numerical staining: scores refer to a summed score of staining of the exposed cornea and conjunctiva.Fluorescein and Rose Bengal stains were used.The Oxford scale has a range of 0-15 and the DEWS scale has a range of 0-33.
This grading was obtained by firm digital pressure over the central third of upper and lower eyelid, while observing the ease of excretion and quality of meibum under a slit lamp bio-microscope.
ClinicalStagingofMGDMGD was graded according to the report submitted by the International Workshop on Meibomian Gland Dysfunction and Management in 2011, MGD was divided into four stages, taking both the symptoms and clinical signs into consideration.
Stage 1: No symptoms of ocular discomfort, itching or photophobia; Minimally altered secretions: Greater than or equal to grade 2 to less than grade 4; Expressibility: 1; No ocular surface staining present.
Stage 2: Minimal to mild symptoms of ocular discomfort, itching, or photophobia; Minimal to mild MGD clinical signs; Scattered lid margin features; Mildly altered secretions: Grade 4-7; Expressibility: 1; None to limited ocular surface staining (DEWS grade 0-7; Oxford grade 0-3).
Stage 3: Moderate symptoms of ocular discomfort, itching or photophobia with limitation of activities; Moderate MGD clinical signs; Increased lid margin features: plugging, vascularity; Moderate altered secretions: grade 8-12; Expressibility: 2; Mild to moderate conjunctival and peripheral corneal staining, often inferior (DEWS grade 8-23; Oxford grade 4-10).
Stage 4: Marked symptoms of ocular discomfort, itching, or photophobia with definite limitation of activities;
Severe MGD clinical signs; Increased lid margin features: dropout, displacement; Severely altered secretions: Grade ≥13; Expressibility: 3.Increased conjunctivaland corneal staining, including central staining (DEWS grade 24-33; Oxford grade 11-15).
LipidProfileLipid profile was done on fully automated clinical chemistry analyzer Vitros 5600 using commercially available kits at Department of Clinical Biochemistry.
Following parameters were measured: Triglycerides (TG): Hypertriglyceridemia >150 mg/dL; Total cholesterol (TC): Hypercholesterolemia >200 mg/dL; Low-density lipoprotein (LDL) cholesterol (LDL-C): High LDL >130 mg/dL; High-density lipoprotein (HDL) cholesterol (HDL-C): High HDL >40 mg/dL; Very low density lipoprotein (VLDL) cholesterol: High VLDL >22 mg/dL.
StatisticalAnalysisStatistical evaluation was done by calculating the prevalence of dyslipidemia in patients with MGD.Categorical variables were presented in number and percentage (%) and continuous variables were presented as mean±SD and median.Qualitative variables were correlated using Chi-square test.APvalue of <0.05 was considered statistically significant.The data were entered in MS Excel spreadsheet and analysis was done using Statistical Package for the Social Sciences (SPSS) version 21.0.
RESULTS
Out of total 50 patients in our study, 4 (8%) patients belonged to 21-30 years age group, 15 (30%) patients to 31-40 years, 16 (32%) patients in 41-50 years age and 16 (32%) patients in 51-60 years of age group.Maximum patients belonged to stage 2 severity of MGD (n=30, 60%) and minimum patients belonged to stage 4 severity of MGD (n=3, 6%).The severity of MGD had a statistically significant positive correlation with increasing age (χ2=24.283,P=0.004) (Table 1).
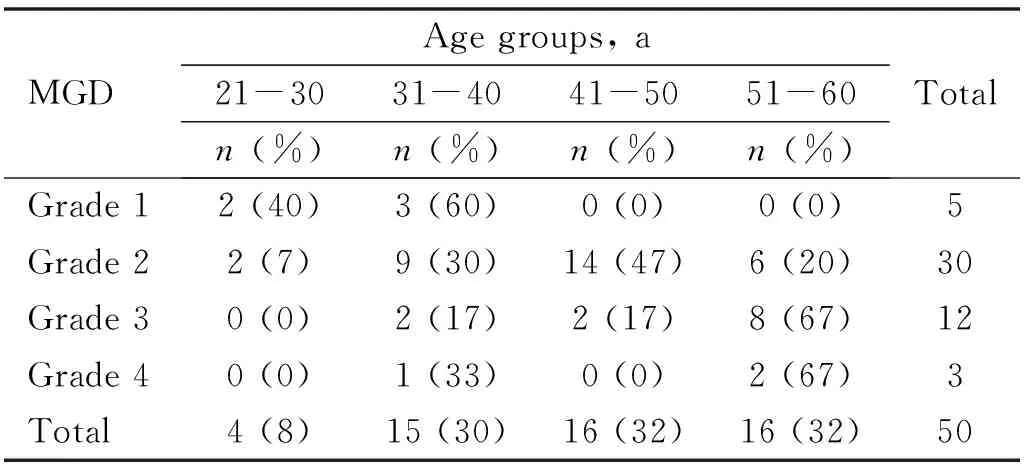
Table 1 Age wise distribution of patients in different grades of MGD

Table 2 Gender distribution of patients in different grades of MGD
Out of total 50 patients, 36 (72%) patients were females and 14 (28%) were males.Grade 2 MGD was most common in both males and females.Among 36 females, 4, 22, 8, 2 patients belonged to stage 1, 2, 3, 4 severity of MGD respectively.Amongst 14 males, 1, 8, 4, 1 patients belonged to stage 1, 2, 3, 4 severity of MGD respectively.The difference in the severity of MGD between males and females was not statistically significant (χ2=0.397,P=0.941) (Table 2).
The total number of MGD patients with TC >200 mg/dL were 35 (70%) and TC<200 mg/dL were 15 (30%).Among patients having TC<200 mg/dL, maximum patients belonged to stage 2 MGD and in patients with TC>200 mg/dL, maximum patients belonged to stage 3 MGD.ThePvalue was 0.001 suggesting a strong positive correlation between TC levels and increasing severity of stage of MGD (χ2=20.794) (Table 3).
The total number of MGD patients with TG >150 mg/dL were 35 (70%) and TG<150 mg/dL were 15 (30%).Amongst patients with TG<150 mg/dL and TG>150 mg/dL maximum patients belonged to stage 2 severity.There was a strong positive correlation between TG levels and increasing severity of MGD (χ2=10.000,P=0.019) (Table 4).

Table 3 Correlation of serum TC levels with severity of MGD

Table 4 Correlation of serum TG levels with severity of MGD

Table 5 Correlation of serum LDL levels with severity of MGD
The total number of MGD patients with LDL>130 mg/dL were 25 (50%) and LDL<130 mg/dL were 25 (50%).Amongst patients having LDL<130 mg/dL, maximum patients belonged to stage 2 MGD and in patients with LDL>130 mg/dL, maximum patients belonged to stage 3 MGD.ThePvalue was 0.001 suggesting a significant positive between LDL levels and increasing severity of MGD (χ2=23.333) (Table 5).
The total number of MGD patients with VLDL>22 mg/dL were 33 (66%) and VLDL<22 mg/dL were 17 (34%).Stage 2 MGD was most common in both the groups.There was a statistically significant positive correlation between the VLDL levels and severity of MGD (χ2=10.264,P=0.016) (Table 6).
The total number of MGD patients with HDL>40 mg/dL were 13 (26%) and HDL<40 mg/dL were 37(74%).Stage 2 MGD was most common in both the groups.There was a negative correlation between HDL levels and MGD severity.However it was not statistically significant (χ2=6.254,P=0.100) (Table 7).
Table 8 shows comparative analysis of serum lipid levels amongst various grades of MGD.Serum TG levels were significantly increased in stage 2 MGD as compared to stage 1 (P=0.023).All the serum lipid profile parameters except serum HDL had statistically significant differences (P≤0.05) when stage 1 MGD was compared with stage 3 MGD.All the serum lipid profile parameters had statistically significant differences (P≤0.05) when stage 1 MGD was compared with stage 4.Similarly all the serum lipid profile parameters except serum HDL had statistically significantPvalues (P≤0.05) when stage 2 was compared with stage 3 MGD.All the serum lipid profile parameters except serum TG (P=0.02) and serum HDL (P=0.106) had statistically significantPvalues (P≤0.05) when compared between stages 2 and 4 MGD.There was no statistically significant value when comparison was made between stage 3 and stage 4 MGD in terms of serum lipid levels.

Table 8 Comparative analysis of stages of MGD

Table 7 Correlation of serum HDL levels with severity of MGD

Table 6 Correlation of serum VLDL levels with severity of MGD
DISCUSSION
MGD has a broad clinical spectrum ranging from patients being clinically asymptomatic to chronic ocular surface disturbances.Various previously determined risk factors are aging, environmental stress, hormonal imbalance, systemic and topical medications, ocular surface microbes, contact lens wear, ocular surface diseases, systemic diseases like diabetes mellitus and congenitally absent meibomian glands[11].The cause of MGD is incompletely understood, but changes in meibum composition and/or obstruction of the meibomian glands is thought to be central to the process[12-13].
Studies show that meibum of MGD patients has different components and proportions of cholesterol compared to the meibum of controls[14].Specifically, cholesterol esters were always present in the glands of patients with MGD but not necessarily in normal controls[15].Recent research postulates that increased cholesterol in meibum may play a role in the pathology of MGD[16].Systemic dyslipidemia may thus theoretically affect the meibomian lipid composition.Studies have been conducted in the past to study the association between the two but none in the Uttarakhand region of India.
In our study, maximum patients had grade 2 MGD (60%,n=30).We found a strong correlation between increasing age and severity of MGD.Similar correlation was shown by several previous studies[17-21].
There was a female preponderance in our study with 72% patients being female.However the relation between gender and severity of MGD was not statistically significant.This fact is variable in different studies.In a study conducted by Mobinetal[20], 57% of patients were male and Gulianietal[21]showed significant positive correlation between female gender and severity of MGD.This difference might be due to small cohort, variable demographics and life style patterns.Serum TC levels were > 200 mg/dL in 70% of MGD patients.We found a significant positive correlation between increasedTC levels and severity of MGD (P=0.001).Daoetal[22], Bukharietal[18]and Gulianietal[21]had similar observations.70% of the total MGD patients had high serum TG levels (>150 mg/dL) and there was a significant positive correlation between high TG levels and severity of MGD (P=0.019).Our results were comparable with the studies conducted by Mobinetal[20]and Gulianietal[21].50% MGD patients (n=25) had high LDL levels (>130 mg/dL) and maximum patients in this group belonged to stage 3 MGD.High LDL values had a significant positive correlation with the severity of MGD (P=0.001).Our findings correlated well with similar studies conducted in the past[17-21].
The total number of MGD patients with VLDL>22 mg/dL were 66% (n=33).A significant positive correlation was there between VLDL levels and severity of MGD (P=0.016).After thorough literature search we found only one study that compared VLDL levels with severity of MGD.Kumaretal[23]did not find any statistically significant association between VLDL levels and severity of MGD.This may be due to the difference in cut off values taken for high VLDL levels and small cohort size.
The total number of MGD patients with serum HDL>40 mg/dL were 13 (26%).Increased HDL levels showed a negative correlation with severity of MGD but it was not statistically significant (P=0.100).This was consistent with results of Kumaretal[23]but is contrary to some other previous studies[18-21,24].
The comparative analysis of various stages of severity of MGD in terms of serum lipid levels was also done.It revealed statistically significant differences in serum TG levels when compared between stage 1 and stage 2 MGD.All components of serum lipid levels except HDL in stage 3 and stage 4 MGD patients were significantly high as compared to stage 1 MGD.Similar pattern was noted when stage 2 was compared with stages 3 and 4 MGD.No significant difference was found in serum lipid levels between stage 3 and stage 4 MGD.
The above analysis signifies increase in serum lipid levels with the increase in severity of MGD from stage 1 to stage 3.However, similar results were not seen on comparing stage 3 and stage 4 which may be due to small cohort of analysis.We didn’t find any previous study comparing the various stages of MGD in terms of serum lipid levels which is an additional strength of our study.
In this study, we found that the incidence and severity of MGD increased with age.Also there was a strong positive correlation between all components of serum lipid levels and severity of MGD further confirmed on comparative analysis of various grades of MGD.Thus the present study highlights the significance of monitoring serum fasting lipid levels due to its potential correlation with the progression of MGD.Since the etio-pathogenesis of MGD is multifactorial and varies with demography and lifestyle patterns, further prospective, multicentric, randomized studies with bigger cohort would be required to establish the validity of the outcome of our study, to better characterize the changes imposed and also determine the effects of treatment of dyslipidemia on severity of MGD.