
Diurnal Variation in the Vertical Profile of the Raindrop Size Distribution for Stratiform Rain as Inferred from Micro Rain Radar Observations in Sumatra
2020-08-06 12:07:40RavidhoRAMADHANMARZUKIMutyaVONNISAHARMADIHiroyukiHASHIGUCHIandToyoshiSHIMOMAI
Advances in Atmospheric Sciences 2020年8期
Ravidho RAMADHAN, MARZUKI*, Mutya VONNISA, HARMADI,Hiroyuki HASHIGUCHI, and Toyoshi SHIMOMAI
1Department of Physics, Andalas University, Padang 25163, Indonesia
2Research Institute for Sustainable Humanosphere (RISH), Kyoto University, Uji, Kyoto 611-0011, Japan
3Remote Sensing Laboratory, Interdisciplinary Faculty of Science and Engineering Shimane University, Matsue 690-0823, Japan
ABSTRACT The diurnal variation in the vertical structure of the raindrop size distribution (RSD) associated with stratiform rain at Kototabang, West Sumatra (0.20°S, 100.32°E), was investigated using micro rain radar (MRR) observations from January 2012 to August 2016. Along with the MRR data, the RSD from an optical disdrometer and vertical profile of precipitation from the Tropical Rainfall Measuring Mission were used to establish the microphysical characteristics of diurnal rainfall.Rainfall during 0000-0600 LST and 1800-2400 LST had a lower concentration of small drops and a higher concentration of large drops when compared to rainfall during the daytime (0600-1800 LST). The RSD stratified on the basis of rain rate(R) showed a lower total concentration of drops and higher mass-weighted mean diameter in 0000-0600 LST and 1800-2400 LST than in the daytime. During the daytime, the RSD is likely governed by a riming process that can be seen from a weak bright band (BB). On the other hand, during 0000-0600 LST and 1800-2400 LST, the BB was stronger and the rainfall was associated with a higher concentration of midsize and large drops, which could be attributed to more active aggregation right above the melting layer with minimal breakup. Diurnal variation in the vertical profile of RSD led to a different radar reflectivity (Z)-R relationship in the rain column, in which Z during the periods 0000-0600 LST and 1800-2400 LST was larger than at the other times, for the same R.
Key words:diurnal variation,raindrop size distribution,micro rain radar,stratiform rain,Kototabang
1.Introduction
The diurnal cycle is one of the main components of atmospheric variation in the tropics, as a result of atmosphereocean-land interactions in response to solar radiation. In general, the amplitude of diurnal cycles on land is much larger than in ocean areas. On land, rainfall peaks tend to occur in the afternoon, while over oceans they tend to occur in the morning (Albright et al., 1981; Hamilton, 1981; Yang and Slingo, 2001; Tian et al., 2004). However, owing to the interaction of many factors, diurnal cycles can vary from one region to another. The rainfall peak in the afternoon is not only observed on land but also seen over oceans, such as in the eastern tropical Atlantic (Albright et al., 1985), the South Pacific convergence zone (Sui et al., 1997), and the middle and eastern tropical Pacific (Augustine, 1984). High rainfall peaks have also been observed in coastal areas-for example, in Sumatra-owing to the propagation of the rainfall peak from land, due to the movement of land-sea winds(Mori et al., 2004).
In addition to rainfall patterns, diurnal variation also affects the microstructure of precipitation, such as the raindrop size distribution (RSD), which can influence the accuracy of rainfall estimated using weather radar (Kozu et al.,2006). Different microphysical processes experienced by raindrops during the day and night in response to the difference in the intensity of solar radiation may generate different RSD characteristics on the ground (Radhakrishna et al.,2009). Kozu et al. (2006) observed strong diurnal variations in the RSD at Kototabang (Sumatra) and Gadangki(India) that were generated by land-ocean interaction. Marzuki et al. (2009, 2013a, 2016a) also observed diurnal variation in the RSD at Kototabang. Recently, Nauval et al.(2017) observed diurnal variation in the RSD at several locations in Indonesia. A typical picture of the diurnal cycle of a tropical RSD derived from previous observational studies is as follows: the RSDs in the morning hours of 0000-1200 LST are narrower than those in the evening (1200-2400 LST). The diurnal variations in the RSD lead to significant variation in radar reflectivity (Z)-rainfall rate (R) relations.Local convection in the afternoon plays an important role in generating a broader RSD (Kozu et al., 2006). Diurnal variations in the RSD are less observed in areas where the RSD is strongly influenced by the oceanic nature of rainfall, such as in Singapore (Kozu et al., 2006). Ushiyama et al. (2009)and Marzuki et al. (2018a) also observed weak diurnal variation in the RSD in Palau and over the Indian Ocean, respectively.
While there have been several studies on the diurnal variation in the RSD, such studies have mostly dealt with the diurnal variation in the RSD at the ground surface. To understand the microphysical process experienced by the RSD during a rain event, it is necessary to observe the vertical structure of the RSD on a diurnal basis. Furthermore, the vertical structure of the RSD is also important for latent heat studies and rainfall estimates that are obtained using weather radar (Li and Srivastava, 2001; Kumjian and Ryzhkov,2010).
This work investigated the vertical structure of the RSD at Kototabang, West Sumatra (0.20°S, 100.32°E), using a micro rain radar (MRR). Studies have been conducted on the vertical structure of the RSD at Kototabang (Kozu et al.,2005; Renggono et al., 2006; Marzuki, 2010). However,such studies only investigated the intraseasonal variation in the vertical profile of the RSD. Furthermore, the RSD was retrieved from a 47-MHz equatorial atmospheric radar(EAR), which is less sensitive to precipitation particles(Fukao et al., 2003). To overcome the limitations of previous studies, we analyzed data collected by an MRR-an instrument that operates at a frequency of 24 GHz, meaning it is strongly attenuated by raindrops during heavy rain. The measured spectra of an MRR can also suffer from aliasing errors, due to strong vertical winds. However, as long as the vertical wind is lower than 2 m s−1, the instrument can provide good estimates of the actual RSD, and hence the retrieved rain parameters (Peters et al., 2005). The vertical wind during stratiform rain at Kototabang is generally smaller than 1 m s−1(Marzuki et al., 2016a). Therefore, this work was limited to stratiform rain, which generally has an intensity of less than 10 mm h−1. Although not all types of rain are discussed in this paper, in the tropics, stratiform rain contributes to 73% of the area covered by rain and around 40% of the total rain amount (Schumacher and Houze, 2003). Thus, this research can serve as an important additional reference on the vertical structure of raindrops in the tropics, especially at Kototabang.
2.Data and methods
2.1.Site and instruments
The experiment was conducted at the Equatorial Atmosphere Observatory (EAO), which is located in Kototabang,West Sumatra, Indonesia (0, 20°S, 100, 32°E; 865 m above sea level). The experimental site lies in an equatorial zone that has two rainy seasons, in March-May and September-December (Aldrian and Dwi Susanto, 2003; Marzuki et al., 2016b). The average annual rainfall from an 11-year rain gauge observation at Kototabang was 2532 ± 355 mm yr−1(Marzuki et al., 2016b).
The RSD profile data were recorded by a vertically pointing MRR. The MRR is a frequency modulated continuous wave (FMCW) Doppler radar that is competitive with pulse radars with regard to range resolution when the same signal bandwidth is used. Unlike radars that detect the time delay of the returned pulse, most FMCW radars base their measurements on differences in instantaneous frequency between the received and transmitted signals. A detailed description of the MRR can be found in Peters et al. (2005).
Briefly, the RSD of the MRR is estimated using the spectral reflectivity densityη(D), which is divided by the single particle backscattering cross sectionσ(D) of a rain drop of diameterD:
whereη(D) is given by

The value ofη(v) in Eq. (2) is theη(D) with respect to velocity, and(h) is a height-dependent density correction for the fall velocity given by Peters et al. (2005):

Equation (2) is applied only in the raindrop size range 0.246 mm ≤D≤ 5.03 mm. From the RSD,Z,Rand the liquid water content (LWC) are computed as follows:


whereρwis the density of water, andis the terminal falling velocity given by Atlas et al. (1973):
The MRR at Kototabang has 31 range gates with a resolution of 150 m (Table 1). Thus, the altitudinal coverage of this instrument is 0.15-4.65 km above ground level (AGL).Owing to the noise and ground clutter (Peters et al., 2005),we excluded the data for altitudes lower than 300 m. The MRR installed at Kototabang shows good performance, particularly forR< 10 mm h−1(Marzuki et al., 2016c). We analyzed the data from January 2012 to August 2016 (1549 days), with a temporal resolution of one minute. There is an optical rain gauge (ORG) at the EAO. We only analyzed the MRR data if theRat the ground surface recorded by the ORG was more than 0.1 mm h−1. Simultaneous observations of the MRR and the ORG provided 8528 min of data.
This study also used RSD data from PARSIVEL(particle size velocity) optical disdrometer observations during 2012-16. TheZ-Rrelation derived from the MRR was compared with that governed by using the RSD from PARSIVEL observations. There are some limitations of PARSIVEL, such as the limited sampling area, spherical raindropassumption, and the possibility to have multiple drops passing through the sampling area at the same time (e.g.,Tokay et al., 2013). Nevertheless, PARSIVEL is a low cost,durable, and reliable instrument, so it is widely used. We applied several quality control procedures to minimize the measurement error of PARSIVEL. The data from the first two size bins were discarded, and thus we constructed the RSD at 1-min intervals from 0.3 to 10 mm. We also disregarded very light rain (R< 0.1 mm h−1) and minutes with fewer than 10 drops. Additionally, we adopted a threshold of fall speed using Atlas’ empirical velocity [Eq. (7)] and retained the drops within ± 60% of the empirical velocity.All quality control procedures have been used in some previous works based on Kototabang data, such as in Marzuki et al. (2013b). Recently, Marzuki et al. (2018c) showed the accuracy of PARSIVEL at Kototabang to measure rainfall,by comparing the daily rainfall with that obtained by ORG.In this study, we also used ORG to evaluate the performance of PARSIVEL. We only analyzed PARSIVEL data if daily rainfall from PARSIVEL was in good agreement with the rainfall from ORG. Simultaneous observations of the MRR, ORG, and PARSIVEL provided 7020 min of data.
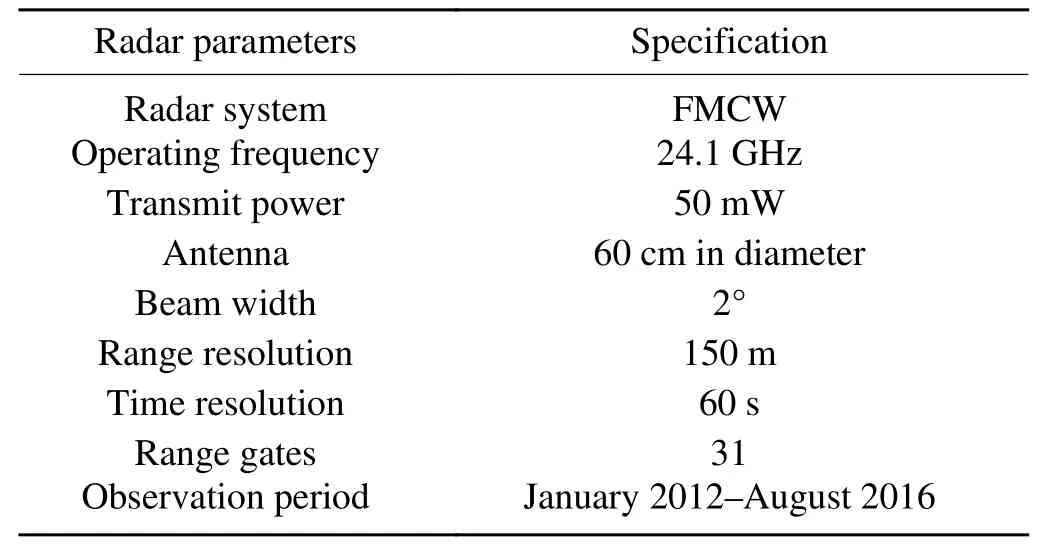
Table 1. Specification of the MRR at Kototabang.
In addition to vertical profile ofZfrom the MRR, that from the Tropical Rainfall Measuring Mission (TRMM)2A25-Precipitation Radar product over a four-year time span (2012-15) was also used, to discuss the possible microphysical processes affecting the RSD during the falling of raindrops to the ground. Only the TRMM 2A25 profiles with an incidence angle of less than 7° on either side of nadir were used (Geerts and Dejene, 2015; Marzuki et al.,2018d).
2.2.Methods
Stratiform rain was extracted from the MRR data based on the existence of a melting layer or bright band (BB). Several methods can be used to detect the BB from the MRR data, but we used the gradient of falling velocity (GVF) as the BB indicator, following the method proposed by Wang et al. (2017). The accuracy of this method was determined visually for each profile in such a way that the stratiform rain was marked by the appearance of the BB. Figure 1 shows the height distribution of the 8528-min data that were classified as stratiform. The existence of a BB can be observed clearly from theZ, falling velocity and LWC. The BB top varied, but generally it lay at 4.05 km, which is consistent with previous research on the melting layer height at Kototbang. Marzuki et al. (2013a) classified precipitation at Kototabang using wind profilers and found the melting layer height to be around 4 km AGL. Recently, Marzuki et al. (2018b) analyzed the climatology of the melting layer at Kototabang using 17 years of TRMM 2A25 data and found the average annual melting layer height to vary from 3.92 to 4.11 km AGL. The melting layer heights from radars were also consistent with the 0°C isotherm level derived from the average temperature profile from radiosonde observations(figure not shown).
The data were classified into severalRcategories-namely, very light (0.1 ≤R< 1 mm h−1), light (1 ≤R< 2 mm h−1), moderate (2 ≤R< 5 mm h−1), and heavy (5 ≤R<10 mm h−1) stratiform rain; plus, four non-overlapping LST time spans-namely, 0000-0600, 0600-1200, 1200-1800,and 1800-2400 LST, following Kozu et al. (2006). Table 2 summaries the distribution of the data for each category.
The RSD was parameterized by the modified gamma distribution (Kozu and Nakamura, 1991; Tokay and Short,1996), which is given by

Fig. 1. Height distribution of 8528 min of data classified as stratiform rain from simultaneous observations of the MRR and ORG, for (a) Z, (b) falling velocity, and (c) LWC. The purple lines indicate the BB bottom and top heights.

Table 2. Distribution of data for several R categories on a diurnal basis.

whereN(D) is the RSD (units: m−3mm−1),NTis the total raindrop concentration (units: m−3),μis the shape parameter,Λis the slope (units: mm−1), Γ(x) is the complete gamma function, andDis the raindrop diameter (units: mm). The parameters of the gamma RSD were calculated by the moment method. In this work, we used the moments ofM3,M4andM6, as integral rainfall parameters for remote sensing applications are mainly proportional to these moments (Kozu and Nakamura, 1991). Each gamma RSD parameter was obtained as follows (Tokay and Short, 1996):


whereDmis the mass-weighted mean diameter, which is expressed by

Weather radars usually estimate theRfrom theZdata using aZ-Rrelation. The empiricalZ-Rrelation is a power law form given by

whereAandbare unknown constants. These constants are dependent on the shape of the RSD. In this study, the linear regression betweenZandRon a logarithmic scale governs theZ-Rrelation. The sequential intensity filtering technique (Lee and Zawadzki, 2005) was used to reduce the spurious variability of the MRR and PARSIVEL data.
3.Results
3.1.Vertical profile of average RSD
Figure 2 shows the vertical profile of the RSD for severalRcategories. Above 3 km AGL, the concentration of small-sized drops (D< 0.5 mm) was very high [N(D) > 104m−3mm−1], and this contributed to the high value of LWC(Fig. 1c). In general, the growth of raindrops was observed throughout the day, but the growth during 0000-0600 LST was stronger than that during other times. For very light rain(0.1-1 mm h−1), and at altitudes of 0.45-3 km AGL (Figs.2a-d), during the periods 0000-1200 LST and 1800-2400 LST, raindrops with sizes larger than 1 mm tended to be constant or grow slightly with height. ForD= 2 mm, the RSD on a logarithmic scale at 3 (0.6 km) for the periods 0000-0600, 0600-1200, 1200-1800 and 1800-2400 LST was 0.005 (0.29), −0.2013 (0.17), 0.097 (0.50) and 0.12(0.39) m−3mm−1, respectively. ForD= 0.5 mm, the RSD on a logarithmic scale at 3 (0.6 km) for 0000-0600,0600-1200, 1200-1800 and 1800-2400 LST was 2.45(2.58), 2.54 (2.53), 2.82 (2.89) and 2.62 (2.36) m−3mm−1,respectively. Thus, a slight increase in the concentration of small sized-drops (D< 0.5 mm) with height was also observed, except during the period 1800-2400 LST. This condition was also clearly illustrated by the average RSD value for several heights (Fig. 3).
For higherR, the diurnal variation in raindrop growth was more significant (Figs. 2e-p). There were no data for the heavy rain category during 0600-1200 LST. During this period, precipitation was seldom observed at Kototabang(Marzuki et al., 2016b). For heavy rain (5-10 mm h−1), as for very light rain, the concentration of small-sized drops (D< 0.5 mm) above 3 km AGL was very high [N(D) > 104m−3mm−1]. For an altitude of 0.45-3 km AGL, during 0000-0600 LST, raindrops underwent significant growth(Fig. 2m). For example, forD= 2 mm, the RSD on a logarithmic scale at 3 (0.6 km) for the periods 0000-0600,1200-1800 and 1800-2400 LST was −0.087 (0.28), 0.31(0.35) and 0.12 (0.29) m−3mm−1, respectively. Furthermore,a decrease in the concentration of small sized-drops (D<0.5 mm) with height was also observed for all time periods except during 1800-2400 LST. At 3 km, the RSD of 0.5-mm raindrops on a logarithmic scale for the periods 0000-0600, 1200-1800 and 1800-2400 LST was 2.51, 2.74 and 2.28 m−3mm−1, respectively, and the values decreased or increased to 2.11, 2.62 and 2.63 m−3mm−1at 0.6 km.This feature was more clearly illustrated by the average RSD value for several heights (Fig. 4). The downward increase in the concentration of large-sized raindrops (D> 2 mm) coincided with the downward decrease in the concentration of small-sized raindrops (D< 0.5 mm). Thus, coalescence may be the dominant microphysical process for thisRcategory (Rosenfeld and Ulbrich, 2003). This is quite surprising because collision-coalescence is generally unimportant atRvalues lower than about 25 mm h−1(Hu and Srivastava,1995).
3.2.Vertical profile of RSD parameters
Figure 5 shows the vertical structure of the gamma RSD. In general, a downward increase inμandDmand a downward decrease inNTwere clearly observed. For very light rain (Figs. 5a-c), theμat 3 (0.45 km) for the periods 0000-0600, 0600-1200, 1200-1800 and 1800-2400 LST was −2.70 (−1.54), −2.49 (−1.61), −2.79 (−1.62) and −2.73(−1.15), respectively. Furthermore, theDmat 3 (0.45 km)was 0.69 (1.21), 0.63 (0.99), 0.63 (1.13) and 0.69 (1.34)mm. Thus, theDmfor 0600-1200 LST at the ground was smaller than that at the other times, indicating a smaller number of large drops, which is consistent with Fig. 2. The largestNTwas observed during the period 1200-1800 LST.TheNTat 3 (0.45 km) for the periods 0000-0600,0600-1200, 1200-1800 and 1800-2400 LST was 2384(797), 2488 (1089), 3843 (1516) and 2711 (638) m−3, respectively.
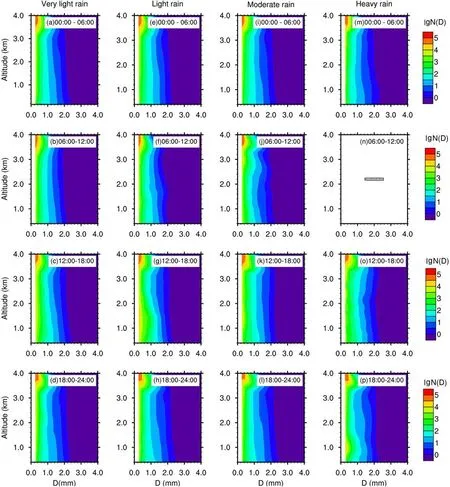
Fig. 2. . Diurnal variation in the average vertical profile of the RSD for very light (0.1 ≤ R < 1 mm h−1), light (1 ≤ R < 2 mm h−1),moderate (2 ≤ R < 5 mm h−1), and heavy (5 ≤ R < 10 mm h−1) stratiform rain. There were no data during 0600-1200 LST for the heavy rain category.
All the RSD gamma parameters near the ground surface from stratiform rain varied withR. The value of the RSD gamma parameter associated with heavy rain (Figs.5j-l) was slightly larger than that of very light rain (Figs. 5a and b). This is typical of RSD characteristics in the tropics(Tokay and Short, 1996; Marzuki et al., 2010, 2013a). For heavy rain, parameterμat 3 (0.45 km) for the periods 0000-0600, 1200-1800 and 1800-2400 LST was −2.68(−1.09), −2.45 (−1.16) and −2.71 (−1.30), respectively. The smallestμat the ground surface was observed during the period 1200-1800 LST, indicating a high concentration of small drops. TheDmat 3 (0.45 km) was 0.64 (1.47), 0.75(1.10) and 0.71 (1.13) mm. Thus, theDmat the ground for the period 1200-1800 LST was smaller than that at the other times, indicating a smaller number of large drops,which is consistent with Fig. 2. TheNTat 3 (0.45 km) for the periods 0000-0600, 1200-1800 and 1800-2400 LST was 2596 (336), 4159 (1121) and 2261 (854) m−3, respectively. Thus, the largestNTthroughout the rain column(0.45-3 km) was observed during the period 1200-1800 LST.

Fig. 3. Diurnal variation in the average RSD for several heights for very light rain (0.1-1 mm h−1).
The aforementioned results show that the diurnal variation in the RSD of stratiform rain is obvious. The highest drop concentration (NT) was observed during the period 1200-1800 LST, and the RSD in this period contained a large number of small drops and a small number of large drops, such that theμandDmwere smaller at the surface.The smaller number of large drops of stratiform rain during the period 1200-1800 LST, as indicated by the smallDm(Figs. 5c, f, i and l), resulted in a smallerZat the surface during this period (Fig. 6), except for heavy rain (Fig. 6d). This is different to convective rain, for which largeZvalues are frequently observed during the period 1200-1800 LST, indicating intense convection (Marzuki et al., 2016a). Note that the GVF was used as the BB indicator in this work. Although the BB is not very clear in Fig. 6d, the vertical profile of the falling velocity shows the occurrence of a BB for all rainfall intensities (Fig. 7).
The BB strength plays an important role in determining the number and size of raindrops (Wang et al., 2017).To see the strength of BB (ΔZ), we calculated ΔZby averaging the reflectivity gradient within the BB (Huggel et al.,1996). Figure 8 is a 2D scatterplot between theDmand ΔZ.The linear regression equation between the two parameters for the periods 0000-0600, 0600-1200, 1200-1800 and 1800-2400 LST wasDm= 0.101ΔZ+ 0.653 (r= 0.37),Dm= 0.040ΔZ+ 0.879 (r= 0.21),Dm= 0.054ΔZ+ 0.923 (r=0.20) andDm= 0.108ΔZ+ 0.744 (r= 0.36), respectively.Thus, the relationship betweenDmand ΔZduring 0000-0600 and 1800-2400 LST was stronger than that dur-ing other periods. If the four equations are plotted together,we can see clearly that, for the same ΔZ, the value ofDmduring 0000-0600 and 1800-2400 LST was larger than that during 0600-1800 LST.
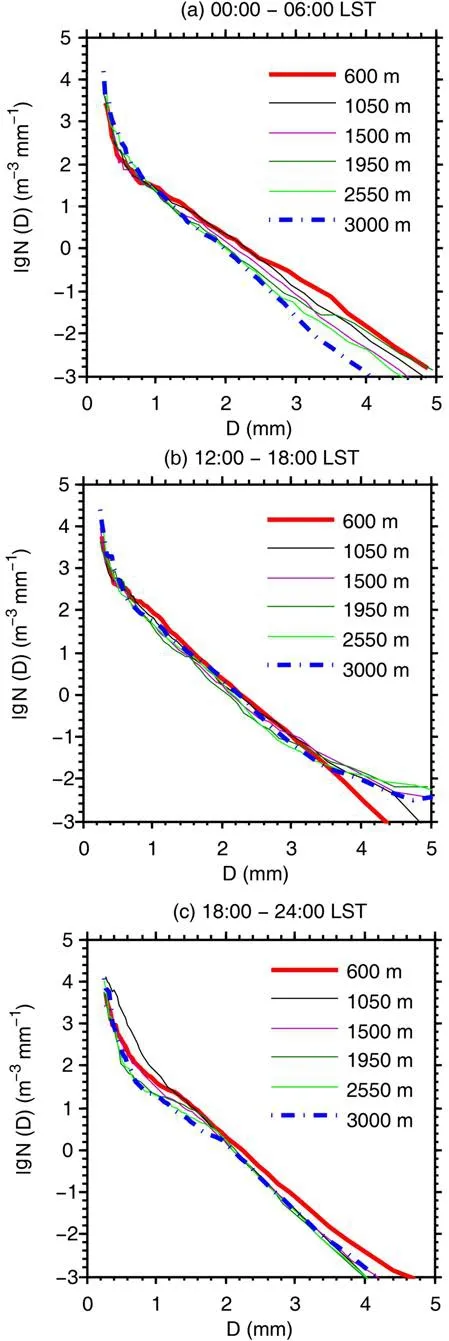
Fig. 4. Diurnal variation in the average RSD for several heights for heavy rain (5-10 mm h−1). There were no data during 0600-1200 LST for this rain category.
The characteristics of the diurnal variation in the BB from the MRR were consistent with those obtained from the TRMM 2A25 data. We calculated the strength of the BB at Kototabang using the TRMM data during 2012-15. For very light rain (R< 1 mm h−1), the ΔZfor the periods 0000-0600, 0600-1200, 1200-1800 and 1800-2400 LST was 3.86, 2.85, 2.85 and 4.05 dBZ, respectively. Furthermore, the ΔZfor heavy rain (5-10 mm h−1) was 4.09, 2.46,2.48 and 3.53, respectively. Thus, during the daytime(1200-1800 LST), the BB was weaker than at other times,and the RSD was number controlled, which is governed predominantly by a riming process (Sarma et al., 2016). A weak BB during 1200-1800 LST is associated with many small drops (Huggel et al., 1996), which can be also seen from the largeNTand smallDm. On the other hand, during the periods 1800-2400 LST and 0000-0600 LST, the BB was stronger, and a strong BB is associated with larger drops (largeDm), which are attributable to more active aggregation right above the melting layer (Fabry and Zawadzki,1995; Huggel et al., 1996; Zawadzki et al., 2005).
3.3.Vertical profile of the Z-R relation
Figure 9 shows the vertical profiles of coefficientsAandbof theZ-Rrelation on a diurnal basis for stratiform rain at Kototabang. In general, coefficientAincreased with decreasing height, whilebdecreased. This feature is similar to typical values ofAandbfor stratiform rain (Cifelli et al.,2000). TheZ-Rat the altitude of 3.0 km wasZ= 424R1.83,which changed toZ= 433R1.25near the surface (0.45 km).TheZ-Rrelation of the near surface was close to that obtained from the PARSIVEL data (Z= 413R1.29) at the ground level. Thus, coefficientsAandbwere not constant for each altitude, so the use of the Marshall-Palmer relation-namely,Z= 200R1.6-for each height, can affect the accuracy of the rain estimate using weather radar observations.
CoefficientAand exponentbshowed a significant diurnal variation as a result of the variation in the RSD. At the near surface (0. 45 km), coefficientA(b) for the time periods 0000-0600, 0600-1200, 1200-1800 and 1800-2400 LST was 456 (1.35), 352 (1.25), 346 (1.18) and 482 (1.26),respectively. A similar pattern was also observed from the PARSIVEL data, in which coefficientA(b) for the aforementioned periods, respectively, was 379 (1.34), 322 (1.23), 379(1.31) and 465 (1.29). For the sameR, theZ-Rrelationships derived from both the MRR and PARSIVEL data resulted in a slightly largerZduring 0000-0600 and 1800-2400 LST than the other time periods, which is consistent with Fig. 6. CoefficientAis the intercept of theZ-Rrelation line and it is determined by the shape of the RSD and in particular from theZ. A large value for coefficientAis associated with more large-sized drops, leading to largerZandDmvalues for the sameR. Thus, for the sameR, the RSD of strati-form rain for the time period 1200-1800 LST had a smaller number of large drops than that for the other time periods.However, the total concentration of raindrops during the period 1200-1800 LST was much higher than at the other times (Fig. 5).

Fig. 5. Average RSD gamma parameters for (a) very light (0.1 ≤ R < 1 mm h−1), (b) light (1 ≤ R < 2 mm h−1), (c) moderate(2 ≤ R < 5 mm h−1), and (d) heavy (5 ≤ R < 10 mm h−1) stratiform rain. There were no data during 0600-1200 LST for the heavy rain category.
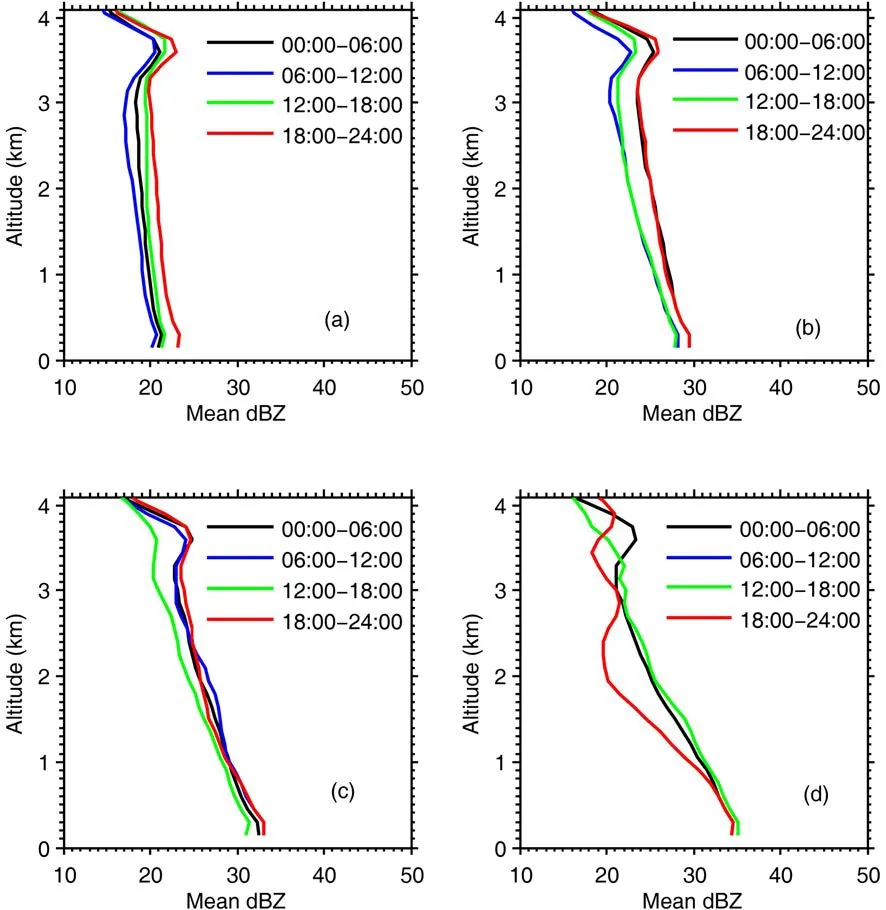
Fig. 6. Average Z from the MRR for (a) very light (0.1 ≤ R < 1 mm h−1), (b) light (1 ≤ R < 2 mm h−1), (c) moderate(2 ≤ R < 5 mm h−1), and (d) heavy (5 ≤ R < 10 mm h−1) stratiform rain. There were no data during 0600-1200 LST for the heavy rain category.
CoefficientAduring the day (1200-1800 LST) was smaller than during the other periods, throughout the rain column (0.45-3 km). Its value at 3 (1.5 km) for the periods 0000-0600, 0600-1200, 1200-1800 and 1800-2400 LST was 406 (351), 223 (338), 381 (243) and 505 (497), respectively. During the daytime, the BB was weaker than at other times, and a weak BB is associated with smaller drops, due to the riming process of snow that leads to smallerZandAvalues. On the other hand, during 0000-0600 and 1800-2400 LST, the BB was stronger than at other times,which indicates the appearance of more active aggregation right above the melting layer (Fabry and Zawadzki, 1995;Huggel et al., 1996; Zawadzki et al., 2005). Besides the strength of the BB, variation in the melting layer height can also affect the RSD at the ground because it is closely related to aggregation and riming above the melting layer and drop sorting and collision coalescence below the melting layer (Rosenfeld and Ulbrich, 2003). However, the difference in the melting layer height for each time period at Kototabang was small (~100 m) (Fig. 10) and may not have caused any significant difference in the RSD. A small variation in the melting layer height was also observed by the MRR (Fig. 6). The mean BB top height from MRR observations for 0000-0600, 0600-1200, 1200-1800 and 1800-2400 LST was 4.06, 3.99, 4.10 and 4.11 km, respectively.
Because the values ofbandAdecrease and increase with decreasing height, respectively, the microphysical processes that affect the raindrop growth of stratiform rain at Kototabang are evaporation and coalescence (Wilson and Brandes, 1979). Evaporation is dominant for light rain and collision-coalescence is dominant for heavy rain. A breakup process can also cause an increase in the number of small drops and a decrease in the number of large drops.However, if breakup occurs, there must be a consequent decrease inDmand an increase inNT. Furthermore, there must be a small change inμwith a tendency towards a decrease. The end result of the breakup process is a decrease inAand a small increase inb(Rosenfeld and Ulbrich, 2003). All of these facts were not observed in the RSD (Fig. 2) and gamma parameters (Fig. 5). Thus, breakup is not the dominant process affecting the RSD of stratiform rain at Kototabang.

Fig. 7. As in Fig. 6 but for mean falling velocity.
Updrafts may also cause a decrease in the number of small drops by carrying small raindrops to higher altitudes(Seela et al., 2017). Marzuki et al. (2016a) analyzed updrafts at Kototabang using vertical wind data from EAR observations. We classified the data in Marzuki et al.(2016a) on a diurnal basis (figure not shown). A stronger updraft was observed during 1200-2400 LST, but the difference in the updraft strength for each time period at Kototabang was small and may not have caused any significant difference in the RSD. Furthermore, the updrafts during stratiform rain are weak and only strong updrafts can lift large hydrometeors to higher altitudes (Heymsfield et al., 2010).
Apart from RSD (Fig. 4), the role of collision-coalescence can also be seen from the vertical profile ofZ. The role of collision-coalescence can be observed from theZgradient in the rain column (0.45-3 km AGL) (Fig. 6).BecauseZis proportional toD6, it is therefore more sensitive to large drops. Accordingly, a downward increase inZmay indicate a downward increase in large drop numbers,especially in heavy rain. Figure 11 shows the mean vertical profile ofZat Kototabang from TRMM PR 2A25 during 2012-15. A more positive gradient was observed during 1200-1800 LST, particularly for moderate and heavy rains,which indicates more raindrop growth due to collision-coalescence than at the other times. The consequence of coalescence isDmmust increase andNTmust decrease. Furthermore, coalescence also causes an increase inAand small decrease inbof theZ-Rrelation (Rosenfeld and Ulbrich,2003). A similar pattern was obtained in this work, particularly for moderate and heavy rains (Figs. 5 and 9). While the growth of raindrops due to collision-coalescence was likely stronger during 1200-1800 LST, a higherDmat the ground surface was observed during 0000-0600 and 1800-2400 LST (Fig. 5). The large raindrops during 0000-0600 and 1800-2400 LST were likely the result of the melting of the larger snowflake aggregates with minimal breakup. In addition to Fig. 8, a stronger BB during 0000-0600 and 1800-2400 LST can be clearly observed from Fig. 11, as indicated by the larger maximumZin the BB. Furthermore, just below the BB (3.0-2.5 km), the value ofZduring 0000-0600 and 1800-2400 LST was also larger than that during 1200-1800 LST.

Fig. 8. Relationship between ΔZ and Dm for the altitude of 0.45 km, on a diurnal basis.
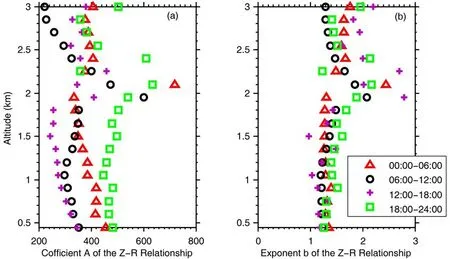
Fig. 9. Vertical distribution of (a) coefficient A and (b) coefficient b of the Z-R relationship on diurnal basis.

Fig. 10. Mean melting layer height at Kototabang in km above sea level from TRMM PR 2A25 during 2012-15.
4.Conclusions
The vertical structure of the RSD of stratiform rain at Kototabang shows strong diurnal variation. The concentration of raindrops in the afternoon (1200-1800 LST) is much larger than those at other times. Moreover, the RSD in the afternoon consists of a larger concentration of small drops and a lower concentration of large drops. This difference is due to the differences in the growth process of the raindrops. During the period 1200-1800 LST, the riming process is dominant, whereas aggregation is dominant in the morning (0000-0600 LST), which can be inferred from the BB strength. In addition, the differences are also due to the differences in the evolution of the raindrops. Besides spontaneous growth, coalescence seems to occur at all intensities of stratiform rain at Kototabang. The diurnal variation in the vertical profile of the RSD has an impact on the rainfall estimate obtained with weather radar. CoefficientAof theZ-Rrelation decreases with decreasing altitude, and the smallest value is observed during the period 1200-1800 LST. Thus,estimation ofRusing a fixedZ-Rrelation can result in large errors, even for stratiform rain.
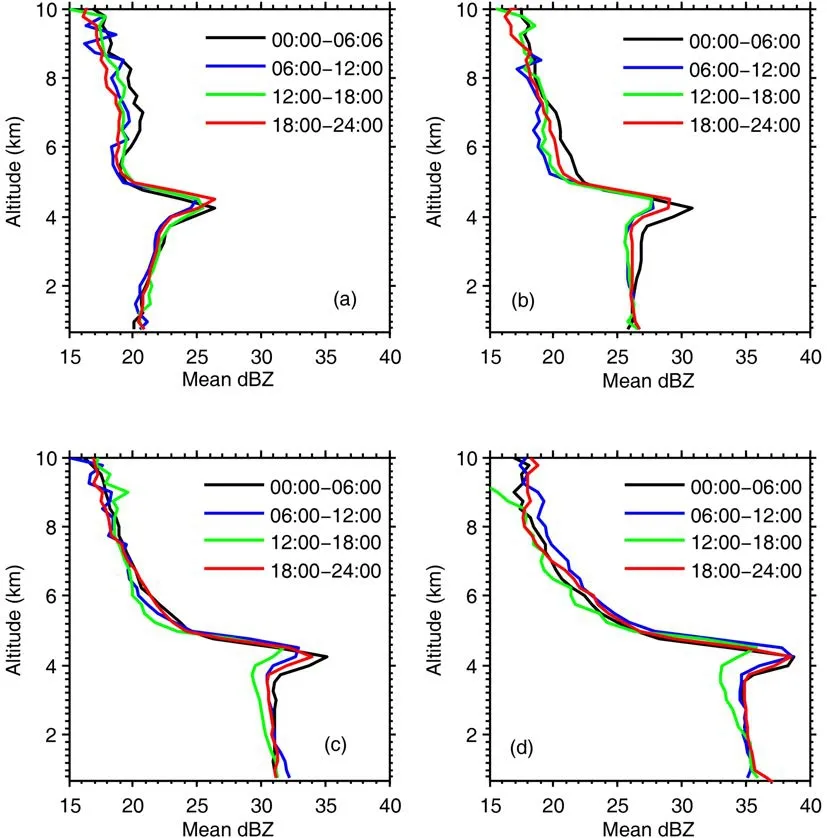
Fig. 11. Mean vertical profile of Z at Kototabang from TRMM PR 2A25 during 2012-15.
Acknowledgements.This study was supported by the 2019 Basic Research Grants from the Ministry of Research, Technology and Higher Education (Grant No. T/3/UN.16.17/PT.01.03/PD-Kebencanaan/2019). The observations made by the MRR at Kototabang during the rain event were supported by RISH, Kyoto University.
 Advances in Atmospheric Sciences2020年8期
- Advances in Atmospheric Sciences的其它文章
- Erratum to: Estimate of Hydrofluorocarbon Emissions for 2012-16 in the Yangtze River Delta, China
- Automatic Identification of Clear-Air Echoes Based on Millimeter-wave Cloud Radar Measurements
- Insights into Convective-scale Predictability in East China: Error Growth Dynamics and Associated Impact on Precipitation of Warm-Season Convective Events
- Impacts of Multigrid NLS-4DVar-based Doppler Radar Observation Assimilation on Numerical Simulations of Landfalling Typhoon Haikui (2012)
- Investigating Lightning Characteristics through a Supercell Storm by Comprehensive Coordinated Observations over North China
- Roles of Wind Stress and Subsurface Cold Water in the Second-Year Cooling of the 2017/18 La Niña Event