Control factors of DIC in the Y3 seamount waters of the Western Pacifi c Ocean*
MA Jun , SONG Jinming , , LI Xuegang , , YUAN Huamao , LI Ning , DUAN Liqin , WANG Qidong
1 CAS Key Laboratory of Marine Ecology and Environmental Sciences, Institute of Oceanology, Chinese Academy of Sciences, Qingdao 266071, China
2 Marine Ecology and Environmental Science Laboratory, Qingdao National Laboratory for Marine Science and Technology, Qingdao 266237, China
3 University of Chinese Academy of Sciences, Beijing 100049, China
4 Center for Ocean Mega-Science, Chinese Academy of Sciences, Qingdao 266071, China
Abstract An investigation was carried out in the Y3 seamount area of the Western Pacifi c Ocean in December 2014, and the distribution of dissolved inorganic carbon (DIC) and its relationship with environmental factors in this area were explored. The results show that DIC concentration was higher in the adjacent waters of the Y3 seamount area, and the uplift of DIC isolines at the stations was close to the seamount. Meanwhile, interaction between the North Equatorial Current (NEC) and the Y3 seamount affected the DIC distribution, i.e., the upwelling in the same direction of the NEC was obvious, resulting in a decreasing trend of average concentration of DIC in the 200 m water column from the top to the two sides in this direction but in the cross direction. The DIC concentration increased with the water depth increase, and its distribution was affected by various environmental factors. In the surface water, high temperature was a decisive factor for the decrease of the DIC concentration, but the photosynthesis of phytoplankton showing only a weak influence. In the North Pacifi c Tropic Water (NPTW), DIC production rate from organic matter decomposition was higher than that of DIC consumption by phytoplankton photosynthesis, leading to a continual increase of DIC. In the North Pacifi c Intermediate Water (NPIW), organic matter decomposition played a leading role in the increase of DIC. In the deep water, decomposition of organic matter weakened, and the dissolution of CaCO 3 controlled the carbonate system, and DIC had the smallest variation range.
Key word: dissolved inorganic carbon (DIC); Western Pacifi c Ocean; Y3 seamount; water masses; environmental factors
1 INTRODUCTION
The ocean is the largest carbon pool on the earth and plays an important role in the global carbon cycling. Inorganic carbon and organic carbon constitute the marine carbon pool, and dissolved inorganic carbon (DIC) accounts for more than 95% of the total carbon in the ocean; and DIC is the main component of the marine carbonate system (Sabine et al., 2004; Song, 2010; Lu et al., 2016). The DIC distribution and the influencing factors are a hot research object in the modern oceanography, and the research will help to explain the process and internal mechanism of the global carbon cycle and reveal the mechanism of migration and transformation of matter in seawater (Thomas et al., 2004).
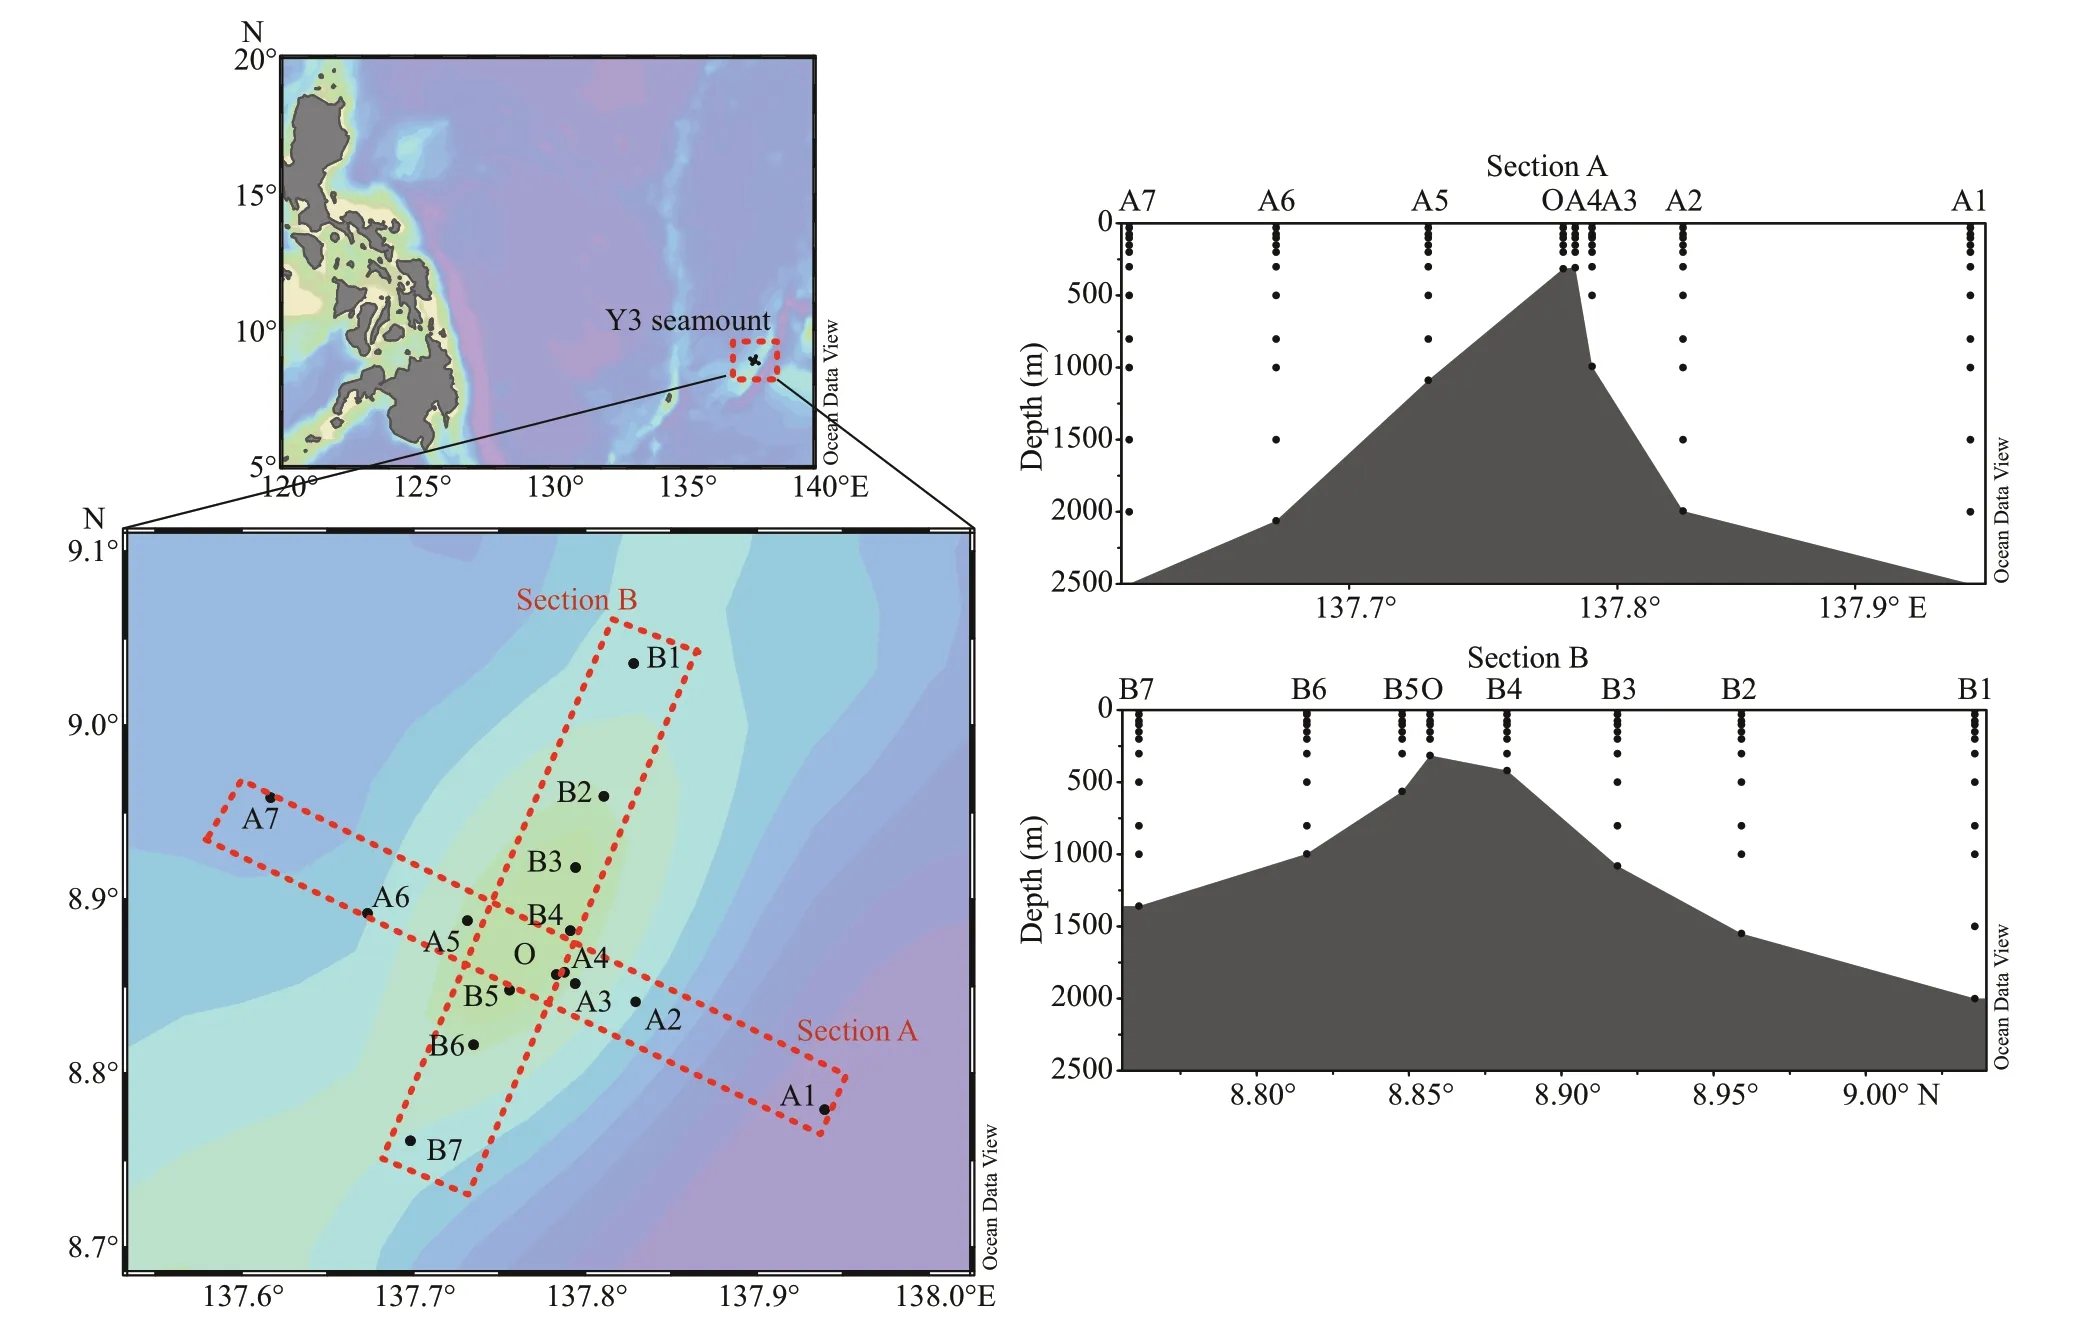
Fig.1 Deployment of the sampling stations in the Y3 seamount area
A seamount is a typical landform in the ocean as an underwater mountain that rise hundreds or thousands of meters from the seafloor but does not reach to the water surface (Ma et al., 2018; Ma et al., 2019a). Having such a unique topography, the hydrological environment in a seamount area reflects a relatively isolated ecosystem, in which the matter distribution and the community composition are different from the surrounding areas (Clark et al., 2010). At present, many studies have confi rmed that in the most seamounts, nutrient concentration, chlorophyll a content, and biomass increases signifi cantly, which is called “seamount effects” (Dower et al., 1992; Mourino et al., 2001; Genin, 2004). However, research on DIC in the seamount areas still lacks, and whether seamounts have a signifi cant impact on DIC distribution remains unanswered.
We studied the Y3 seamount area of the Western Pacifi c Ocean based on our comprehensive investigation in the area in December 2014. Distribution of DIC and the signifi cance of seamounts for the DIC distribution were analyzed, and the control factors in the DIC distribution in different water masses determined. The study may provide a theoretical basis and reference for the future study of DIC in the seamount areas in the ocean.
2 MATERIAL AND METHOD
2.1 Study area
The Y3 seamount area is located in the Western Pacifi c Ocean east of the Philippines at 8.76°N–9.04°N / 137.62°E–137.94°E. Hydrology of this area is very complicated. The upper water is affected by the North Equatorial Current (NEC) (Toole et al., 1988; Hu et al., 2015). On December 3, 2014, a 36-day survey was conducted in the Y3 seamount area onboard the R/V Science. Fifteen stations were set up in lengthwise (Section B) and widthwise (Section A) directions meeting at the Station O at the peak of the Y3 seamount (Fig.1).
2.2 Sampling and analytical methods
To avoid the tidal influence on the distribution of various parameters, samples were collected from 8 pm to 6 am every week. In each station, water samples were collected at 0, 30, 75, 100, 150, 200, 300, 500, 800, 1 000, 1 500, and 2 000 m and the bottom layer using a Niskin water sampler (KCDenmark, Denmark). Temperature ( T), salinity ( S), DIC, pH, total alkalinity (TAlk), chlorophyll a (chl a), and dissolved oxygen (DO) were measured on-board in accordance with the China’s national standard of Specifi cation for Oceanographic Survey (GB12763.6-2007). Details of sampling and analytical methods are as follows:
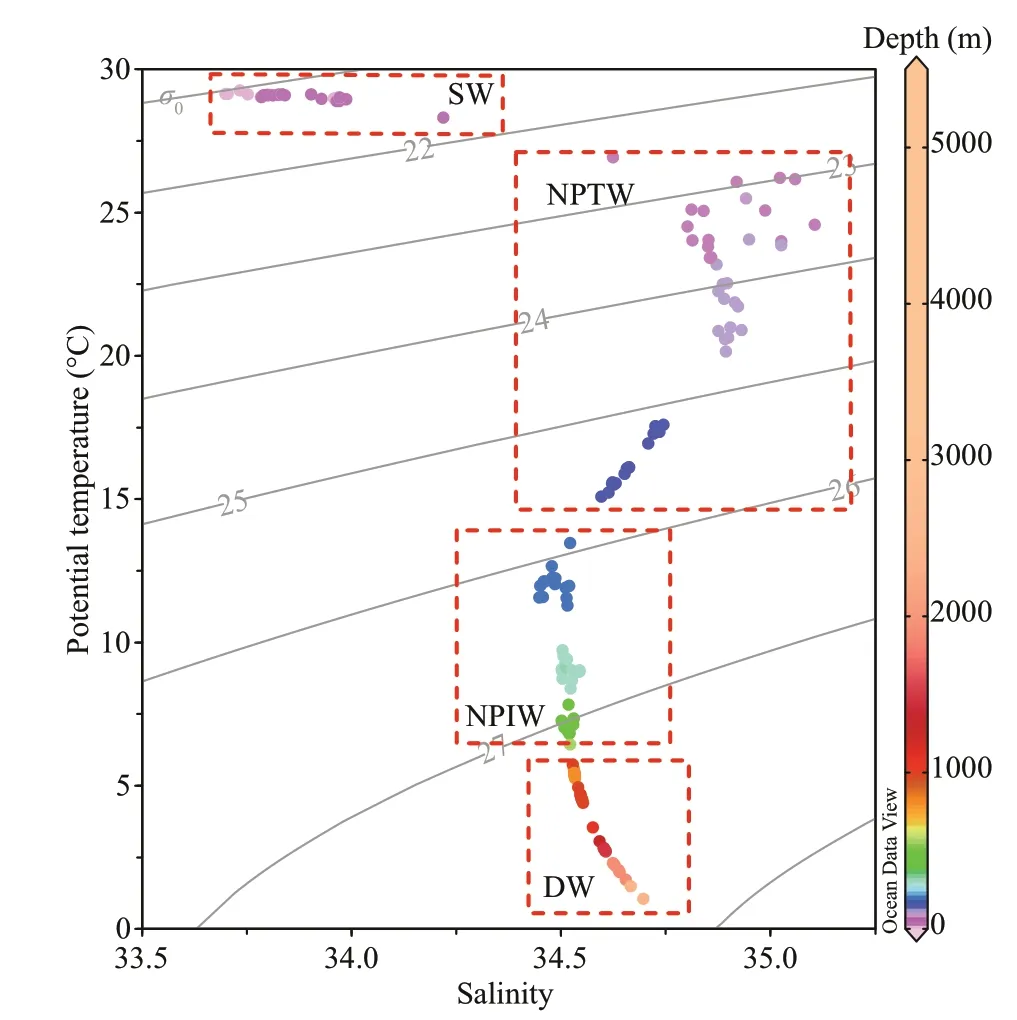
Fig.2 Distribution of water masses at different depths in the Y3 seamount area
T and S: simultaneous measurement using a CTD (Sea-bird SBE911, USA) with water sample collection.
pH: 50-mL water sample was sampled in each layer and measured directly using a pH meter (Thermo Scientifi c Orion 5-star, USA) and an electrode (Ray Magnetic E-201-D, China) at ±0.002. The electrode was calibrated with diaminopyridine-hydrochloric acid standard buffer solution and tris (hydroxymethylamino) methane every 24 h.
TAlk: 125-mL water was sampled for each layer in a ground-glass bottle, fi xed with 2 drops of saturated mercury chloride solution, and stored at 4°C for later laboratory measurement. The TAlk concentration was measured with an open cell titration using a fully automatic potentiometric titrator (Metrohm 905 Titrando, Switzerland). The measurement results were calibrated with the standard seawater (Dockson, BATCH #134) at 0.002 5 (±5 μmol/kg) (Dickson et al., 2007; Lu et al., 2016).
Chl a: 2 000-mL water was sampled for each layer, for which zooplankton was fi ltered out through a 200-μm sieve and a 0.7-μm fi lter (Whatman GF/F, UK), and then was placed and covered with aluminum foil at 20°C for later laboratory measurement. The samples were extracted with 90% acetone for 12–24 h, and the concentration was measured using a Turner fluorometer (Turner Designs, USA) (Zhang et al., 2016; Ma et al., 2019a).
DO: 50-mL water was samples for each layer with a brown iodine volumetric flask, fi xed with manganese sulfate and an alkaline potassium iodide solution, and measured in situ with a Winkler iodometry at relative standard deviation of ≤ 2% (Zuo et al., 2018).
3 RESULT AND DISCUSSION
3.1 Water mass
As shown in the T- S relationship graph (Fig.2) and previous reports (Hu et al., 2015; Ma et al., 2019b), water masses in this area could be divided into four categories, namely, surface water (SW), North Pacifi c Tropic Water (NPTW), North Pacifi c Intermediate Water (NPIW), and deep water (DW). The SW was located in water depth of 0–50 m and characterized by high T and low S (29.05°C and 33.86 on average). The NPTW was situated in the water depth of 75–150 m, featured with high S (34.6–35.11, on average of 34.82). The NPIW rested at the water depth of 200–800 m, typifi ed with large T variation but small S change (5.33–13.5°C; and 34.51 on average). The DW could be illustrated at the water depth >1 000 m with low T (1.87–5.83°C, on average of 3.62°C) (Table 1).
3.2 Distribution and variation of DIC
DIC concentration in the Y3 seamount area ranged 2 137–2 401 on average of 2 265 in μmol/kg. Overall, with water depth increase, the DIC concentration increased gradually (Table 1, Fig.3). In the SW, the DIC concentration was the lowest, increased gradually with water deepening, and ranged 2 137–2 222 on average of 2 177 in μmol/kg. In the NPTW, it remained stable in the range of 2 178–2 286 on average of 2 243 in μmol/kg. In the NPIW, DIC concentration increased signifi cantly with the water depth with the largest range of 2 230–2 357 on average of 2 293 in μmol/kg. In the DW, DIC concentration was the highest, and the variation range was the smallest in the range of 2 326–2 400 on average of 2 358 in μmol/kg.
It was sure that the geomorphology of Y3 seamount affected the DIC distribution. In Section A, a clear rise was shown in DIC contour lines at the stations A2, A3, A4, O, and A5 near the peak of the seamount (Fig.3a & c). DIC concentration near seamount was muchhigher than those areas beyond at the same water depth. Particularly, the seamount influence on DIC distribution could extend to the depth of 50–200 m in the euphotic zone, indicating a certain impact on the growth of phytoplankton (Fig.3c). In Section B, DIC concentration at the Stations B4, O, and B5 near the peak region was signifi cantly higher than those of other stations at depth of about 500 m. However, the seamount influence on the DIC distribution in the euphotic zone was weak (Fig.3b & d).
And then this morning, I walked you up the steep hill to your classroom with a picture of the president on one wall and of Bambi on the opposite. You found the coat hook with your name above it right away, and you gave me one of your characteristically fierce, too-tight hugs. This time you were ready to let go before I was.

Table 1 Distribution of T, S, and DIC in different water masses of the Y3 seamount area
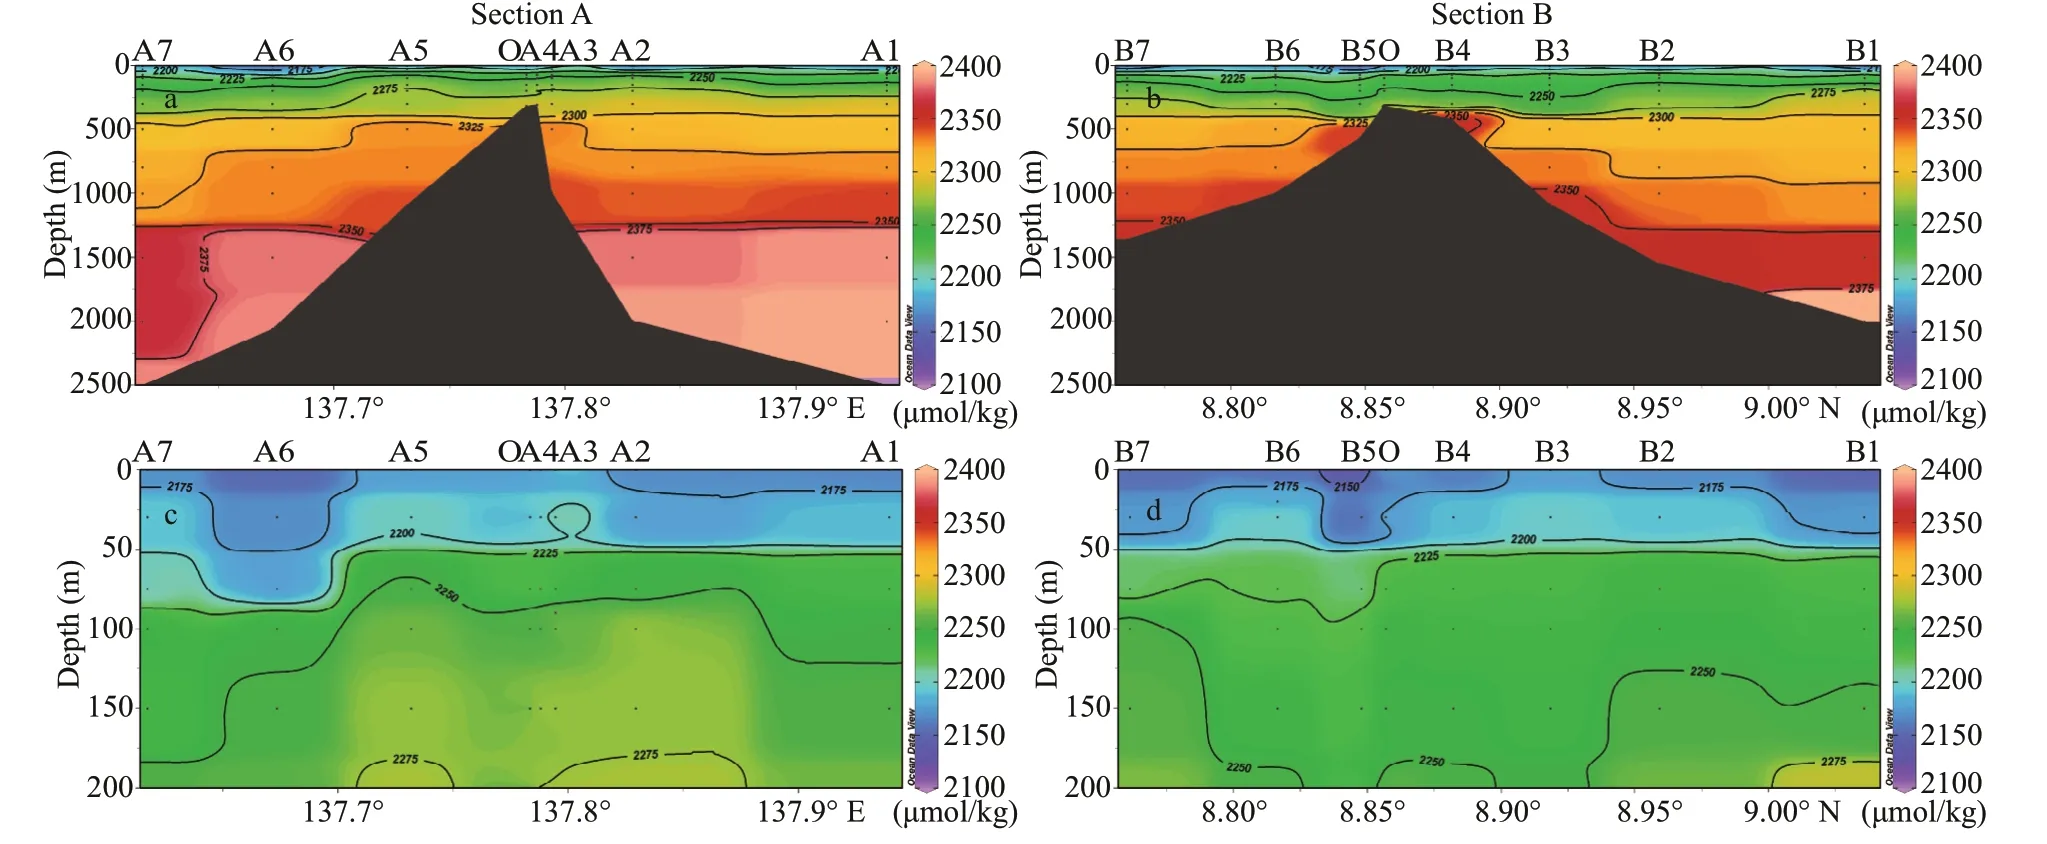
Fig.3 DIC distribution in Section A and B
A euphotic zone is the main water layer of primary production in the ocean, and is one of the most important areas of biological activities. DIC in the euphotic zone is a major component of marine inorganic carbon cycle system, and crucial to biological activities (De Souza et al., 2013; Ma et al., 2019b). To further understand the influence of the Y3 seamount on DIC distribution in euphotic zone, average concentration of DIC in 200-m water column was calculated. The concentrations at 0, 30, 75, 100, 150, and 200 m were added up and then divided by six to get the average of the column. Figure 4 shows that the average DIC concentration in the 200-m water column of Section A decreased gradually from the seamount peak to the two flanks, confi rming that on the seamount platform, DIC concentration in the euphotic zone could be boosted as mentioned above. However, this was not true for Section B, where no signifi cant effect was noticed on the average DIC concentration in the 200-m water column.
3.3 Distribution of environmental factors
Environmental factors in the Y3 seamount area varied remarkably with water depth increase (Table 2). Differences in biological activities, physical and chemical conditions, hydrology dynamics, and dynamics of dissolution equilibrium were obvious at different water depths, which may have a profound impact on the vertical distribution of DIC.
Figure 5 depicts the T and S distribution in Sections A and B above 200 m. Since the seamount is located in a warm pool area (0°–16°N / 125°E–165°E) of the Western Pacifi c Ocean, where surface water temperature ( T) is above 28°C all the year round (Zhan et al., 2013; Ma et al., 2019a), the average T at the water depth of 0–50 m was 29.05°C. Meanwhile, no obvious thermocline at the water depth of 50–200 m was noticed. With the increase of the water depth, Salinity ( S) increased fi rst and then decreased. T and S were both affected by the upwelling in the Y3 seamount, and the rises of isotherms and isohalines were apparent at Stations A2, A3, A4, and O at the water depth of 125–200 m, while this phenomenon in Section B was not so.
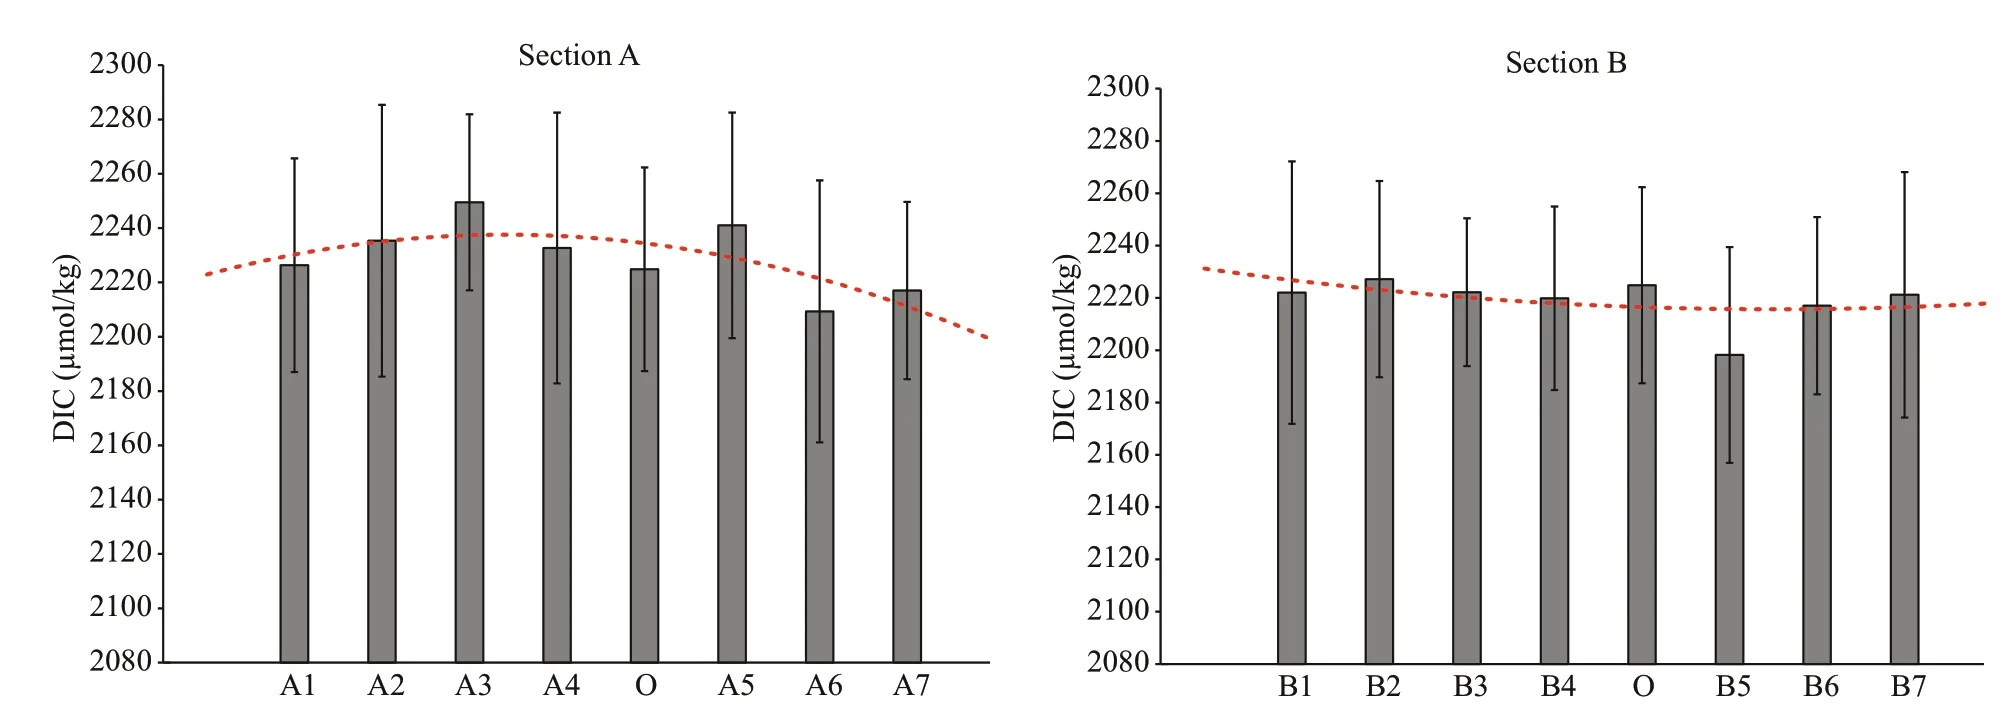
Fig.4 Distribution of average DIC concentration in 0–200 m water column

Fig.5 T and S distribution in Sections A and B above 200 m
pH in the Y3 seamount ranged 7.54–8.23 on average of 7.85, and decreased with the water deepening. In the SW, the pH was the highest, ranging 8.12–8.23 on average of 8.19. In the DW, the lowest, 7.54–7.66 on average of 7.60.
TAlk concentration ranged 2 323–2 669 on average of 2 520 μmol/kg. In the SW, the lowest, 2 323–2 479, on average of 2 427 μmol/kg, increased with water depth increase, and peaked in the DW from 2 546–2 669 on average of 2 596 μmol/kg.
DIC/TAlk ratio is often used in the measurement of the dissolved CO2content in seawater, which is positively correlated with dissolved CO2(Chou et al., 2009; Lu et al., 2016). In this study, the ratio was 0.83–0.93 on average of 0.89. In the SW, the ratio was the lowest, 0.83 to 0.87 on average of 0.86. With increase of the water depth, the ratio increased fi rst and then decreased, reaching the peak value in the NPIW, 0.90–0.93 on average of 0.92. In the DW, the ratio began to drop into 0.88–0.92 on average of 0.90.
Chl a concentration ranged from 0.01 to 0.20 on average of 0.05 mg/m3, and it was detected in the euphotic zone only. In the SW, it was 0.01–0.05 on average of 0.02 mg/m3. In the NPTW, to the maximum of 0.01–0.20 on average of 0.07 mg/m3.
DO concentration ranged from 2.53 to 7.18 mg/L on average of 4.81 mg/L: highest in the SW (5.45 to 7.18 on average of 6.83 mg/L). With water depth increase, DO showed a trend of decrease to increase, bottommost in the NPIW (2.53–4.42 on average of 3.48 mg/L). In the DW, DO increased gradually and stabilized in a range of 3.31–4.96 mg/L, on average of 4.00 mg/L.

Table 2 Distribution of environmental parameters in different water masses in the Y3 seamount area
3.4 Factors affecting DIC
3.4.1 The seamount geomorphology
Seamount is a unique landform on the seabed, and the local hydrology dynamics often affects environmental factors (Clark et al., 2010; Ma et al., 2018). When seawater flows by, upwelling would become a typical hydrological feature, and change the thermohaline structure and thus other environmental factors. Roden (1994) and Ma et al. (2019b) regarded the uplift of thermohaline structure as the representative of upwelling. In the fi rst of three surveys of Genin and Boehlert (1985) on the Minami-Kasuga seamount in the Western Pacifi c Ocean, they found a “cold dome” formed by the isotherm uplift just above the summit of the seamount at the water depth of 80–280 m. Comeau et al. (1995) found a similar uplift in the amplitude isotherms and nutrient isolines above the Cobb seamount. In the study of the three seamounts in the Tropical Western Pacifi c Ocean, our team confi rmed nearly-uniform changes in T, S, and nutrient concentration under the effects of the upwelling around seamount, and found a higher nutrient concentration in the adjacent waters of the seamount (Ma et al., 2019b), and approved the existence of the upwelling near the Y3 seamount as indicated in the relationship between nutrient and ecological environment (Ma et al., 2019a). In this study, DIC concentrations at the water depth of 50–200 m in Section A and about 500 m in Section B were signifi cantly higher than those of the stations far away from seamount. In particular in Section A, the rise of DIC isolines extended into the euphotic zone in similar locations and amplitudes with the rises of isotherms and isohalines. This result verifi es that the upwelling caused by the Y3 seamount could increase DIC concentration in the flanks of seamount.
However, the position and amplitude of the uplift of the DIC isolines in Sections A and B were different in the Y3 seamount (Fig.3). In the euphotic zone, the average DIC concentration in the 200-m water column near the seamount top was notably higher than that at the stations away in Section A, while the concentration along Section B had no marked changes (Fig.4). This phenomenon reflected the difference in environmental factors in different directions of the seamount, which may be caused by the direction of current. The Y3 seamount (8.76°N–9.04°N / 137.62°E–137.94°E) is located in the Western Pacifi c Ocean, and the upper water is mainly affected by the NEC (Toole et al., 1988; Hu et al., 2015). The NEC flows through the seamount from the east to the west, advancing in the east-west direction of the seamount (Section A), thus more signifi cant changes occurred in this section, causing the upwelling, which in turn led to obvious uplift of DIC and other environmental factors. In the study of the seamount, the investigated stations have always been set up in the form of cross-sections. Many studies have only reported signifi cant uplift of some environmental factors such as thermohaline structure in a single section consistent with the background current direction. Mourino et al. (2001) studied the environmental factors in the east-west section in the Great Meteor of the Northeast Atlantic Ocean, and they pointed out an uplift of the isotherms and isohalines at the water depth of 0–150 m in this direction. However, there was no mentioning of the crossing section. In the study of Komahashi No. 2 seamount near the Kitakyushu Island, the isotherm, isohaline, nitrate concentration isoline and chlorophyll a concentration isoline at the water depth of above 200 m in the Kuroshio direction showed very similar signifi cant uplift, but this phenomenon did not occur in its cross section (Odate and Furuya, 1998). These studies confi rmed that the interaction between background currents and seamounts is a main factor in determining the distribution of environmental factors around the seamounts. The difference in the DIC distribution between the two sections was largely influenced by the interaction of the NEC and the Y3 seamount.

Table 3 Correlations between DIC and environmental parameters in different water masses in the Y3 seamount area
3.4.2 The environmental factor
DIC is an important component of the carbonate system in the seawater, including HCO3ˉ, CO32ˉ, and dissolved CO2, and mostly in the form of HCO3ˉ (about 90%) (Song, 2010; Lu et al., 2016). The DIC distribution was mainly under the combined effects of T, S, and other components of the carbonate system in the seawater (pH, TAlk, and CaCO3), and biological activities (Sabine et al., 2004; Song, 2010; Lu et al., 2016). The environmental factors in different water masses in this study had different degrees of correlation with DIC (Table 3).
In the SW, the DIC, S, TAlk, and DIC/TAlk were low, T, pH, and DO were high; and there was a distribution of chl a. Since the Y3 seamount area is located in the warm pool area of the Tropical Western Pacifi c Ocean, the surface water temperature is higher than 28°C all year round (Zhan et al., 2013; Ma et al., 2019b). Chen and Millero (1979) for the fi rst time clearly identifi ed a negative correlation between T and DIC in the surface waters in the Atlantic Ocean; Chen and Pytkowicz (1979) found the same phenomenon in the Pacifi c Ocean. In the Y3 seamount area, the high water temperature reduces the CO2solubility in seawater, causing a low DIC/TAlk and DIC in the seawater. The studies of the other sea areas have also confi rmed that temperature is a main factor affecting the vertical distribution of DIC, i.e., the water temperature could control the solubility of CO2, and additionally, affect the components of the carbonate system in seawater (Louanchi et al., 2001; Chou et al., 2009). Particularly, the high water temperature could promote the removal of CO2in the SW and reduce DIC concentration (Lu et al., 2016). Meanwhile, due to the distribution of chl a in the SW, direct consumption of DIC during the photosynthesis of phytoplankton may also be one of the reasons for the low DIC in this water mass. Louanchi et al. (2001) confi rmed that the absorption of DIC by phytoplankton was the main reason for the low DIC in the euphotic zone of the Antarctic Ocean. However, the deep chlorophyll maximum layer (DCML) of the oligotrophic waters is often distributed in the subsurface (Bricaud et al., 1995; Zhang et al., 2016; Ma et al., 2019a), and many studies have shown that the DCML in the Y3 seamount area is mainly distributed at the water depth of 75 to 100 m, and the content of chl a at the water depth of above 50 m is extremely low (Zhang et al., 2016; Ma et al., 2019a). Meanwhile, in this study, DIC in the SW was positively correlated with chl a (Table 3), which was inconsistent with the above analysis, further indicating that phytoplankton growth is not the main factor leading to the low DIC concentration in the SW.
In the NPTW, the DIC, S, TAlk, and DIC/TAlk gradually increased, the T, pH, and DO gradually decreased, and the chl a reached the highest. Phytoplankton absorbs CO2, HCO3ˉ, and CO32ˉ for photosynthesis and releases oxygen, causing a signifi cant decrease in DIC. Many studies have pointed out that the absorption of CO2during phytoplankton growth and the formation of CaCO3shell by calcareous organisms are the main causes of low DIC in water (Sabine et al., 2004; Ma et al., 2018). In this study, DIC in the NPTW was found negatively correlated with chl a (Table 3), indicating that the growth of phytoplankton reduced the DIC concentration to a certain extent, similar to the results of previous studies. However, in the NPTW, the DIC concentration generally increased with the increasing water depth, and DIC/TAlk was also increasing, indicating that although the phytoplankton consumed much DIC in this water mass, the supplementation of DIC was much higher than the consumption, causing an overall increase in the DIC concentration. The DIC supplementation is influenced by many factors, of which the decomposition of organic matter is a crucial one. Chen et al. (2004) stated that there are different decomposition rates of organic matter and consumption rates of DO at different water depths in the North Pacifi c Ocean. In the process of decomposition, a large amount of oxygen is consumed and CO2is produced. In the NPTW, the correlation between DIC and DO was negative, and the correlation coefficient was -0.424 ( P <0.01), indicating a signifi cant decomposition process of organic matter. A similar phenomenon was also observed in the Kuroshio subsurface tropical water, which has similar water mass properties with the NPTW, i.e., with the decrease of DO concentration, DIC increases signifi cantly, and the decomposition of organic matter is the main source of CO2increase in this water mass (Lu et al., 2016).
In the NPIW, the DIC, TAlk, and DIC/TAlk continued to increase, and the T, S, pH, and DO continued to decrease. Meanwhile, there was no phytoplankton for photosynthesis. The oxygen minimum zone in the ocean is often formed at the water depth of 200–1 000 m, which is true to the NPIW of this study. In the oxygen minimum zone, the oxygen content was extremely low, the photosynthesis extremely weak, and the decomposition of organic matter dominated the material cycle (Wishner et al., 2013; Li et al., 2017). In the decomposition of organic matter, a large amount of CO2was produced, which in turn notably increased the DIC/TAlk ratio and DIC content of the water mass (Sheu et al., 1996; Pantoja et al., 2004). Chen et al. (1996) reported that organic carbon decomposition rates and oxygen consumption rates were the highest at the water depth of 300–600 m in the Sea of Japan. In this study, there was also a negative correlation between DIC and DO in the NPIW, and the correlation coefficient was -0.597 ( P <0.01), higher than -0.424 in the NPTW, indicating that organic matter degradation had more signifi cant effects on the DIC distribution in the NPIW. Meanwhile, the average temperature dropped remarkably from 21.00°C in the NPTW to 8.79°C in the NPIW. Changes in the dissolution dynamic equilibrium caused by a sharp temperature drop could also lead to the changes in DIC concentration. Previous studies showed that when the temperature and pressure drastically changed, and so the dissolution equilibrium of CaCO3(Feely et al., 2002; Iglesias-Rodriguez et al., 2002), which may resulted in a big increase in TAlk and a decrease in DIC/TAlk.
In the DW, the DIC and TAlk continued to increase and then remained stable, T and pH decreased and then remained stable, DIC/TAlk ratio began to decrease, and S and DO began to increase. In the ocean, DO tends to increase at the depth of above 1 000 m (Von Rad et al., 1995; Li et al., 2017). This study shows a similar fi nding: DO increased from the lowest 3.48 mg/L in the NPIW to 4.00 mg/L in the DW. Meanwhile, correlation between DIC and DO also changed from a very signifi cant negative correlation to a positive correlation. In addition, DIC/TAlk also showed a downward trend. In the study of biogeochemical cycles in the North Pacifi c Ocean, Chen et al. (2004) stated that the organic carbon decomposition rate and oxygen consumption rate were at a very low level at the water depth below 1 000 m. Chen et al. (2006) also found DO increase at the depth below 1 000 m in the Kuroshio. All these results indicate that the decomposition of organic matter in the DW weakened and was no longer an influencing factor on the continual increase of DIC with water depth. The temperature and pressure are the control factors for the dissolution of CaCO3, and low temperature and high pressure can increase the solubility of CaCO3(Feely et al., 2002; Lu et al., 2016). In the DW, the pressure gradually increased, and the temperature continued to decrease to 3.62°C from 8.97°C in the NPIW. Further changes in temperature and pressure may lead to the dissolution of CaCO3, the increase of TAlk and decrease of DIC/TAlk, which further affected the DIC concentration. Meanwhile, due to the buffering effects of CaCO3, DIC remained stable and had the smallest variation range. Chen et al. (2004) reported that CaCO3played an important role in the neutralizing process of CO2and CaCO3dissolution rate was relatively stable from the surface to the bottom. Deposits in the seabed contained massive CaCO3to keep DIC steady.
4 CONCLUSION
DIC distribution in the Y3 seamount area was affected by the topography and hydrology dynamic conditions. Meanwhile, DIC generally increased with the increase of the water depth, and was affected by different environmental factors in different water masses.
Topography and hydrology dynamic factors had a key impact on the DIC distribution in the Y3 seamount area. DIC concentration in Stations A2, A3, A4, A5, B4, B5, and O near the seamount was higher than that away from the seamount, reflecting the upwelling caused by the seamount could increase the DIC concentration in the adjacent waters. Interaction between the NEC and the Y3 seamount led to the differences in the DIC distribution in Sections A and B, i.e., the upwelling of Section A in the same direction as the NEC was more obvious, resulting in the average concentration of DIC in the 200-m water column in a trend of falling from the seamount summit to the two sides in this section, however, there was no signifi cant change in the average concentration of DIC in the 200 m water column at each station in Section B.
The biochemical environment in the seawater had an important influence on the distribution and variation of DIC in the Y3 seamount area. In the SW, the high temperature was a decisive factor leading to the decrease of DIC concentration, while the growth of phytoplankton had a little effect on DIC. In the NPTW, the photosynthesis of phytoplankton consumed DIC to some extents, but the DIC production by organic matter decomposition was overtaken that of DIC consumption. In the NPIW, the organic matter continued to decompose and played a leading role in the variation of DIC. In the DW, the dissolution of CaCO3played a decisive role in the carbonate system, and DIC had the smallest variation range.
5 DATA AVAILABILITY STATEMENT
The datasets generated during the current study are available from the corresponding author on reasonable request.
6 ACKNOWLEDGMENT
The authors thank the crews in R/V Science for their support in data collection and help in the cruise. We also acknowledge Prof. SUN Xiaoxia for her support in chl a data.
 Journal of Oceanology and Limnology2020年4期
- Journal of Oceanology and Limnology的其它文章
- Review on observational studies of western tropical Pacifi c Ocean circulation and climate*
- Research progress of TiO 2 photocathodic protection to metals in marine environment*
- Smart anticorrosion coating based on stimuli-responsive micro/nanocontainer: a review*
- Status of genetic studies and breeding of Saccharina japonica in China*
- To be the best in marine sciences*
- A review of progress in coupled ocean-atmosphere model developments for ENSO studies in China*
