Dynamic features of near-inertial oscillations in the Northwestern Pacifi c derived from mooring observations from 2015 to 2018*
HU Shijian , , LIU Lingling , , , GUAN Cong , , ZHANG Linlin , , WANG Jianing , , WANG Qingye , , MA Jie , , WANG Fujun , , JIA Fan , , FENG Junqiao , , LU Xi , , WANG Fan , , HU Dunxin ,
1 CAS Key Laboratory of Ocean Circulation and Waves, Institute of Oceanology, Chinese Academy of Sciences, Qingdao 266071, China
2 Center for Ocean Mega-Science, Chinese Academy of Sciences, Qingdao 266071, China
3 Pilot National Laboratory for Marine Science and Technology (Qingdao), Qingdao 266237, China
4 College of Marine Science, University of Chinese Academy of Sciences, Qingdao 266071, China
Abstract Near-inertial oscillation is an important physical process transferring surface wind energy into deep ocean. We investigated the near-inertial kinetic energy (NIKE) variability using acoustic Doppler current profi ler measurements from a mooring array deployed in the tropical western Pacifi c Ocean along 130°E at 8.5°N, 11°N, 12.6°N, 15°N, and 17.5°N from September 2015 to January 2018. Spatial features, decay timescales, and signifi cant seasonal variability of the observed NIKE were described. At the mooring sites of 17.5°N, 15°N, and 12.6°N, the NIKE peaks occurred in boreal autumn and the NIKE troughs were observed in boreal spring. By contrast, the NIKE at 11°N and 8.5°N showed peaks in winter and troughs in summer. Tropical cyclones and strong wind events played an important role in the emergence of high-NIKE events and explained the seasonality and latitudinal characteristics of the observed NIKE.
Keyword: near-inertial kinetic energy; western Pacifi c Ocean; tropical cyclones; mooring array; seasonal variability
1 INTRODUCTION
Winds and tides are major sources of mechanical energy driving the oceanic mixing and maintaining the observed ocean circulation (Munk and Wunsch, 1998). One of important approaches that wind imparts energy into ocean is the generation of near-inertial motions (Kunze, 1985). Near-inertial oscillations (NIOs) were revealed by current meter measurements in the 1960s (Webster, 1968). Rapid change of surface wind is an important cause of NIOs in the mixed layer (Pollard, 1970; Pollard and Millard, 1970; D’Asaro, 1985; Alford, 2001, 2003; Watanabe and Hibiya, 2002; Jiang et al., 2005; Kilbourne and Girton, 2015). Besides, NIOs can also be generated by other mechanisms, such as parametric subharmonic instability (Xie et al., 2011; Zheng et al., 2020).
Both wind-induced near-inertial energy flux and NIO show remarkable temporal and spatial variations (Park et al., 2005; Alford and Whitmont, 2007; Silverthorne and Toole, 2009; Chen et al., 2013; Li et al., 2015). Park et al. (2005) postulated that the amplitude of inertial currents in the North Pacifi c, North Atlantic and Southern Ocean in summer is greater than that in winter. However, Alford and Whitmont (2007) found that the near-inertial kineticenergy (NIKE) showed clear winter enhancement within the region 25°N–45°N and was consistent with wind-forced energy flux in the mixed layer based on the globally distributed moorings. Chen et al. (2013) found that the NIKE in the northwestern South China Sea are more active in boreal autumn and all the observed large NIKE events were generated by passing storms. It seems that the seasonality of NIOs varies from place to place. By contrast, it is not clear yet what the dynamic features of NIOs are in the tropical western Pacifi c Ocean.
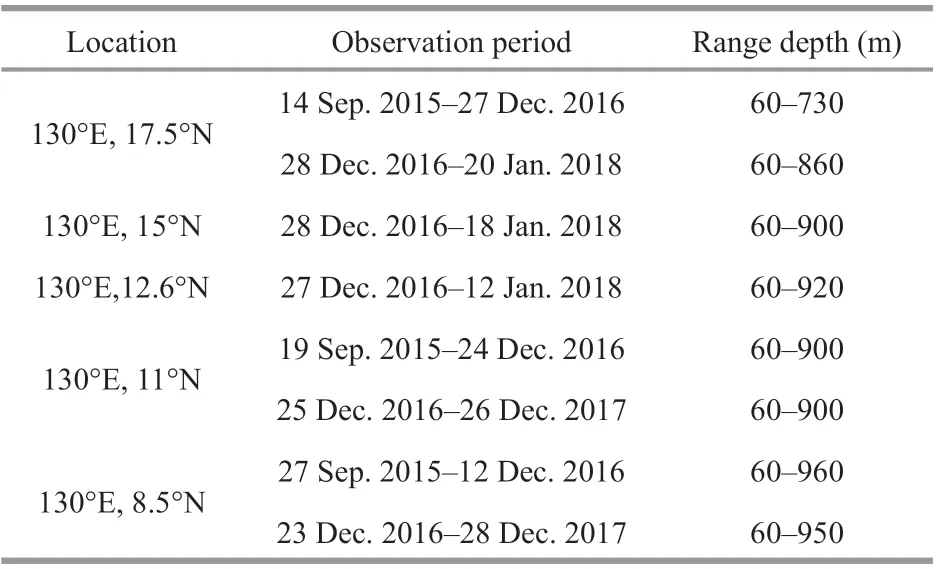
Table 1 Moorings deployment details
Previous studies suggest that tropical cyclones (TCs) act as an important driving agent of nearinertial motions in the mixed layer. Strong NIOs are generated in the mixed layer during the passage of TCs (e.g. D’Asaro, 1995; Shay et al., 1998; Sanford et al., 2011; Guan et al., 2014; Li et al., 2019). After the passage of TCs, most of NIKE in the mixed layer can be imparted into thermocline and deeper layer through near-inertial internal waves (Geisler, 1970; D’Asaro, 1995; Alford and Gregg, 2001; Jiang et al., 2005). Tropical western Pacifi c Ocean is the region with abundant TCs passing by, especially in the domain from 10°N to 30°N and the western of 140°E (Fig.1). Chen et al. (2013) found that TCs had an important impact on the variability of NIKE in the South China Sea. Thus, it is interesting to investigate how do the TCs affect the NIOs in the tropical western Pacifi c.
Since the implementation of the Northwestern Pacifi c Ocean Circulation and Climate (NPOCE)/Climate and Ocean: Variability, Predictability and Change (CLIVAR), an observational network consisting of several mooring arrays has been gradually built up in the tropical western Pacifi c Ocean (Wang and Hu, 2010; Hu et al., 2011, 2013, 2016; Song et al., 2018). As a part of the tropical western Pacifi c observational network, a mooring array along 130°E was deployed in 2014 and about 28 months of ADCP records were collected. The NPOCE mooring arrays provide a valued opportunity to study the spatial (vertical and meridional) pattern and temporal fluctuation of NIO and its relationship to the frequently passing TCs.
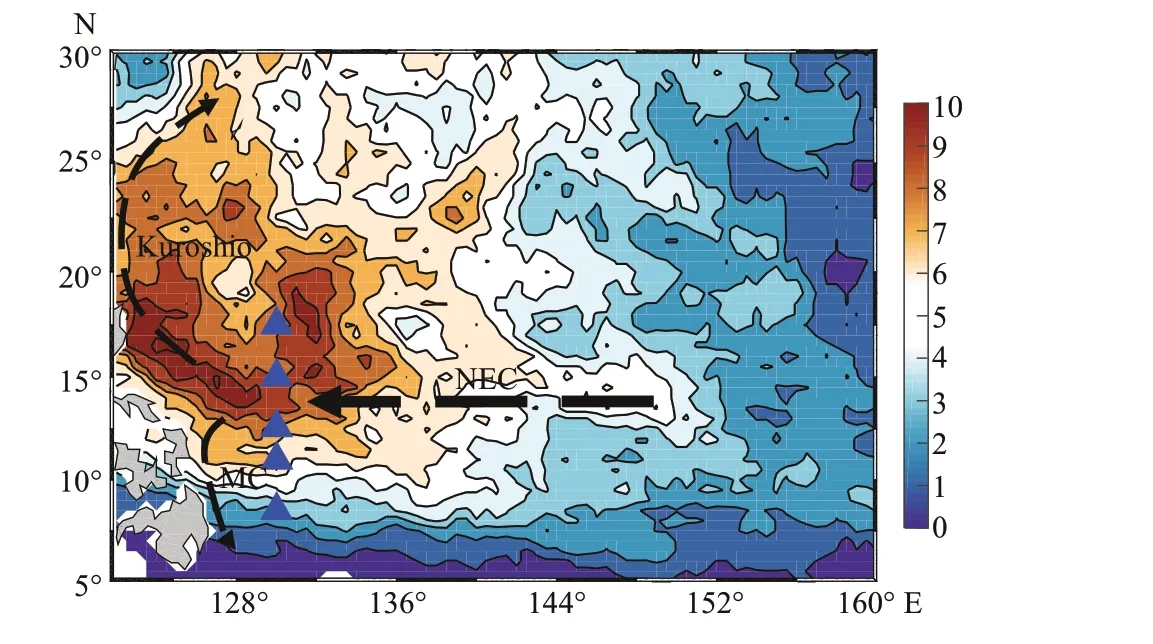
Fig.1 Distribution of probability of TCs (contours, unit in percentage, and interval is 1%) and positions of the mooring array in the Northwest Pacifi c (blue triangles)
In this paper, the mooring array observations are presented, the NIKE features examined, and the oceanic response to TCs explored. Data and method are described in Section 2 and the observed NIKE fluctuations and possible dynamics are shown in Section 3. The influence of TCs on oceanic environment is discussed in Section 4 and the main conclusions are given in Section 5.
2 DATA AND METHOD
Observations used to calculate the near-inertial horizontal kinetic energy were obtained from fi ve moorings located along 130°E in the tropical western Pacifi c (Fig.1). Depths of the mooring sites were 5 830, 5 820, 5 760, 5 880, and 3 450 m at 8.5°N, 11°N, 12.6°N, 15°N, and 17.5°N, respectively. The details of the mooring deployments are listed in Table 1. Each mooring was equipped with an upwardlooking and a downward-looking 75-kHZ Teledyne RD Instruments Acoustic Doppler Current Profi les (TRDI ADCPs). The depth the upward-looking and downward-looking ADCPs was about 500 m, while the exact depths of the ADCPs differed from each other and varied with time due to vertical fluctuation of the buoys. The ADCPs were confi gured to measure velocities hourly with a standard bin size of 8 m (Hu et al., 2016).
More than two-year velocity records were collected at 8.5°N, 11°N, and 17.5°N along 130°E. Due to some technical reasons, there were no sufficient data in the upper 500 m at (130°E, 15°N) during September 2015–December 2016, and hence only one-year velocity records are available at 12.6°N and 15°N. Vertical depth of these records for each mooring are shown in Table 1. The measured hourly velocity data were processed with standard quality control procedures (Hu et al., 2016, 2018). As seen in Table 1, the depths of ADCPs are different at different mooring sites and different time. Although the ADCPs have a same bin size of 8 m, the ADCP profi ling data were linearly interpolated onto a standard vertical grid with a uniform 5 m interval for a reasonable comparison between different mooring sites and different time.
The near-inertial horizontal velocity ( uf, vf) is obtained by applying a band-pass fi lter 0.80–1.20 f0(Liu et al., 2018), where f0is the local Coriolis frequency. Then the NIKE for each profi le was

where ρ0=1 024 kg/m3is the reference density, and hence the unit of NIKE is J/m3.
TCs, which passed near the mooring locations, were tracked using the best track data from the Regional Specialized Meteorological Center (RSMC) Tokyo-Typhoon Center, including the center positions at an interval of 6 h. The translation speeds are estimated from the six-hourly positions of TCs.
Daily mean sea surface (at 10 m height) wind speed data, provided by the NOAA ERDDAP (National Oceanic and Atmospheric Administration/Environmental Research Division’s Data Access Program, https://coastwatch.pfeg.noaa.gov/erddap/index.html), were used to examine the role of wind change. The wind speed has a spatial resolution of 0.25° from the Advanced Scatterometer (ASCAT). ASCAT is a microwave scatterometer designed to measure surface winds over the global ocean. Daily mean wind speed anomaly was defi ned as daily mean wind speed minus the annual mean wind speed during 2016–2017.
The Optically Interpolated (OI) sea surface temperature (SST) daily products with the resolution of ~25 km (downloaded from Remote Sensing System Inc.) were used to determine the SST changes induced by TCs. The Soil Moisture Active Passive (SMAP) sea surface salinity (SSS) V2.0 (Level 3 Running 8-day), which is gridded at 0.25°×0.25°, was used. Vertical temperature and salinity profi les in the Northwest Pacifi c Ocean were from the Argo project and distributed by the National Oceanographic Data Center (NODC). Only those vertical temperature and salinity profi les with quality flag equal to 1 were used.
3 RESULT
3.1 Characteristics of NIKE
Figure 2 presents the time series of profi ling NIKE observed by the fi ve moorings. The NIKE had an order of 100J/m3and was intensifi ed in the upperlayer. Strong low-frequency fluctuation of NIKE was observed overlaying the high-frequency variations in the entire observation depth from 60 m to 900 m. The NIKE variance was intensifi ed in the upper layer as well, but during strong NIKE events, energy signifi cantly penetrated into the deep layer below the thermocline.
Mean and vertical profi ling NIKE over the observation duration (NIKE) is shown in Fig.3. The maximums of NIKE are about 1.0, 1.3, 2.6, 2.3, and 3.3 J/m3at 8.5°N, 11°N, 12.6°N, 15°N, 17.5°N, respectively, but the observed NIKE maximums are about 29, 36, 57, 93, and 198 J/m3at these mooring sites, suggesting extreme energy penetration and remarkable importance of the NIKE events (Figs.2 & 3). As we can see from Fig.3, NIKE in the upper layer above about 300 m shows strong variability much greater than the.
High NIKEs were detected in October–November 2015 (17.5°N and 8.5°N), September–November 2016 (17.5°N), January–February 2017 (all the fi ve latitudes), October–November 2017 (all the fi ve latitudes), and December 2017 (15°N, 12.6°N and 11°N). Table 2 summarizes the high NIKE events, which were defi ned as NIKE greater than two times of its standard deviation plus the mean of NIKE. NIKE at different latitudes along 130°E showed a coherent intensifi cation during boreal autumn-winter from September to the following February, implying clear seasonality of NIKE (Fig.2). The variance of NIKE was sharply decreased close to zero below about 300 m, where the depth of thermocline was located (Fig.3).
The amplitude and variance of NIKE showed a close relationship with latitude. As shown in Figs.2 & 3, both temporal mean and maximal NIKE roughly increase with latitudes. We compared profi les of the NIKE variance, defi ned as standard deviation (STD) of NIKE, at the fi ve latitudes in Fig.4a. Discrepancy among the fi ve profi les of NIKE STDs was mainly confi ned in the upper 300-m layer, in which the NIKE variance increases from about 1 J/m3at 8.5°N to about 14 J/m3at 17°N (Fig.4a).

Fig.2 Observed near-inertial kinetic energy (J/m 3) at 17.5°E, 15°E, 12.6°N, 11°N, and 8.5°N
Similar analysis was applied to other larger NIO events as shown in Table 2. The decay timescales of the NIKE averaged from 60 m to PD were about 4–9 d, which was different from the fi nding that the decay timescale is larger than 7 d in the South China Sea (Chen et al., 2013) and less than 5 d in the mixed layer (Park et al., 2009). The difference might originate from the alien hydrological characteristics at different locations of moorings.
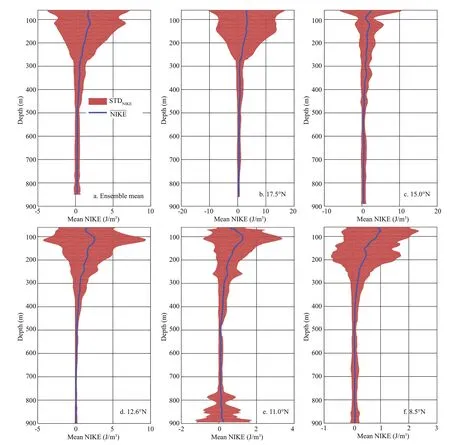
Fig.3 As in Fig.2, but for time mean near-inertial kinetic energy (blue lines) and its variance defi ned as the standard deviation of NIKE (red shadings)
3.2 Seasonality of NIKE
There existed a seasonal variation of the 60–700 m depth-averaged NIKE (Fig.5). At latitudes of 17.5°N, 15°N, and 12.6°N, higher NIKE was found in autumn (September to November), with the largest in October, but at 11°N and 8.5°N, the highest NIKE occurred in winter (January). The NIKE in spring and summer was weak at all latitudes, and the weakest NIKE was found in June at 15°N, 12.6°N, and 11°N, April at 17.5°N and May at 8.5°N, respectively. As discussed in Liu et al. (2001), owing to the great heat loss on the sea surface, a deeper mixed layer depth may damp the NIKE. That is, the temporal fluctuation of vertical mean of NIKE may be related to both the local wind and oceanic mixed layer depth.
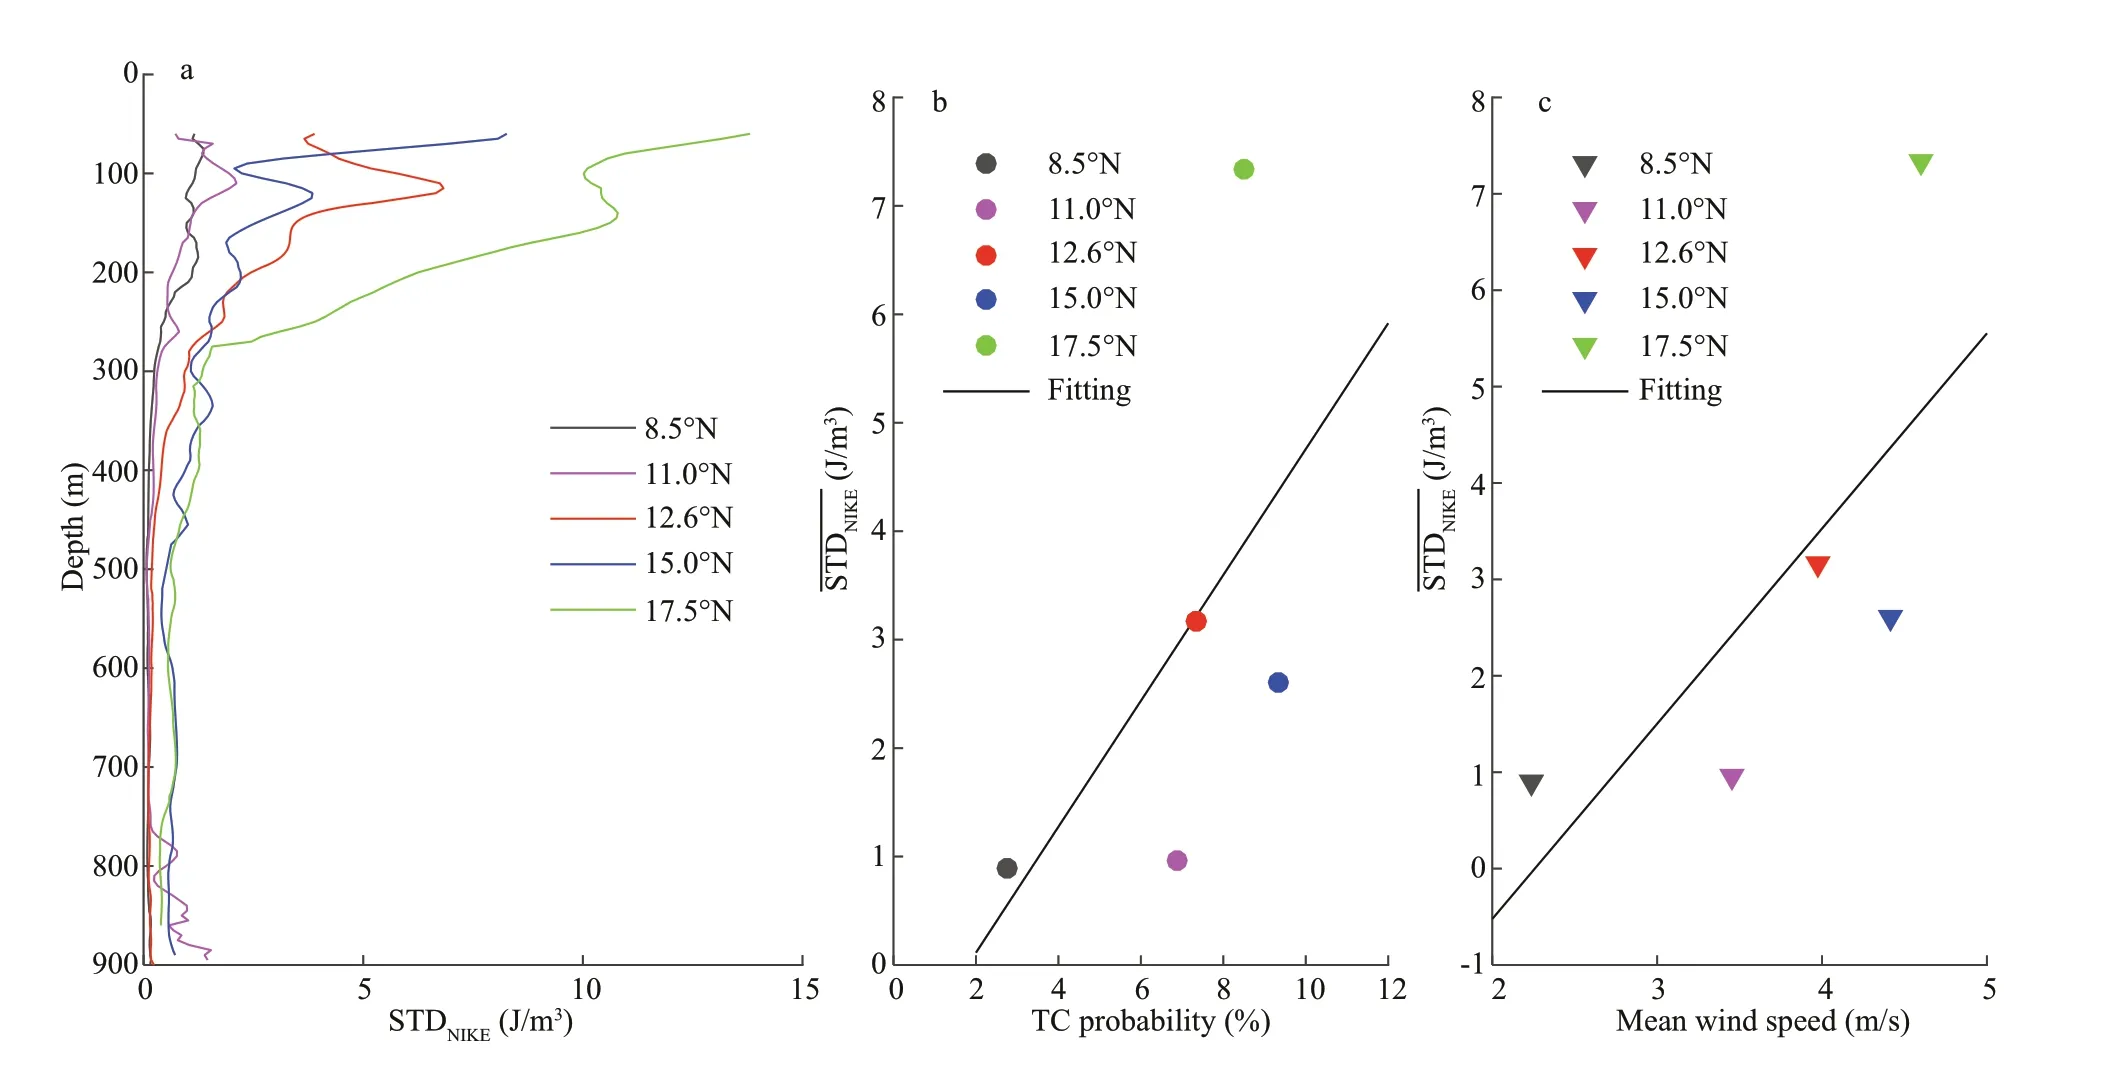
Fig.4 Vertical prof iling of the NIKE STDs at mooring sites (a); vertically averaged STDs of NIKE () over 60–300-m layer comparing with TC probabilities at mooring sites and linear f itting of as a function of TC probability (b); as in the middle panel but for mean 10-m wind speed averaged over 2016–2017 (m/s) (c)
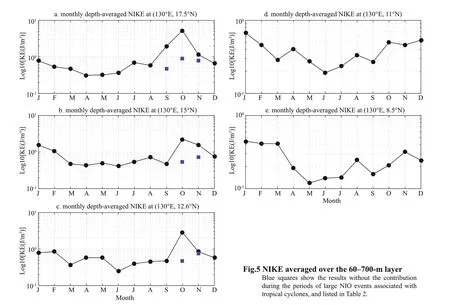

Table 2 Large NIOs observed in the Northwestern Pacifi c at 8.5°N, 11°N, 12.6°N, 15°N, and 17.5°N
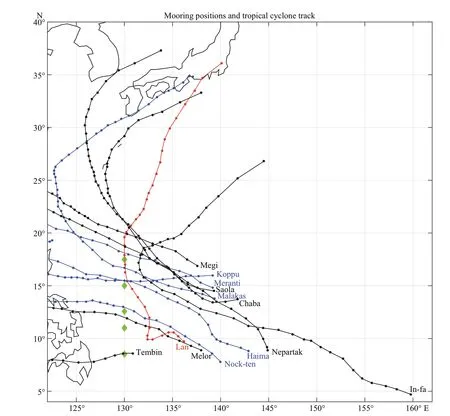
Fig.7 Six-hourly tropical cyclone tracks, which passing the region 300 km away from the moorings (green diamonds)
The vertical distributions of mean NIKE in the four seasons are shown in Fig.6, in which the green dashed lines represent the NIKE in autumn without tropical cyclones. At 17.5°N, large NIKE was found in autumn at all observed depths, which was dominated by the contribution from tropical cyclones. In contrast, the NIKE in spring was the weakest in upper 750-m layer. It is clear that the NIKE at 17.5°N was featured with a surface-intensifi ed seasonal variation, especially in the upper 400 m. The NIKE at 15°N in autumn and winter was much greater than that in spring and summer. At 12.6°N, the NIKE in autumn was the highest at nearly all observation depths; and below the depth of 250 m, NIKE in summer was the smallest. However, at latitudes of 11°N and 8.5°N, the seasonal variation of NIKE in the 250–450 m depth was signifi cant with a peak in winter and a trough in summer. Furthermore, by comparing the NIKE in autumn with and without tropical cyclones’ contribution at 17.5°N, 15°N, and 12.6°N, it was concluded that the NIO might penetrate into the deep layers below the maximum depth of the mooring ADCP observations at about 900 m.
3.3 Relationship to tropical cyclones
D’Asaro (1985) showed that wind forcing of inertial motions is primarily caused by the passage of storms. The latitudinal dependence of NIKE might be related to the meridional distribution of TC probability in the western Pacifi c Ocean. As shown in Fig.1, the probability of TC in the region centered at 130°E between 8.5°N and 17.5°N was signifi cantly higher than other regions. We plotted the vertical mean STDs of NIKE (60–300 m) as a function of TC probability in Fig.4b. A close relationship between the NIKE variance and TC probability is found: a higher TC probability corresponds to a stronger NIKE variance (Fig.4b).
During the observation period, 13 TCs passed through the region of 300 km from the mooring sites. As shown in Fig.7, all TCs formed in the east of the mooring array and moved westward or northwestward across the mooring array.

Fig.8 The time evolution of the 60–300-m depth-averaged (hourly) NIKE
Figure 8 shows the vertical mean NIKE (60–300 m) at each mooring site. By comparing with TCs, it is found that a great portion of high NIKE events was accompanied by at least one TC (Table 2, Figs.7 & 8): TCs Koppu, Haima, Meranti, Malakas, and Nock-ten had given rise to large NIKE events, while TC Lan had a strong influence on all the mooring sites except 8.5°N. A rough estimate suggests that the NIKE induced by the four events reached 56% of the total NIKE over the observation period at 17.5°N; and at 15°N and 12.6°N, the typhoon Lan-induced large NIO event contributed 26.8% and 30.5% of the total NIKE, respectively.
TCs could happen anytime, with the main season from July to October in the western Pacifi c (Fig.9), which is conducive to the seasonal variability of high NIKE events. As shown in Fig.9, The region north of 11°N has a much greater probability of TCs than that in the south of 11°N and the TC probability at 8.5°N and 11°N was very small. This explains why the NIKE at 12.6°N, 15°N and 17.5°N along 130°E peaked in October (Figs.5 & 9).
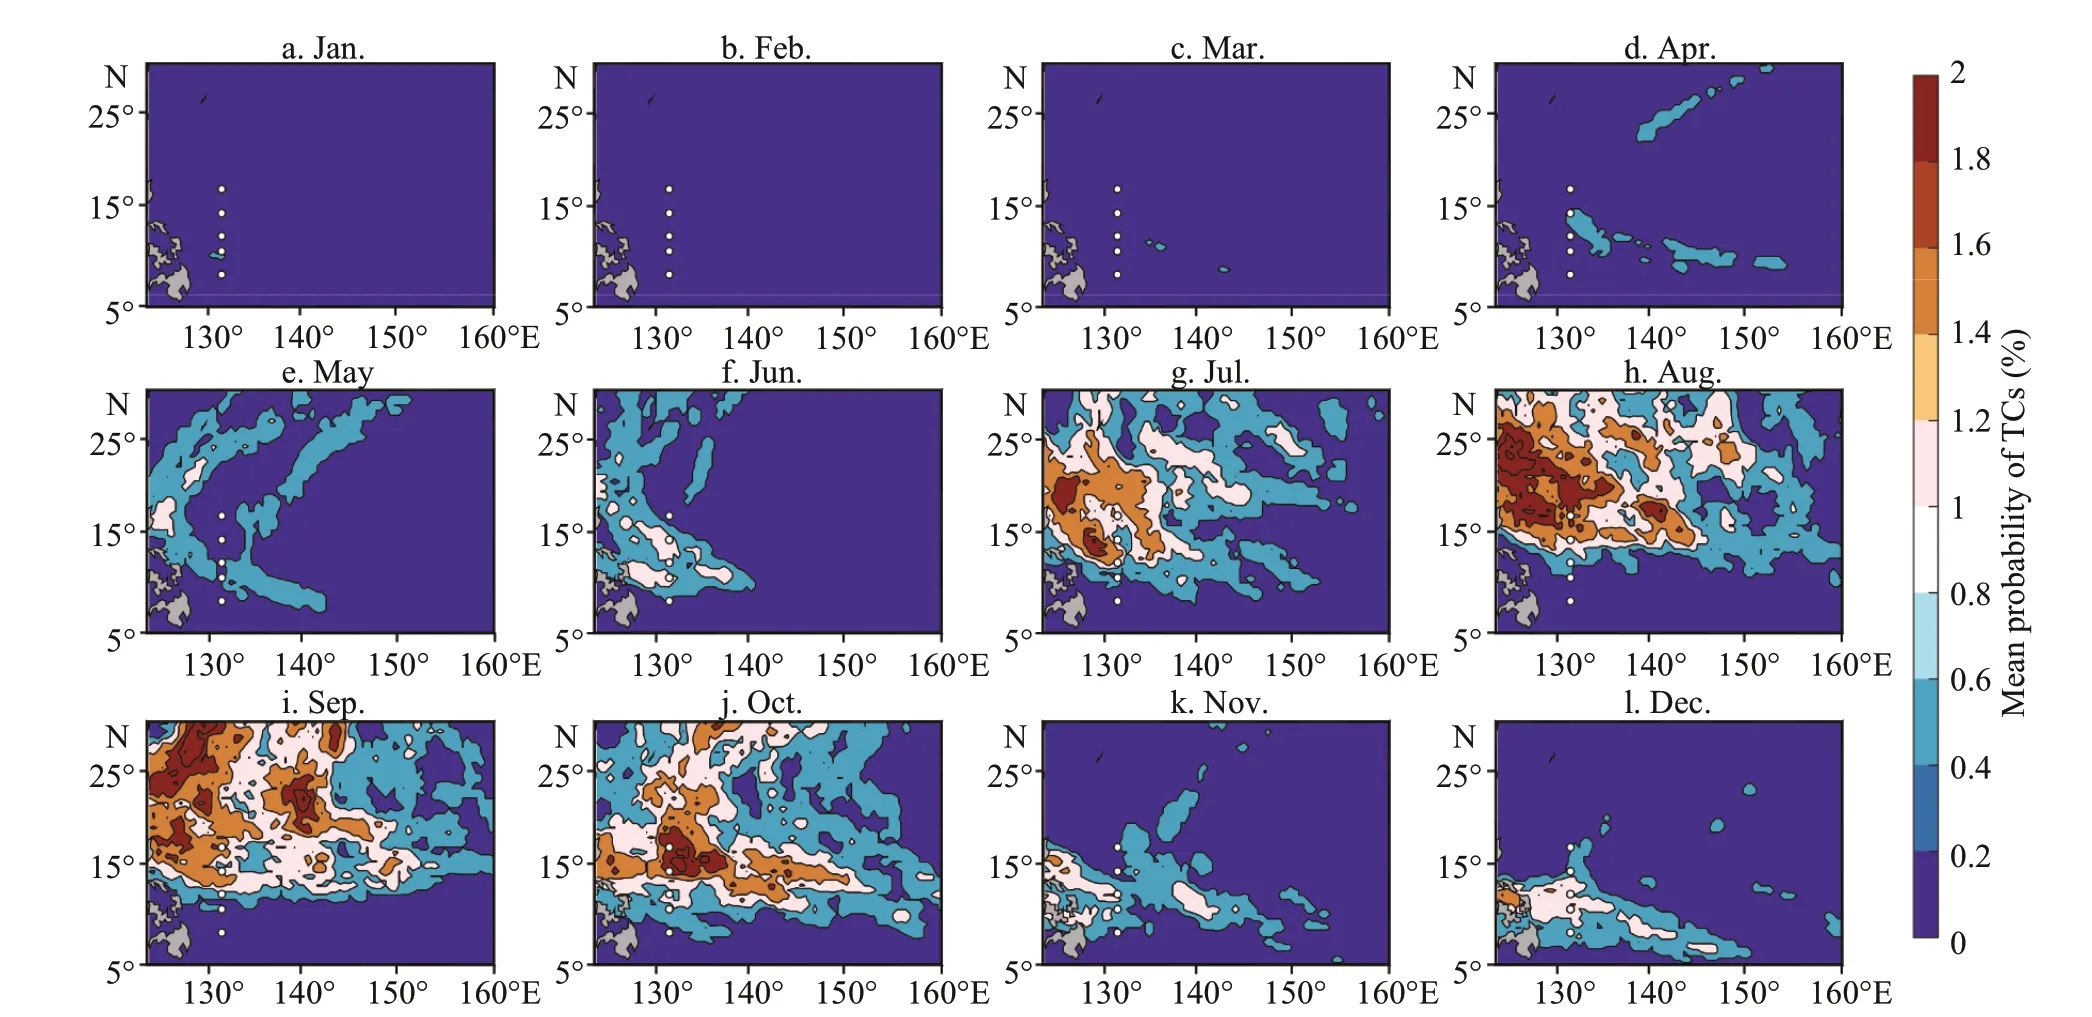
Fig.9 As is Fig.1, but for distribution of mean probability of TCs (unit in percentage) in each calendar month
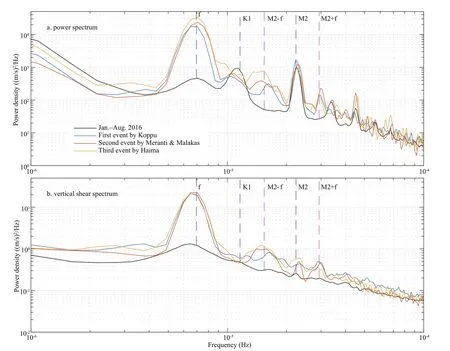
Fig.10 Power spectra (a) and vertical shear spectra (b) at 130°E and 17.5°N during NIO events in 2016
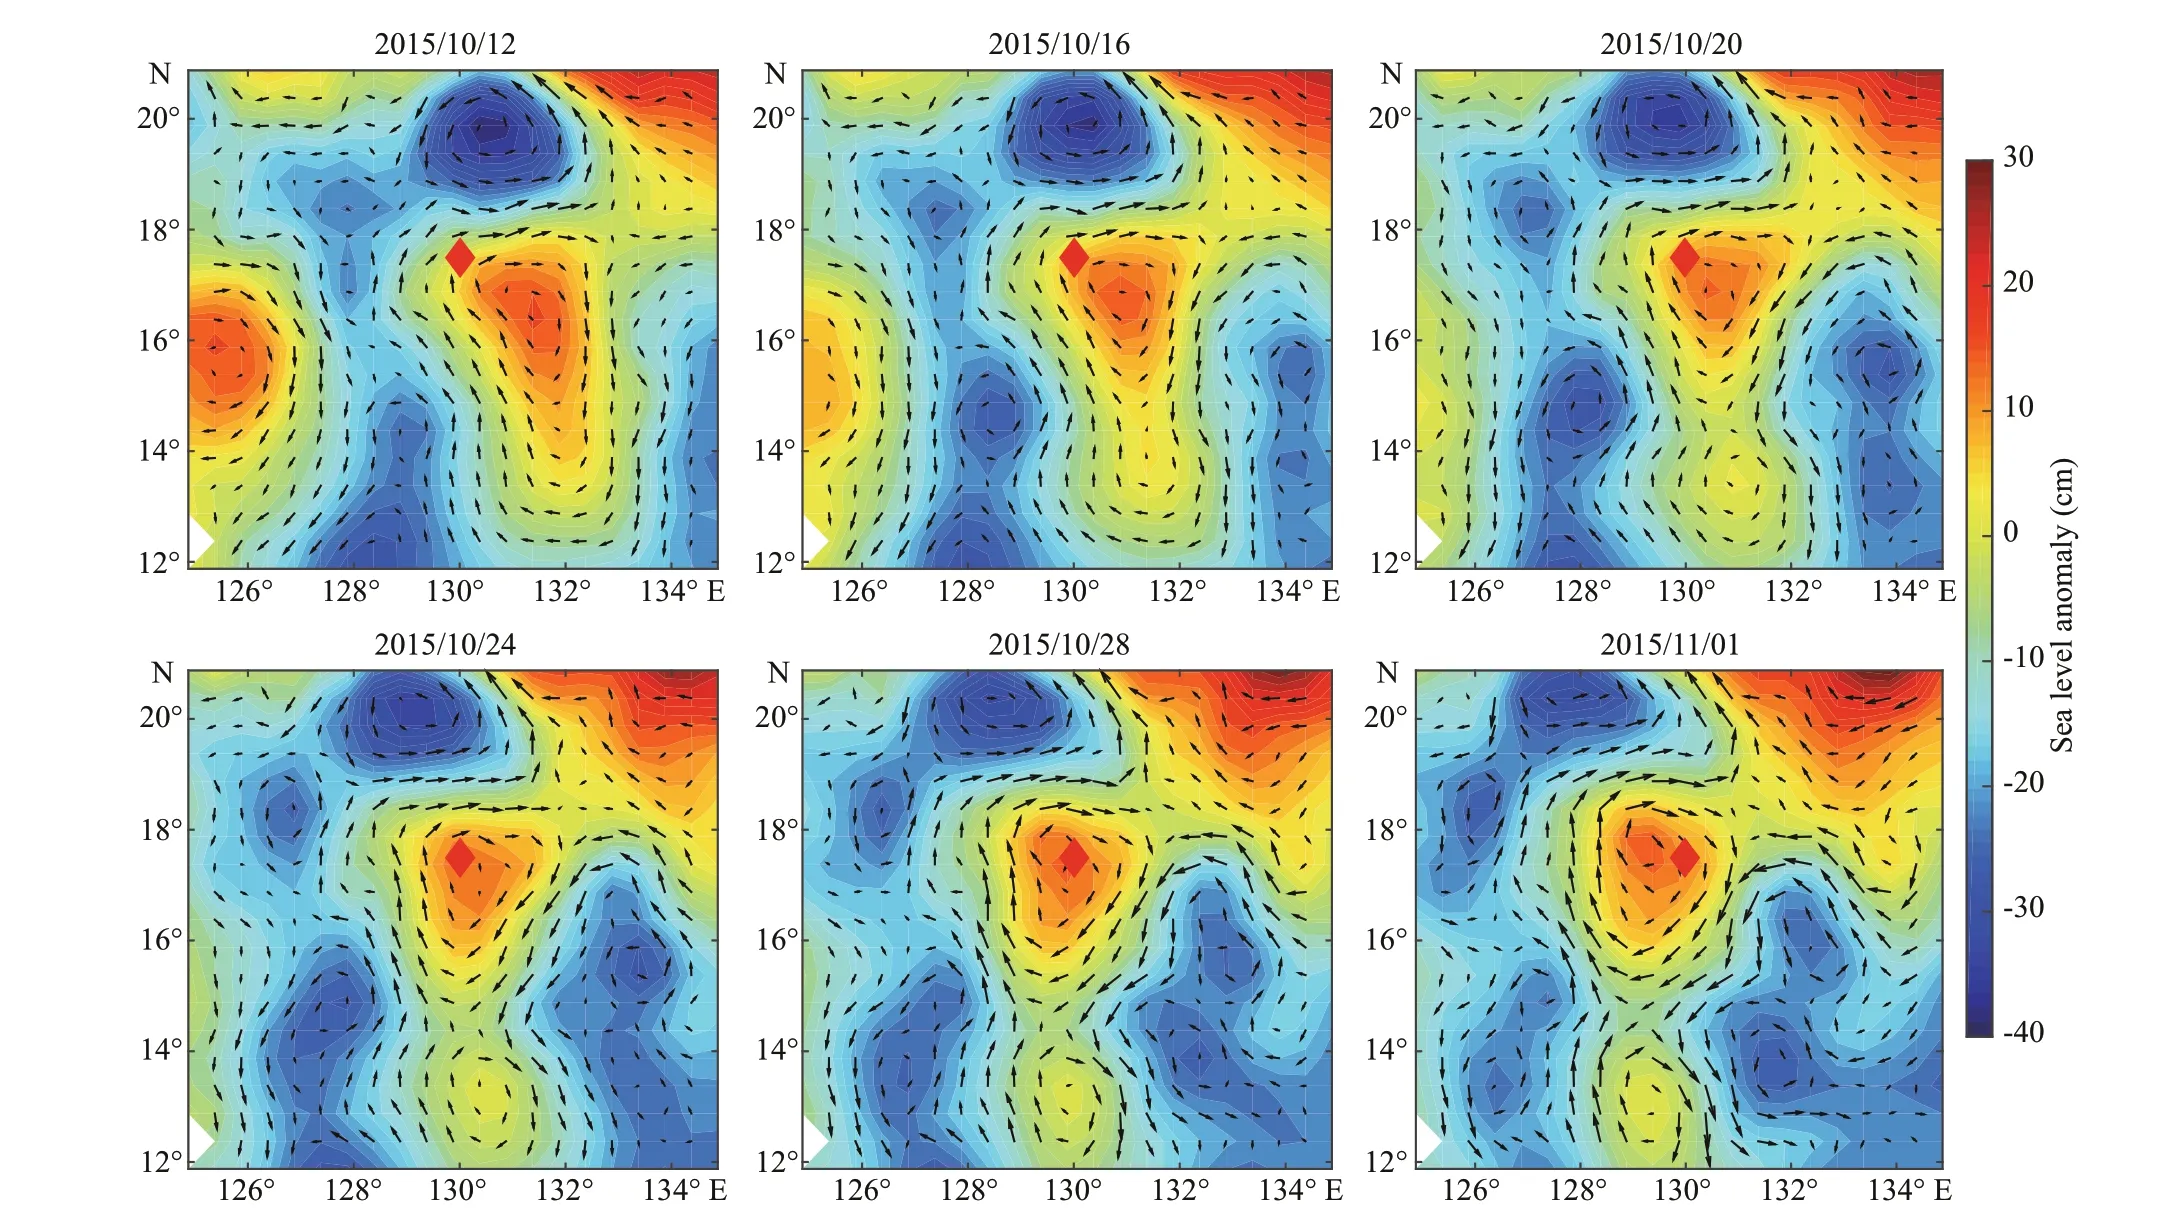
Fig.11 The sea level anomaly (shading, unit: cm) and the geostrophic currents anomaly (vector) from the altimeter data during the passage of Typhoon Koppu
Spectral analysis for 17.5°N indicated that the tides, particularly the diurnal tide (D1) and semidiurnal tide (M2), dominated the internal wave band in the upper ocean; however, after the passage of typhoon, NIO became the predominant (Fig.10a). Taking typhoon Koppu for example, NIKE increased by more than 30 times compared with the no-typhoon condition (Fig.10a). During the ADCP measurement period, the maximum NIKE, induced by typhoon “Haima”, was observed at 130°E, 17.5°N in October 2016, with the near-inertial current amplitude up to 0.6 m/s. Considering that the averaged near-inertial current amplitude in the upper 200 m was about 5 m/s (Fig.2), the penetration depth of NIO (PD) here was defi ned as the maximum depth of the horizontal velocity 5 m/s, about 340 m for the NIO by “Haima”. The e-folding timescale of depth-averaged NIKE (60 m to penetration depth), which was defi ned as the time interval between energy when the NIKE reaches its maximum and 1/ e of its maximum, was diagnosed as ~6 d. Moreover, both power spectrum and vertical shear spectrum showed the new spectral peaks at the sum and difference of inertial ( f) and semidiurnal internal tide (M2) frequency after typhoon passage, which suggests that a triad nonlinear wave-wave interaction may occur among the typhoon-generated near-inertial interval wave, M2 sub-tides, and a third wave (M2+ f)/(M2– f) (Xing and Davies, 2002; Davies and Xing, 2003; Liu et al., 2018). The vertical shear spectrum shows intensifi cation in the internal waves band, especially in the near-inertial band and (M2+ f)/(M2– f) frequency (Fig.10b), thus, TC-induced NIO and its secondary waves could make great contribution to shear, and consequent diapycnal mixing.
The oscillation frequency is not exactly the local inertial frequency. In most cases, NIO had a peak frequency slightly higher than f, while fewer occasions had a frequency slightly below f, such as the event induced by Typhoon Koppu (blue line in Fig.10). The central frequency of NIO band during typhoon Koppu was 0.935 f, a redshift of about 6.5% lower than the inertial frequency. As shown in Fig.11, there was an anticyclonic eddy during the passage of Koppu. The negative vorticity associated with the eddy could reduce the lower limit of admissible frequency band for NIO, causing the red-shift (Kunze, 1985; Sun et al., 2011).
Nevertheless, it should be noted that not every TC passing near the mooring location could cause a large NIKE event. As shown in Fig.8, seven TCs did not induce signifi cant large NIKE event, including Tembin, Melor, Megi, Nepartak, In-fa, Chaba, and Saola. On the other hand, more than half of the observed high NIKE events occurred without a TC, especially for the southern sites at 8.5°N and 11°N, where the NIKE showed a peak in January when the TC probability is close to zero (Fig.9).
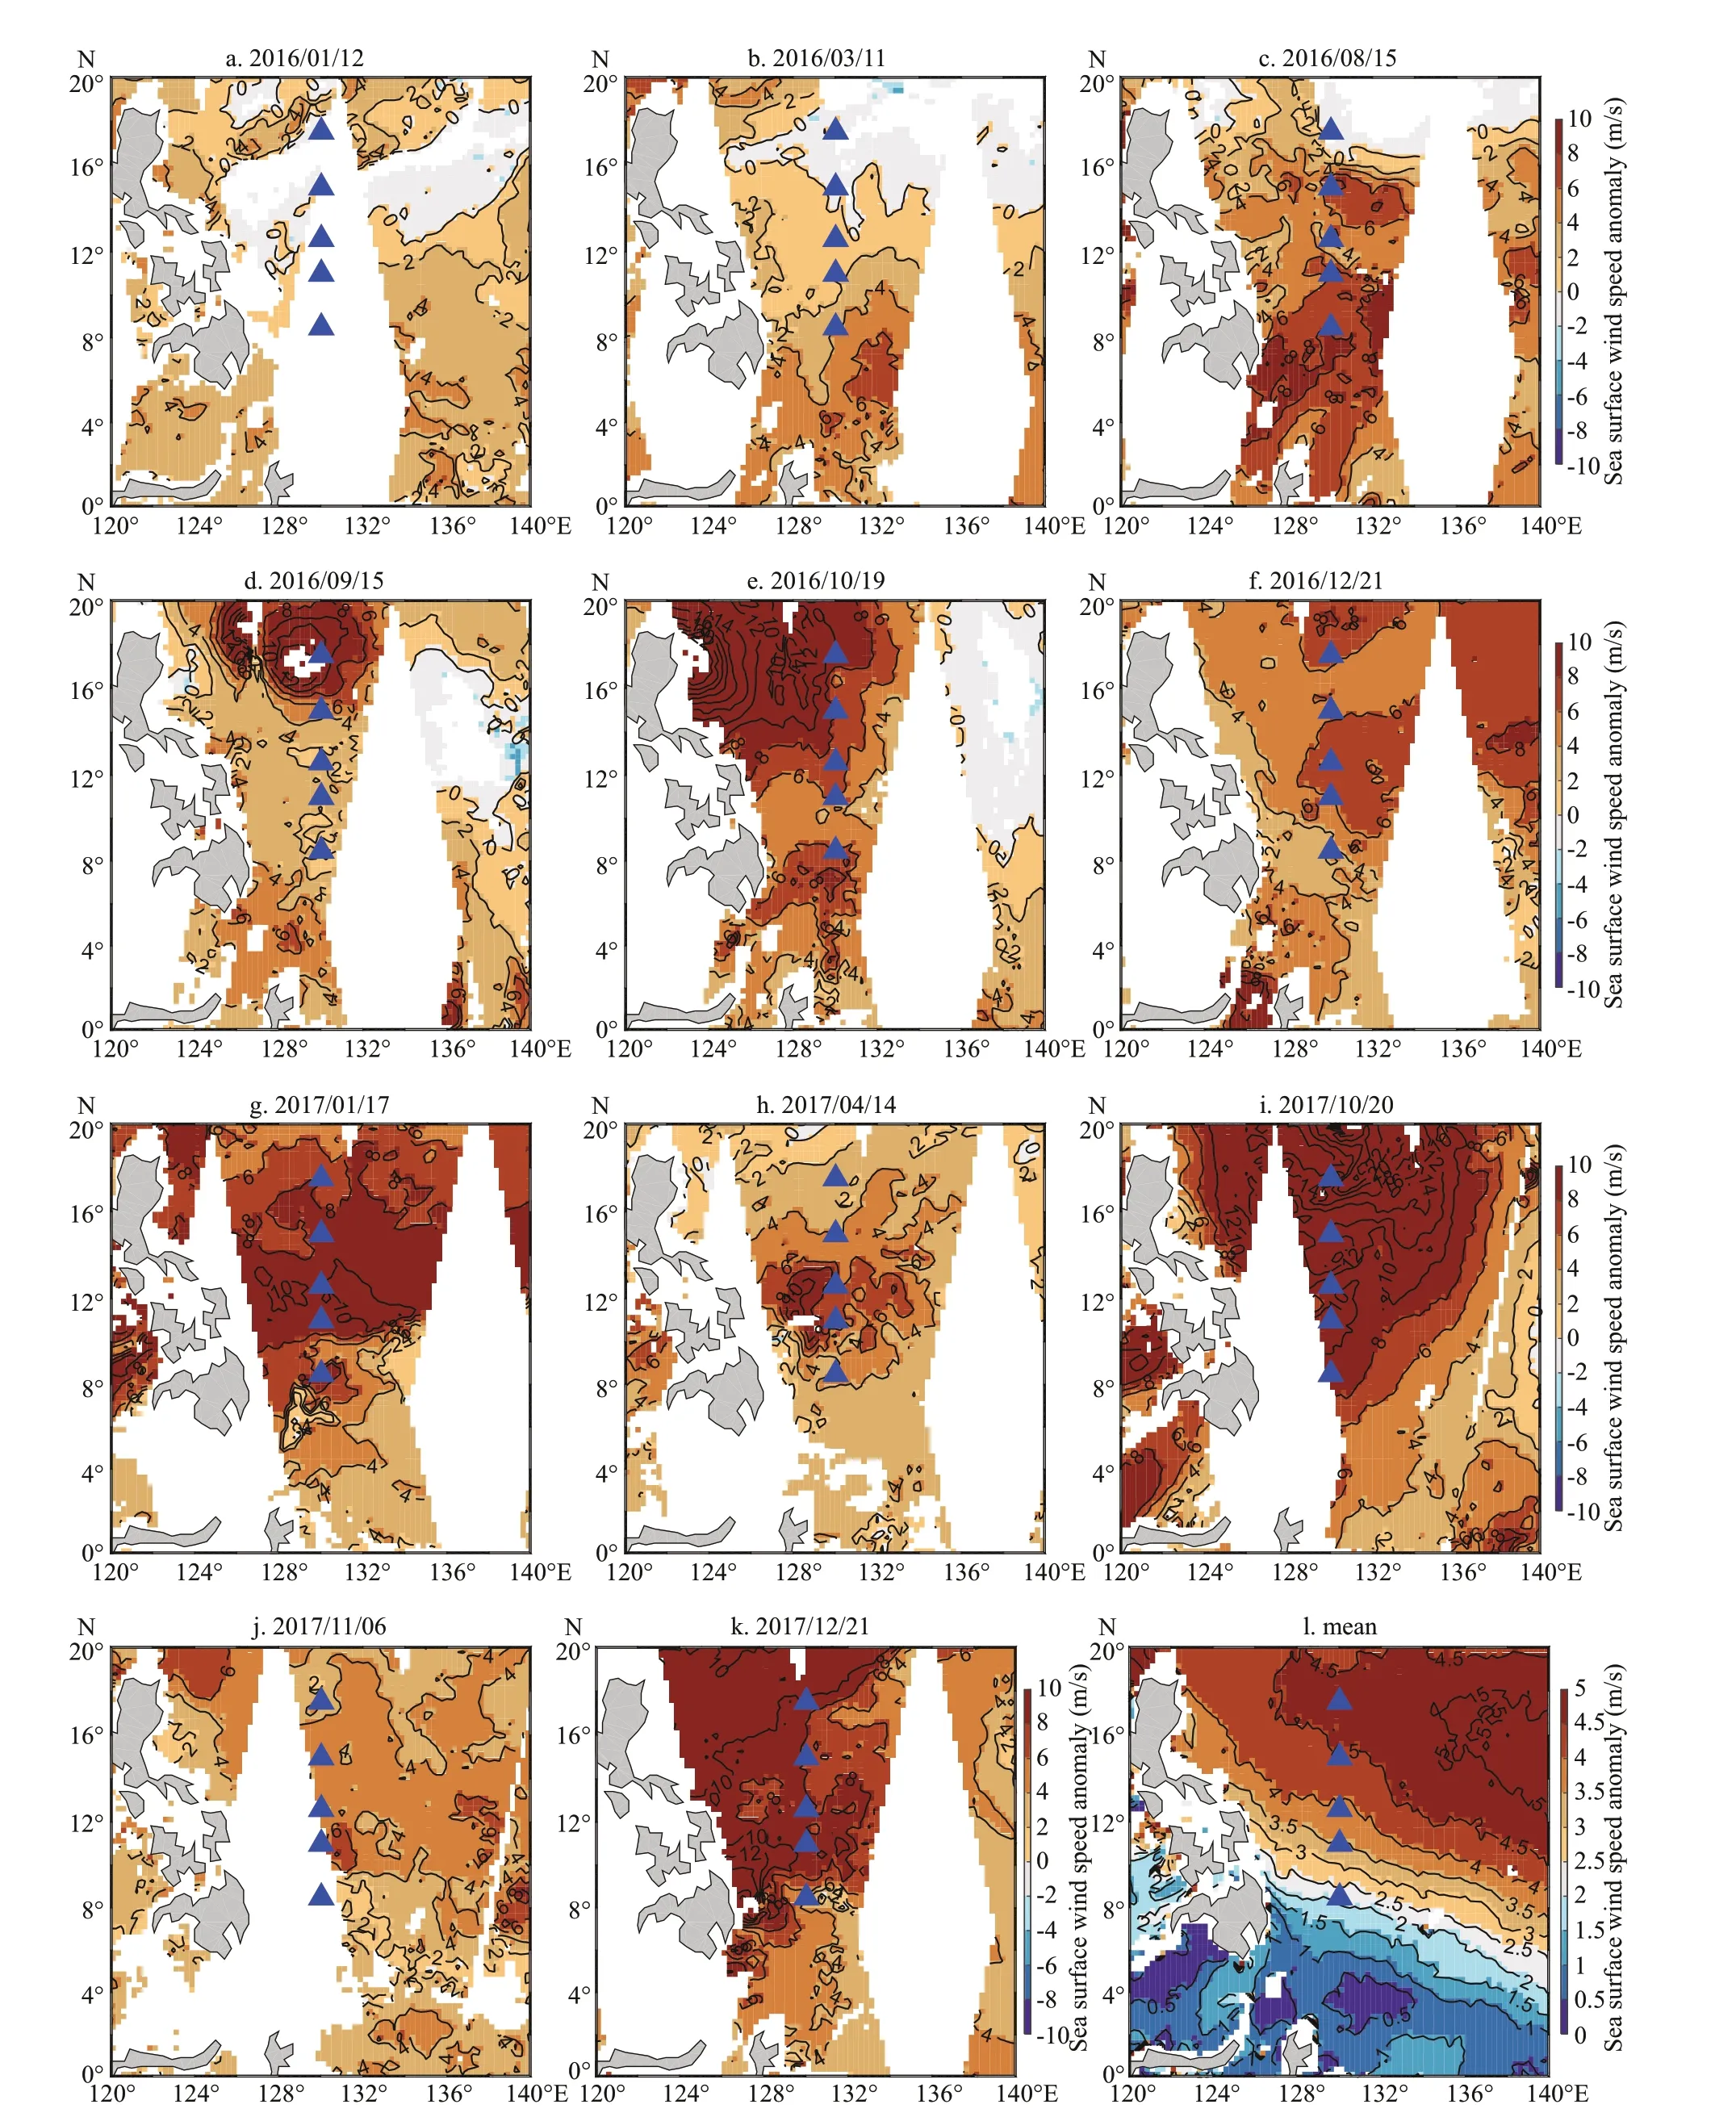
Fig.12 Daily mean of sea surface (10 m) wind speed anomaly during the high NIKE events (a–k, unit in m/s) relative to the annual mean wind speed (l, average of 2016–2017 daily mean wind speed fi led)
Rapid change in winds is an important mechanism in triggering the burst of high NIKE events (Figs.8 & 12). Hence we used daily mean wind speed data from remote measurements from the ASCAT, although we were aware that a higher-frequency wind data might be better to investigate the rapid change of winds. Figure 12 presents the anomalous daily mean sea surface wind speed (10 m height) relative to a twoyear mean wind speed during 2016–2017 in each high NIKE event. Daily mean sea surface wind speed anomaly was defi ned as daily mean sea surface wind speed minus the annual mean sea surface wind speed during January 2016–December 2017. Almost all the observed high NIKE events correspond to enhancing events of sea surface wind. Wind speed observation was absent along the mooring array in middle January 2016, but positive wind speed anomalies were found around the mooring at 8.5°N, implying enhanced wind associated with the high NIKE event in middle January 2016 at 8.5°N. In middle March 2016, the mooring at 8.5°N was blown by anomalous wind of 4 m/s, which may be accounted for the high NIKE event occurred in middle March 2016 at 8.5°N although no TCs occurred near the mooring at that time. Strong wind anomalies arose in middle August 2016 at moorings in the south of 15°N and with amplitudes of 6 and 8 m/s at 11°N and 8.5°N, respectively, which probably caused the high NIKE events in middle August at the two mooring sites.
Vigorous enhancement of sea surface wind related to TCs (Meranti & Malakas, Haima) burst near the mooring at 17.5°N and with an amplitude of about 10–12 m/s and might lead to the signifi cant high NIKE events occurred in middle September and late October 2016 at 17.5°N. The TC Nock-ten crossed the mooring array through the north of 11°N, induced anomalous wind of about 7 m/s, and might account for the short but signifi cant high NIKE event was observed in late December 2016 at 11°N. Strong wind anomalies were found along the mooring array in middle January 2017, especially at 11°N (10 m/s), which might be a driving force for the high NIKE event observed at 11°N in middle January 2017. In middle April, positive wind speed anomalies were found in the region centered at 11°N and probably gave rise to a clear NIKE peak at 11°N at that time.
Extreme NIKE events were detected at all the four mooring sites from 11°N to 17.5°N in late October 2017. As shown in Fig.12i, extremely strong wind speed anomalies burst in late October 2017, which were about 16, 12, 9, 11, and 9 m/s at 17.5°N, 15°N, 12.6°N, 11°N and 8°N, respectively. The extreme strong wind speed anomalies that burst in late October 2017 were attributed to the TC Lan and caused the extreme and coherent high NIKE events that were observed at the northern four mooring sites. Positive wind speed anomalies at 11°N were also found in November and late December 2017, which was consistent with the NIKE events observed at 11°N.
4 DISCUSSION
Typhoon induces large mechanical energy input to the ocean (Liu et al., 2008), causing strong vertical mixing of cold water from subsurface layer to surface, which in turn produce anomalous cold wakes. Here we present cases showing the influence of typhoon Lan on sea surface temperature (SST) and sea surface salinity (SSS).
Figure 13 shows the SST and SSS before the typhoon Lan on 14 October 2017 and after the typhoon Lan on 21 October 2017 and their differences between them (21 October minus 14 October 2017). The warm SST before typhoon Lan (14 October 2017, Fig.13a) was replaced by a cold cool along the TC track (Fig.13b), with the maximum SST decrease as much as 6°C at (131.4°E, 20.1°N, Fig.13c).
SST dropped of 1.8°C, 2.4°C and 1.1°C corresponding to pre-TC stage on 14 October 2017 occurred at the moorings location 17.5°N, 15°N, and 12.6°N, respectively. The high salinity north of 18°N was weakened due to typhoon’s passage in the western Pacifi c, with a maximal SSS decrease of 1.8. The typhoon-induced SSS drop might be primarily linked to the intense rainfall injecting fresh water into the ocean, but the SSS increase was predominant in the south of 18°N, with an increase up to 0.9 compared to pre-typhoon conditions, which was induced by winddriven mixing, bringing the saltier water from the deep ocean to the surface.
Hence, the energetic TC activities in the western Pacifi c Ocean led to a strong NIKE impulse and NIO in the upper ocean and showed signifi cant influences on oceanic environments. It seemed that mixing processes associated with the TC activities probably played an important role in shaping the oceanic environment. However, it remains unclear to what extent NIO caused oceanic mixing and how the TCsrelated mixing change the ocean. Further studies with sustained observations in the western Pacifi c Ocean are defi nitely needed.
5 CONCLUSION
A mooring array equipped with ADCPs was deployed in the tropical western Pacifi c Ocean along 130°E at 8.5°N, 11°N, 12.6°N, 15°N, and 17.5°N during September 2015–January 2018. We investigated the spatial pattern and temporal fluctuation of NIKE and its relationship to TC activities passing by the mooring array.
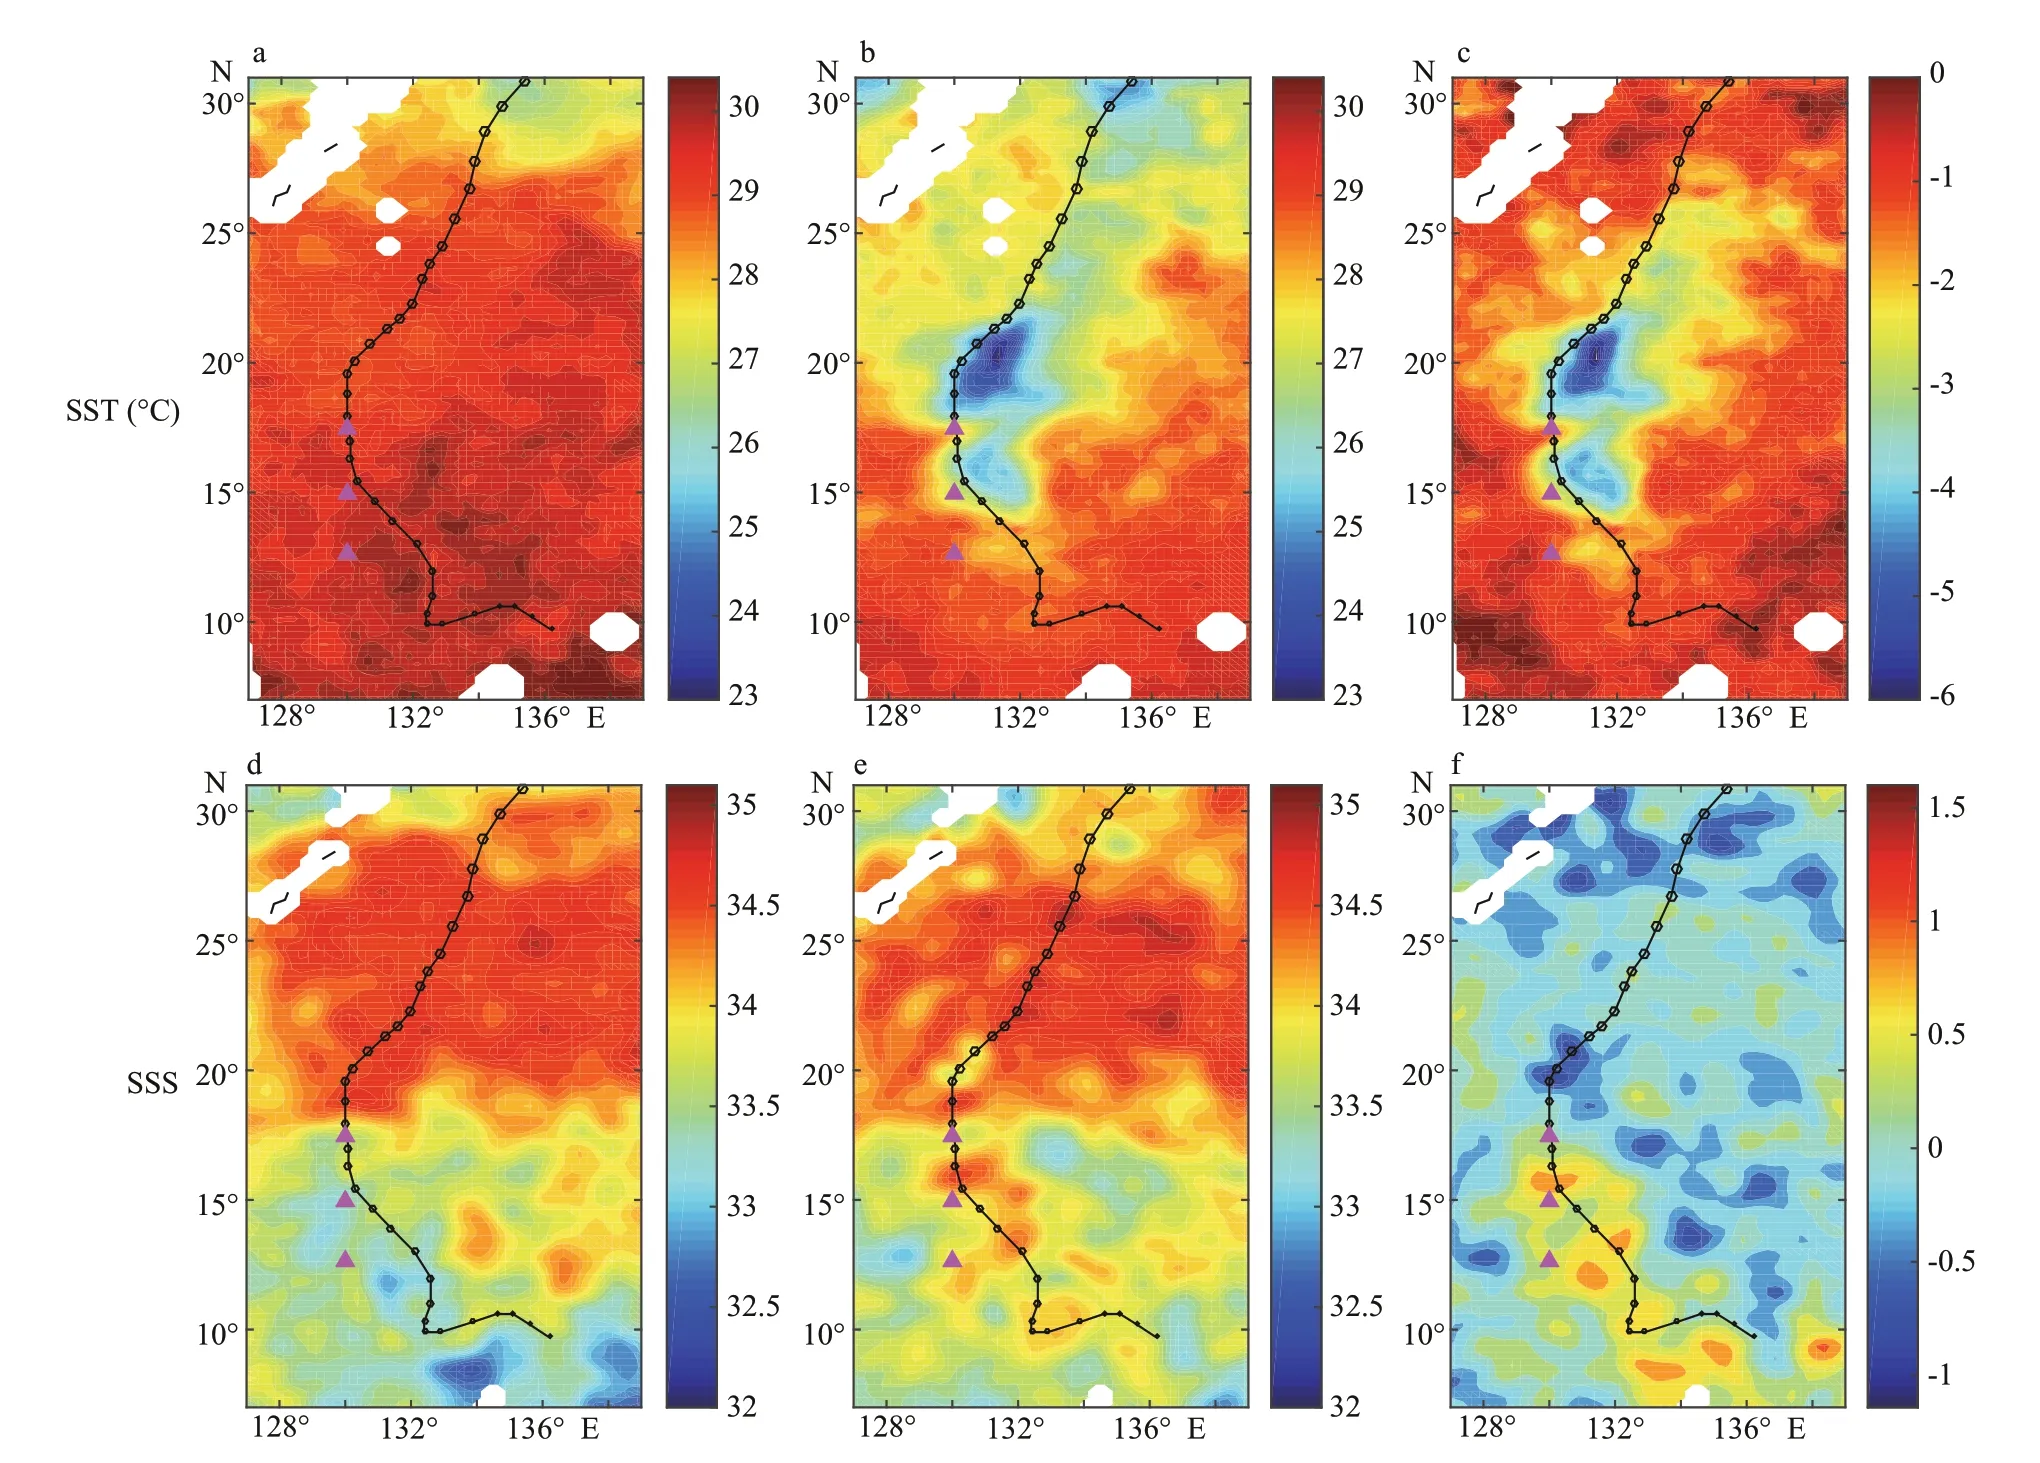
Fig.13 Sea surface temperature and salinity as typhoon Lan passed: SST (upper) and SSS (bottom) on 14 October 2017 and 21 October 2017 and their differences between them (21 October minus 14 October 2017)
Extreme energy penetration was detected during the high NIKE events. Spatial features of the observed NIKE were described, including the decay timescales and vertical distribution of NIKE, and the close relationship between the amplitude and variance of NIKE and latitudes. The NIKE showed signifi cant seasonal and low-frequency variability. At the mooring sites 17.5°N, 15°N, and 12.6°N, the NIKE peaks occurred in boreal autumn and the NIKE troughs were observed in boreal spring. In contrast, the NIKE at 11°N and 8.5°N showed peaks in winter and troughs in summer.
TCs and strong wind events played an important role in the emergence of high NIKE events. The region north of 12.6°N and centered at about 15°N had a much higher probability of TCs than surrounding regions, which was mainly due to frequent TCs happening in boreal autumns. The spatial distribution and seasonality of TCs explained the variability of NIKE events north of 12.6°N. The occurrence of high NIKE events in the south of 12.6°N were mainly caused by strong wind events during the corresponding periods. Further studies are needed to better understand how the ocean in response to the pass-by TCs and typhoons.
6 DATA AVAILABILITY STATEMENT
The SMAP salinity data are produced by Remote Sensing Systems and sponsored by the NASA Ocean Salinity Science Team and available at www.remss.com. The ERDDAP wind stress data can be found at https://coastwatch.pfeg.noaa.gov/erddap/index.html. The mooring data are available at the NPOCE website (http://npoce.org.cn).
7 ACKNOWLEDGMENT
We thank all the scientists, engineers, and crews from the R/V Kexue who deployed the mooring array and collected the ADCP data from the moorings. We are grateful to CHEN Gengxin for his valuable comments. Comments and suggestions from the two anonymous reviewers are of much help.
 Journal of Oceanology and Limnology2020年4期
- Journal of Oceanology and Limnology的其它文章
- Review on observational studies of western tropical Pacifi c Ocean circulation and climate*
- Research progress of TiO 2 photocathodic protection to metals in marine environment*
- Smart anticorrosion coating based on stimuli-responsive micro/nanocontainer: a review*
- Status of genetic studies and breeding of Saccharina japonica in China*
- To be the best in marine sciences*
- A review of progress in coupled ocean-atmosphere model developments for ENSO studies in China*
