Time-sensitivity mechanism of rock stress memory properties under tensile stress
Yuxin Ban, Xiang Fu, Qiang Xie,*, Jun Duan
a School of Civil Engineering, Chongqing University, Chongqing, 400044, China
b Key Laboratory of New Technology for Construction of Cities in Mountain Area, Chongqing University, Chongqing, 400044, China
c School of River and Ocean Engineering, Chongqing Jiaotong University, Chongqing, 400074, China
d Changjiang River Scientific Research Institute of Changjiang Water Resources Commission, Wuhan, 430010, China
Abstract In deep underground engineering, understanding of time-related stress memory properties is critical to evaluate the in situ stress conditions of a rock mass.In this study,the time-sensitivity mechanism of the rock stress memory properties under tensile stress was investigated. It was found that the material property (Poisson’s ratio) and crack angle were the controlling factors of the Kaiser effect (KE) under tensile stress.In particular,the time-sensitivity of the stress memory properties was closely related to the crack growth path.When the failure of the rock specimen was dominated by tensile microcracks and the crack development direction was deflected by up to 30in the successive loading process, the stress memory capacity was likely to be time-independent for a sandstone specimen. The distribution of the Felicity ratio in a Brazilian test was more discrete than that in a three-point bending test.It also showed that the changes in the crack path,rather than the time interval between successive loading cycles,led to inaccuracy of the detected KE. This study provides insights into stress memory-related issues under uniaxial or more complex stress conditions and thus facilitates development of methods for testing in situ mechanical behaviors of rocks with acoustic emission (AE) technology.
2020 Institute of Rock and Soil Mechanics, Chinese Academy of Sciences. Production and hosting by Elsevier B.V. This is an open access article under the CC BY-NC-ND license (http://creativecommons.org/licenses/by-nc-nd/4.0/).
Keywords:Acoustic emission (AE)Time-sensitivity Stress memory Kaiser effect (KE)Brazilian disc rotation Power spectrum
1. Introduction
The mechanical behaviors related to rock mass in deep underground engineering, for example energy extraction, tunnel excavation,CO2storage,and nuclear waste disposal(Sellers and Klerck,2000;Sone and Zoback,2014;Liu et al.,2019),have been the focus of recent investigations.Rapid and accurate measurement of in situ stress is a prerequisite for establishing the mechanical theorem of rocks(Xie,2017).Acoustic emission(AE)technology is widely used for measuring rock in situ stress because it is more efficient, less labor-intensive,and more ecofriendly than hydraulic fracturing and overcoring methods.The technique is based on the stress memory of the rock material as rock can accumulate and reproduce the experienced stress history (Lavrov, 2003).
If the stress memory capacity decreases (or disappears) over time after rock core is drilled underground, the in situ stress measured using AE will be inaccurate. Previous studies have indicated that the time effect should be considered when measuring the in situ stress with the Kaiser effect(KE)(Lehtonen et al.,2012).The AE activities are calm when the redistributed stress is smaller than the previous peak stress,and AE activities are dramatic when the stress exceeds the previous peak stress (known as the KE).However, the results concerning the time-sensitivity of rock specimens are somewhat controversial. Some researchers have observed the time-delay phenomenon. Goodman (1963)indicated that time periods of 2 h for Berea sandstone and 9 h for quartz diorite were sufficient for dissipating the KE.Michihiro et al.(1991)argued that the previous maximum stress was only detectable within 20 d. Hardy (1996) suggested that the memory of rock salt was reduced by 21%after one year.Jin et al.(2009)confirmed that limestone was highly time-sensitive under uniaxial compression and suggested that in situ stress should be measured within a time period of 40e120 d.In these studies,investigations were conducted on different types of rocks under different stress conditions. The rock stress memory capacity generally decreased over time intervals ranging between hours and years. However, other researchers reported that the rock stress memory was timeindependent. Shin and Kanagawa (1995) indicated that the KE was still observed after 300 d for granite. Seto et al. (1999) found that the assessment of the previous in situ stress was still reliable after seven years.In addition to the uncertainty of the experimental results, researches on the time-sensitivity mechanism are not mature (Holcomb and Stevens,1980; Yamshchikov et al.,1995).
Although the time-sensitivity of rock stress memory under compressive stress has been widely studied,that under tensile and shear stresses has rarely been investigated.Rock mass failure under compressive stress is a combined effect of micro-tensile and microshear failures. Wong and Einstein (2009) proposed a systematic scheme for identifying the crack type. They divided the cracks appearing in rocks under uniaxial compressive stress into tensile,shear, and tensileeshear mixed cracks. This scheme was validated via the method of moment tensor inversion in AE tests(Wong and Xiong, 2018). In Fig.1, the blue element represents a tensile crack,the red element represents a shear crack, and the green element represents a tensileeshear mixed crack. The proportional contributions of the tensile and shear failures under compressive stress were related to the height-to-width ratio of the rock specimen.This phenomenon was also examined by Golshani et al. (2006) and Hamdi et al. (2015).
The objective of this study is aimed to the following two questions: (1) Is the stress memory effect of sandstone specimen sensitive to time? (2) What is the controlling factor of the timesensitivity under tensile stress?
2. Theorem of stress memory
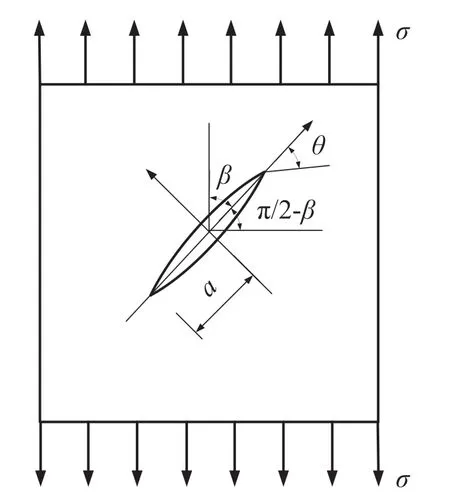
Fig. 2. Crack direction deflecting angle p=2 in the reloading process, and the farfield tensile stress acting on the infinite plane.
In this section, the microscopic mechanism of the stress memory property is examined using the classical strain energy density theory proposed by Sih (1974). We selected a rock specimen subjected to tensile stress so that mode I microcrack could be formed.Then,the specimen was unloaded and stored.After some time,the specimen was reloaded till failure.When KE occurred,the original microcracks acted as pre-existing cracks, and the existing crack propagation was easier than the nucleation and initiation of new microcracks. Subsequently, stress redistribution led to cracking activities,including propagation of the original microcracks and the nucleation, initiation, and propagation of new microcracks (Zhou et al., 2018). As the microcrack behaviors at the point when the previous peak stress is reached determine whether the KE exists,the re-propagation process of a single microcrack occurs under farfield tensile stress.
The Felicity ratio (FR), which is defined as the ratio of the previous peak loadPmaxto the AE onset loadPAE,is usually adopted to detect the KE (Lehtonen et al., 2012; Fu et al., 2015). The FR is a quantitative parameter that reflects internal defects and historical damage information of materials.FR is important for evaluating the stress memory capacity(Lavrov,2003),which is generally accepted that the KE exists when the FR is in the range of 0.9e1.1.
The rock material is considered to be linear and elastic. For the plane strain problem shown in Fig.2,an infinite plane is subjected to a unidirectional uniform tensile stressacting in the far-field.A two-dimensional (2D) straight crack penetrates the middle of the plane,and the crack is perpendicular to the far-field stress direction in the preloading period. The direction deflects p=2in the reloading process, whererepresents the angle between the tensile stress and the crack surface, which is called the “crack angle”hereinafter.
For the mixed-mode I-II crack, the critical stress ratioc=0is expressed as follows:

The solution for the critical stress ratioc=0is given below.When the fracture angle(the angle between the crack propagation direction and crack surface) isand the shear modulus is m, we obtain the plane strain coefficients as follows:

The strain energy density factorSis expressed as

where the stress intensity factors areandThe direction of crack propagation is determined by the minimum value (Smin) at

Substituting Eq. (3) into Eq. (4) yields

MATLAB (Version, 2015) was used to solve the problem via Newton’s iteration method,and the results are presented in Table 1.The critical stress ratioc=0generally decreased monotonically with an increase in the Poisson’s ratioor the crack angle. To obtain insight into the regularity,the relationship between critical stress ratioc=0, crack angle, and Poisson’s ratiois plotted in Fig. 3. With an increase in Poisson’s ratio, it shows that the influence of the crack angleonc=0decreases. The critical stress ratioc=0exhibited similar trends with different Poisson’s ratios.For example,when0.1,c=0tended to infinity whentended to be 0and approached 1 at90. The microcrack could not grow when the far-field tensile stress was coplanar with the crack surface, and the microcrack grew at0when the far-field tensile stress was perpendicular to the crack surface. Furthermore, when the crack anglechanged in the range of approximately 75e90,i.e. the crack was deflected by approximately 0e15, the critical stress ratio wasc=0<1.1.
The results qualitatively explained the time-sensitivity mechanism of the KE under tensile stress. The critical stress ratio was a function of the material property (Poisson’s ratio) and loading direction(crack angle).For some materials,the Poisson’s ratiois constant; thus, the detected FR is substantially controlled by the crack anglein successive loading processes, indicating the timesensitivity of the stress memory when tensile stress is induced by the changes in the stress path.
If the microcrack grows exactly along the original path when reloaded after a time period and FR is equal to 1, the specimen is time-independent. In contrast, when the stress path changes during reloading,the influence of the time delay on the stress memory depends on the crack angle.
3. Test and verification
3.1. Testing design
To confirm the controlling effect of the crack angle, indirect tensile experiments were conducted, including three-point bending and Brazilian tests. Details of the grouping and loading scheme are presented in Table 2.There were five specimens in each group of F1 and Y1. All the specimens were loaded until failure to determine their tensile strengths. The results indicated that theaverage ultimate loads in the three-point bending and Brazilian tests were approximately 4 kN and 40 kN, respectively.
Table 1Results for calculations of the critical stress ratio c=0 via the strain energy density method.

Table 1Results for calculations of the critical stress ratio c=0 via the strain energy density method.
images/BZ_108_1318_2441_1333_2470.png (images/BZ_108_1351_2439_1362_2459.png) images/BZ_108_1478_2441_1493_2470.pngc=images/BZ_108_1519_2441_1534_2470.png0 images/BZ_108_1478_2497_1490_2526.png images/BZ_108_1498_2498_1519_2525.png 0 images/BZ_108_1651_2497_1665_2526.png images/BZ_108_1671_2498_1693_2525.png 0.1 images/BZ_108_1843_2497_1857_2526.png images/BZ_108_1863_2498_1885_2525.png 0.2 images/BZ_108_2035_2497_2049_2526.png images/BZ_108_2055_2498_2076_2525.png 0.3 images/BZ_108_2226_2497_2240_2526.png images/BZ_108_2247_2498_2268_2525.png 0.4 10 6.021 5.497 4.892 4.135 3.052 15 4.05 3.721 3.338 2.85 2.13 20 3.073 2.844 2.575 2.225 1.689 25 2.493 2.325 2.128 1.864 1.443 30 2.109 1.985 1.837 1.635 1.295 35 1.838 1.745 1.635 1.48 1.205 40 1.636 1.568 1.488 1.372 1.153 45 1.482 1.432 1.376 1.293 1.125 50 1.361 1.326 1.288 1.233 1.113 55 1.264 1.241 1.218 1.185 1.11 60 1.187 1.188 1.165 1.144 1.107 65 1.187 1.151 1.121 1.108 1.099 70 1.156 1.119 1.082 1.076 1.082 75 1.129 1.091 1.059 1.047 1.057 80 1.104 1.065 1.05 1.023 1.03 85 1.078 1.045 1.012 1.006 1.008
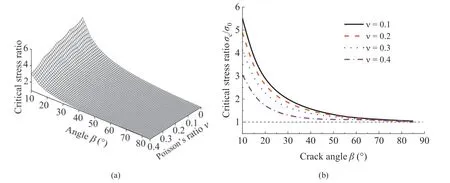
Fig.3. Critical stress ratio c=0 with respect to the Poisson’s ratio and crack angle .(a)c=0 decreased monotonically as and increased;and(b)c=0 approached 1 when approached 90.

Table 2Specimen grouping and loading scheme.
The other specimens were preloaded (0 d) and reloaded to complete damage after certain time intervals.The time delays were 1d,3d,7d,13d,21d,35d,and 60 d in both the three-point bending and Brazilian tests (i.e. the time intervals were 2d, 4d, 6d, 8d,14d,and 25 d). The time-delayed specimens used in the three-point bending and Brazilian tests were each divided into seven groups.Additionally, FB and YB groups each containing five specimens were used for parallel test. The time-delayed specimens were preloaded to 60% of the ultimate load to ensure that cracks were generated in the specimens (Lavrov, 2003). The preloading was maintained for 60 s and repeated twice to enhance the stress memory (Michihiro et al., 1989). The loading rates were set as 0.025 kN/s and 0.1 kN/s for the three-point bending and Brazilian tests,respectively.All the specimens were loaded at the same point in the successive loading processes, particularly in the Brazilian discs.
3.2. Test preparation
According to Lavrov et al.(2002),a rock specimen can be treated as“fresh”when(a)the rock is shallowly buried so that recent in situ stress in the rock is negligible or far smaller than the applied stress in the following testing program; and (b) the KE of the rock specimen disappears over time and thus the geological stress is not memorized.A period of several hours is sufficient for sandstone to lose its stress memory under compressive stress(Goodman,1963).Environmental factors, such as confining pressure and water saturation, may have a time effect on the rock properties. Time intervals in field sampling, rock specimen processing, and indoor tests are inevitable.If the KE weakens or even disappears owing to the time delay, this is a type of time effect. Compacted sandstone was collected from an outcrop in a quarry in Zhongliang Mountain,Chongqing,China.It is noted that previous in situ stress applied to the sandstone specimens was negligible.
For the three-point bending tests, 40 mm40 mm160 mm prismatic rectangular specimens were used.For the Brazilian tests,10050 mm discoid specimens were used. The sandstone specimens were strictly prepared in accordance with International Society for Rock Mechanics and Rock Engineering (ISRM) guidelines.The specimen surfaces were finely polished with emery paper to control the flatness within0.02 mm. The end faces were perpendicular to the specimen axis, and the allowable deviation was0.25.The uniaxial compression strength was approximately 90 MPa, the porosity was approximately 5.15%, and the average longitudinal wave velocity was 3800 m/s. The specimens with longitudinal wave velocity deviating excessively from the average value were removed to ensure that the test specimens were comparatively uniform.
The specimens were loaded on a WAW-1000 Rock Mechanics Test System(Fig. 4). A new high-speed 8-channel PCI-2 AE instrument from PAC Company was used for automatic monitoring of AE signals. The recording frequency was 106s1. The signals from the AE sensors were amplified 40 dB by using preamplifiers. The Micro30 AE sensor had an operating-frequency range of 150e400 kHz and a fairly flat resonance frequency of 225 kHz.
Six AE sensors were prepared for each specimen. For the prismatic rectangular specimen, two AE sensors were symmetrically arranged on three rectangular surfaces (excluding the lower supporting surface). For the disc specimen, three AE sensors were arranged on each flat surface. Vaseline was used as a coupling agent between the specimen and AE sensors,and rubber rings were used to attach the sensors firmly to the specimen surfaces. A rubber gasket was placed between the specimen surface and the supporting point to reduce noise.
3.3. Test results

Fig. 4. Test equipment and specimen installation.
The cumulative AE count-time-load relationship was adopted to recognize the KE(Kaiser,1953;Yamshchikov et al.,1995;Browning et al., 2017, 2018). Figs. 5 and 6 present the cumulative AE counttime-load relationships for the prismatic rectangular and disc specimens during the reloading process after certain time intervals,respectively. The cumulative AE count curves exhibited similar trends.Few AE counts were observed during the initial loading,and the AE counts gradually increased when the load increased.Generally,an obvious inflection point was detected.The microcrack activities were relatively calm in the indirect tensile tests compared with the uniaxial compression tests; and a slow-increase stage always followed the inflection point(Zhang et al.,2018).The AE count increased shortly before the end of the test, indicating fracture of the specimen.
For the three-point bending test(Fig.5),the KE was detected at approximately 2.5 kN in the second loading process. The AE onset corresponded to loads of 2.52 kN,2.5 kN,2.41 kN,2.53 kN,2.58 kN,2.5 kN,and 2.61 kN.Therefore,the FR values were 1.01,1,0.96,1.01,1.03,1, and 1.04, respectively. In the Brazilian test (Fig. 6), the AE onset loads were 26.74 kN,24.61 kN,23.67 kN,23.25 kN,26.65 kN,25.21 kN,and 25.57 kN,and the FR values were 1.07,0.98,0.95,0.93,1.07,1.01, and 1.02, respectively.
The FR values of all the specimens are plotted in Fig.7.Detailed information is presented in Table A1 in Appendix. The FR values were in the range of 0.9e1.1 in both the three-point bending and Brazilian tests. The KE in the sandstone specimen was timeindependent within 60 d under tensile stress, indicating that the stress memory property of the sandstone specimen under tensile stress within 60 d was not time-sensitive.The experimental results were consistent with the theoretical predictions. However, we observed a distinct difference:the distribution of the FR values was concentrated in the three-point bending test, whereas the distribution was apparently discrete in the Brazilian test. Was the sandstone disc more time-sensitive than the prismatic specimen?If not, what factors contributed to this difference?
Considering that the time-sensitivity of the KE under tensile stress was substantially controlled by the crack angle, it is assumed that the changes in the stress path induced the aforementioned difference.The deviation in the principal stress axes (changes)led to changes in the difficulties of re-cracking the original crack (changes inc=0); thus, the FR changed. Moreover, a high sensitivity of the KE to the rotation of the loading direction during the Brazilian test for brittle rocks was observed(Lavrov et al.,2002).Thus,another series of Brazilian tests was designed to examine the influence of the disc rotation on the stress memory,as described in Section 3.4.
3.4. Effect of disc rotation on stress memory
The direction independence of the rock KE is another critical proposition. Lavrov et al. (2002) concluded that the KE entirely disappeared when a limestone specimen was rotated by 15in the second loading period. We conducted diametrical compression tests on compact sandstone with dimensions of175 mm30 mm.The cyclic load path is shown in Fig. A1a in Appendix (Xie et al.,2018). The KE was still detectable when the sandstone specimen was rotated within 35; however, the KE disappeared when the specimen was rotated by 60(see Table A2 and Fig. A1 in Appendix). To eliminate the effects of the material properties and specimen sizes on the stress memory,we performed another series of Brazilian tests that involved disc rotation with the same experimental conditions and setup, as described in Section 3.2.

Fig.5. Cumulative AE count-time-load curves of the specimens in the three-point bending tests with time delays of(a)1 d(FB1-3),(b)3 d(FB2-2),(c)7 d(FB3-4),(d)12 d(FB4-2),(e) 20 d (FB5-2), (f) 35 d (FB6-1), and (g) 60 d (FB7-3).
The specimens were initially preloaded to approximately 60%of the ultimate tensile load, i.e. 25 kN, along the direction of the dashed line in Fig. 8a and then immediately reloaded along the direction of the solid line after rotation. The specimens were divided into the groups FS1,FS2,FS3,and FS4,with five specimens in each group.The specimens of these groups were rotated by 10,20, 30, and 35, respectively.
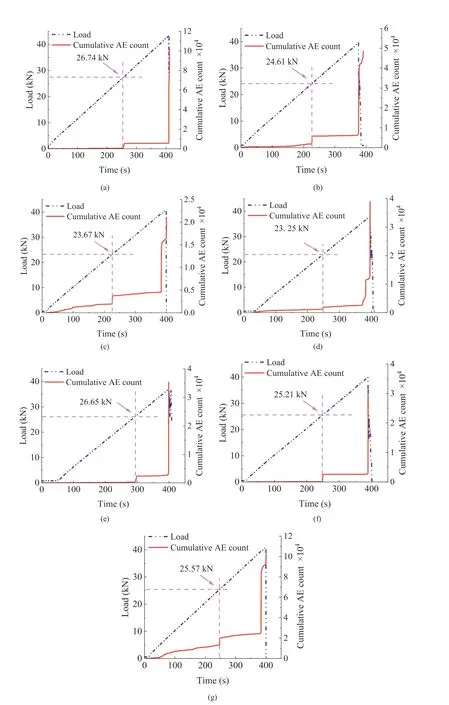
Fig. 6. Cumulative AE count-time-load curves of the specimens in the Brazilian tests with time delays of (a) 1 d (YB1-1), (b) 3 d (YB2-2), (c) 7 d (YB3-5), (d) 12 d (YB4-4), (e)20 d (YB5-2), (f) 35 d (YB6-1), and (g) 60 d (YB7-4).

Fig.7. Distribution of the FR values vs.the time delay in the(a)three-point bending test and(b)Brazilian test.Detailed information is presented in Table A1 in Appendix.The red,blue, green, brown and purple lines represent the FR values of the first, second, third, fourth and fifth specimens in each group, respectively.
Fig.8b shows the distribution of the FR values(for detailed data,see Table A3 in Appendix). Here, the grey background zone represents a valid scope. When the specimens were rotated by 10and 20, the FR values were located in the grey zone, and the KE was detectable.When the specimens were rotated by 30,60%of the FR values were valid, and they tended to fluctuate toward the boundary.When the specimens were rotated by up to 35,only 20%of the FR values were valid, and the KE disappeared.
The rotation of the disc specimen changed the stress path,leading to fluctuations in the FR values. With an increase in the rotation angle, the KE became undetectable gradually and disappeared finally.Thus,the discreteness of the sandstone KE during the Brazilian test was suggested to be induced by stress path,rather than by time interval.
4. Microscopic damage mechanism
In this section,we aimed to understand the following concepts:(a) the stress memory of sandstone under tensile stress is timeindependent, (b) the KE under tensile stress is controlled by the Poisson’s ratio () and the crack angle, and (c) the change in the stress path is an inherent reason for the differences in the KE between the three-point bending and Brazilian tests.For this,the shift from macroscopic fracture to microscopic damage mechanism was studied to identify that other factors may contribute to these characteristics.
4.1. Method of AE power spectrum
AE waveform data include abundant historical information on rock deformation and fractures. Previous studies involving AE spectra and rock AE experiments confirmed that crack initiation and propagation were closely associated with the AE dominant frequency distribution (Cai et al., 2007; Mao and Towhata, 2015;Kong et al., 2017). Studies are increasingly focusing on AE waveform-based methods rather than parameter-based methods owing to their advantages, such as damage assessment(Sauerbrunn et al.,2017),source location(Mostafapour et al.,2014;Comino et al., 2017), and source-type recognition (Grosse and Finck, 2006; Graham et al., 2010; Rodriguez et al., 2017).
Two AE data analysis methods proposed by Behnia et al.(2014)e classical AE time-domain data were transformed via the fast Fourier transform into the frequency domain (Fig. 9) and via the short-time Fourier transformation (STFT) into the time-frequency domain (Figs. 12 and 14) e were used to analyze the AE dominant frequency characteristics. The frequency corresponding to the maximum waveform amplitude was defined as the dominant frequency(Ban et al.,2020).The amplitude-frequency relationship was called the power spectrum (Cai et al., 2007).
The AE waveform frequency range is closely related to the test material (Tian et al., 2017). In the present study, frequencies of<150 kHz were defined as “low-frequency,” and frequencies of>250 kHz were defined as “high-frequency.” The profiles of the power spectra exhibited significant differences. Among thousands of waveforms obtained in the three-point bending and Brazilian tests, the following two types were most common: the dominant frequency in the high-frequency band (Fig. 9a) and the dominant frequency in the low-frequency band(Fig.9b).The power spectra in Fig. 9 were obtained randomly.
4.2. Influence of time delay on AE power spectrum
One specimen from group FB1, whose time delay of successive loading cycle was the shortest(1 d),and one specimen from group FB7, whose time interval was the longest (60 d), were compared.The dominant frequencies of all the AE items were extracted to draw scatterplots,as shown in Fig.10.The power spectra of the two specimens exhibited similarities.Along the time axis,the dots were few before the AE onset, numerous during the AE onset, few thereafter,and abundant prior to final failure.Along the amplitude axis, a high-frequency band at approximately 300 kHz and a lowfrequency band at approximately 125 kHz were observed for both specimens. The low dominant frequency components mainly appeared at the AE onset and final burst moment.Excluding these moments,the dots located in the high-frequency band were more abundant than those in the low-frequency band.
Three-dimensional (3D) joint time-frequency analyses were performed to investigate the micro-damage of the specimens. The AE waveform data were processed using STFT software package in MATLAB (Fig. 11). A single waveform peak corresponded to one major AE source,and double waveform peaks corresponded to two major AE sources. The 3D joint time-frequency spectra had unimodal characteristics in the high-frequency band. Considering that the dominant frequency was mostly distributed in the highfrequency band, it was concluded that the two specimens failed due to the same reason.

Fig. 8. Schematic of (a) specimen rotation, and (b) distribution of the FR values for the rotated sandstone discs.
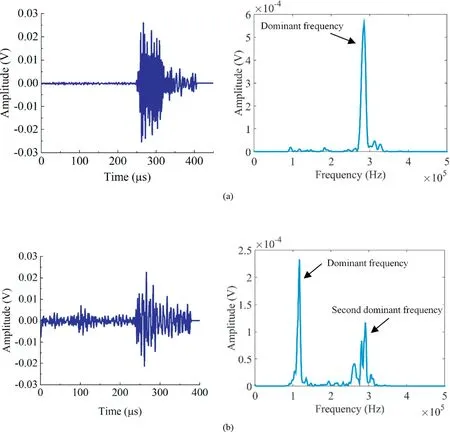
Fig.9. Time-domain AE data transformed into the frequency domain.Two typical AE power-spectra characteristics:(a)High dominant frequency,and(b)Low dominant frequency.
For sandstone, AE signals were mainly caused by the crack nucleation,crack growth,and crack closure,and the relative sliding of crack surfaces was induced by crack friction (Mao and Towhata,2015). Researchers have invested considerable time in relating different AE types to physical processes (e.g. Lockner et al.,1992;Schubnel et al., 2007; Ghaffari et al., 2015; Brantut, 2018). For example, Bhuiyan and Giurgiutiu (2018) divided 427 AE hits into nine groups according to the time-domain signals and frequencyspectrum characteristics. Their results indicated that the high dominant frequency signals were induced by microcrack extension,whereas the low dominant frequency signals corresponded to the friction on microfracture surfaces. However, Li et al. (2017) and Zhang et al. (2018) reported that a high dominant frequency was induced by micro-shear failure and a low dominant frequency was produced by micro-tension failure. Mao and Towhata (2015) reported that the tensile fracture of a single particle was characterized by a high AE frequency and the sliding fracture by a low AE frequency.
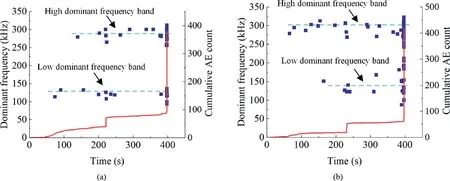
Fig.10. Dominant frequency distribution of specimens tested after time delays of (a) 1 d and (b) 60 d in the three-point bending test. The red line represents the cumulative AE count, and the blue point represents the dominant frequency.
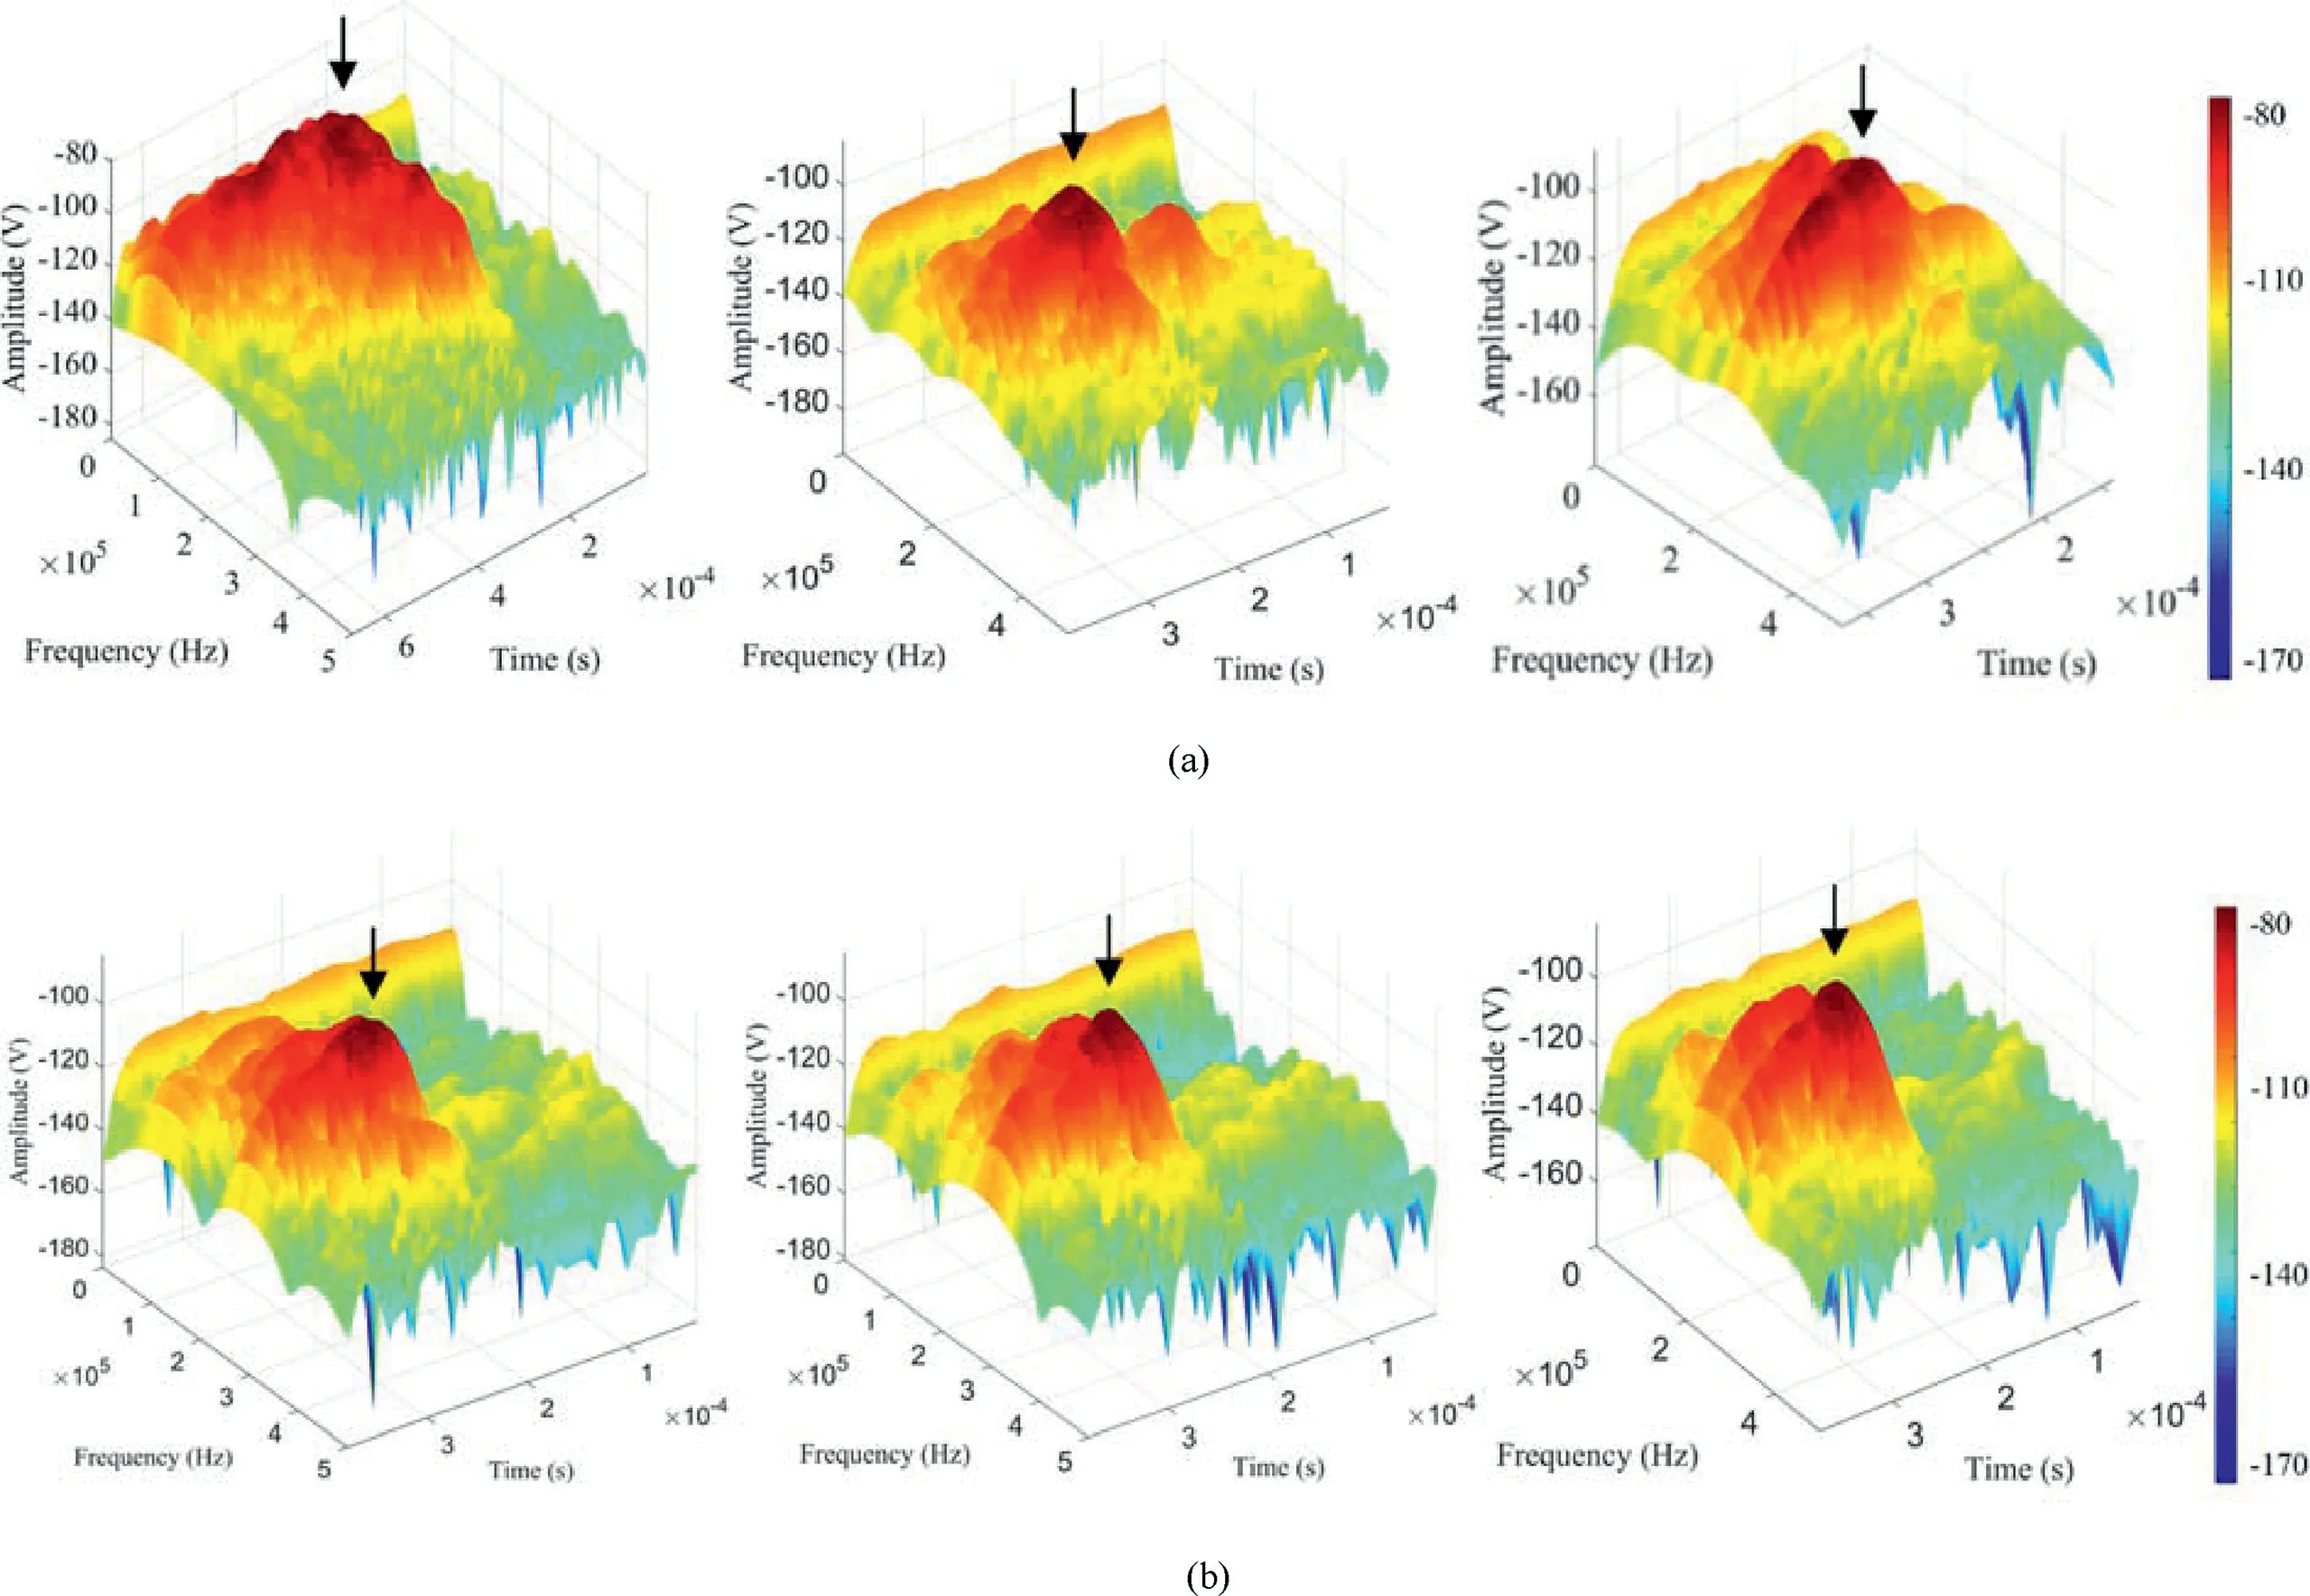
Fig.11. Unimodal waveform feature in the 3D time-frequency spectra after time delays of (a) 1 d and (b) 60 d in the three-point bending test.

Fig.12. Dominant frequency distributions of the specimens tested after time delays of(a)1 d and(b)60 d in the Brazilian test.The red line represents the cumulative AE count,and the blue point represents the dominant frequency.

Fig.13. Unimodal waveform feature of the 3D time-frequency spectra after time delays of (a) 1 d and (b) 60 d in the Brazilian test.
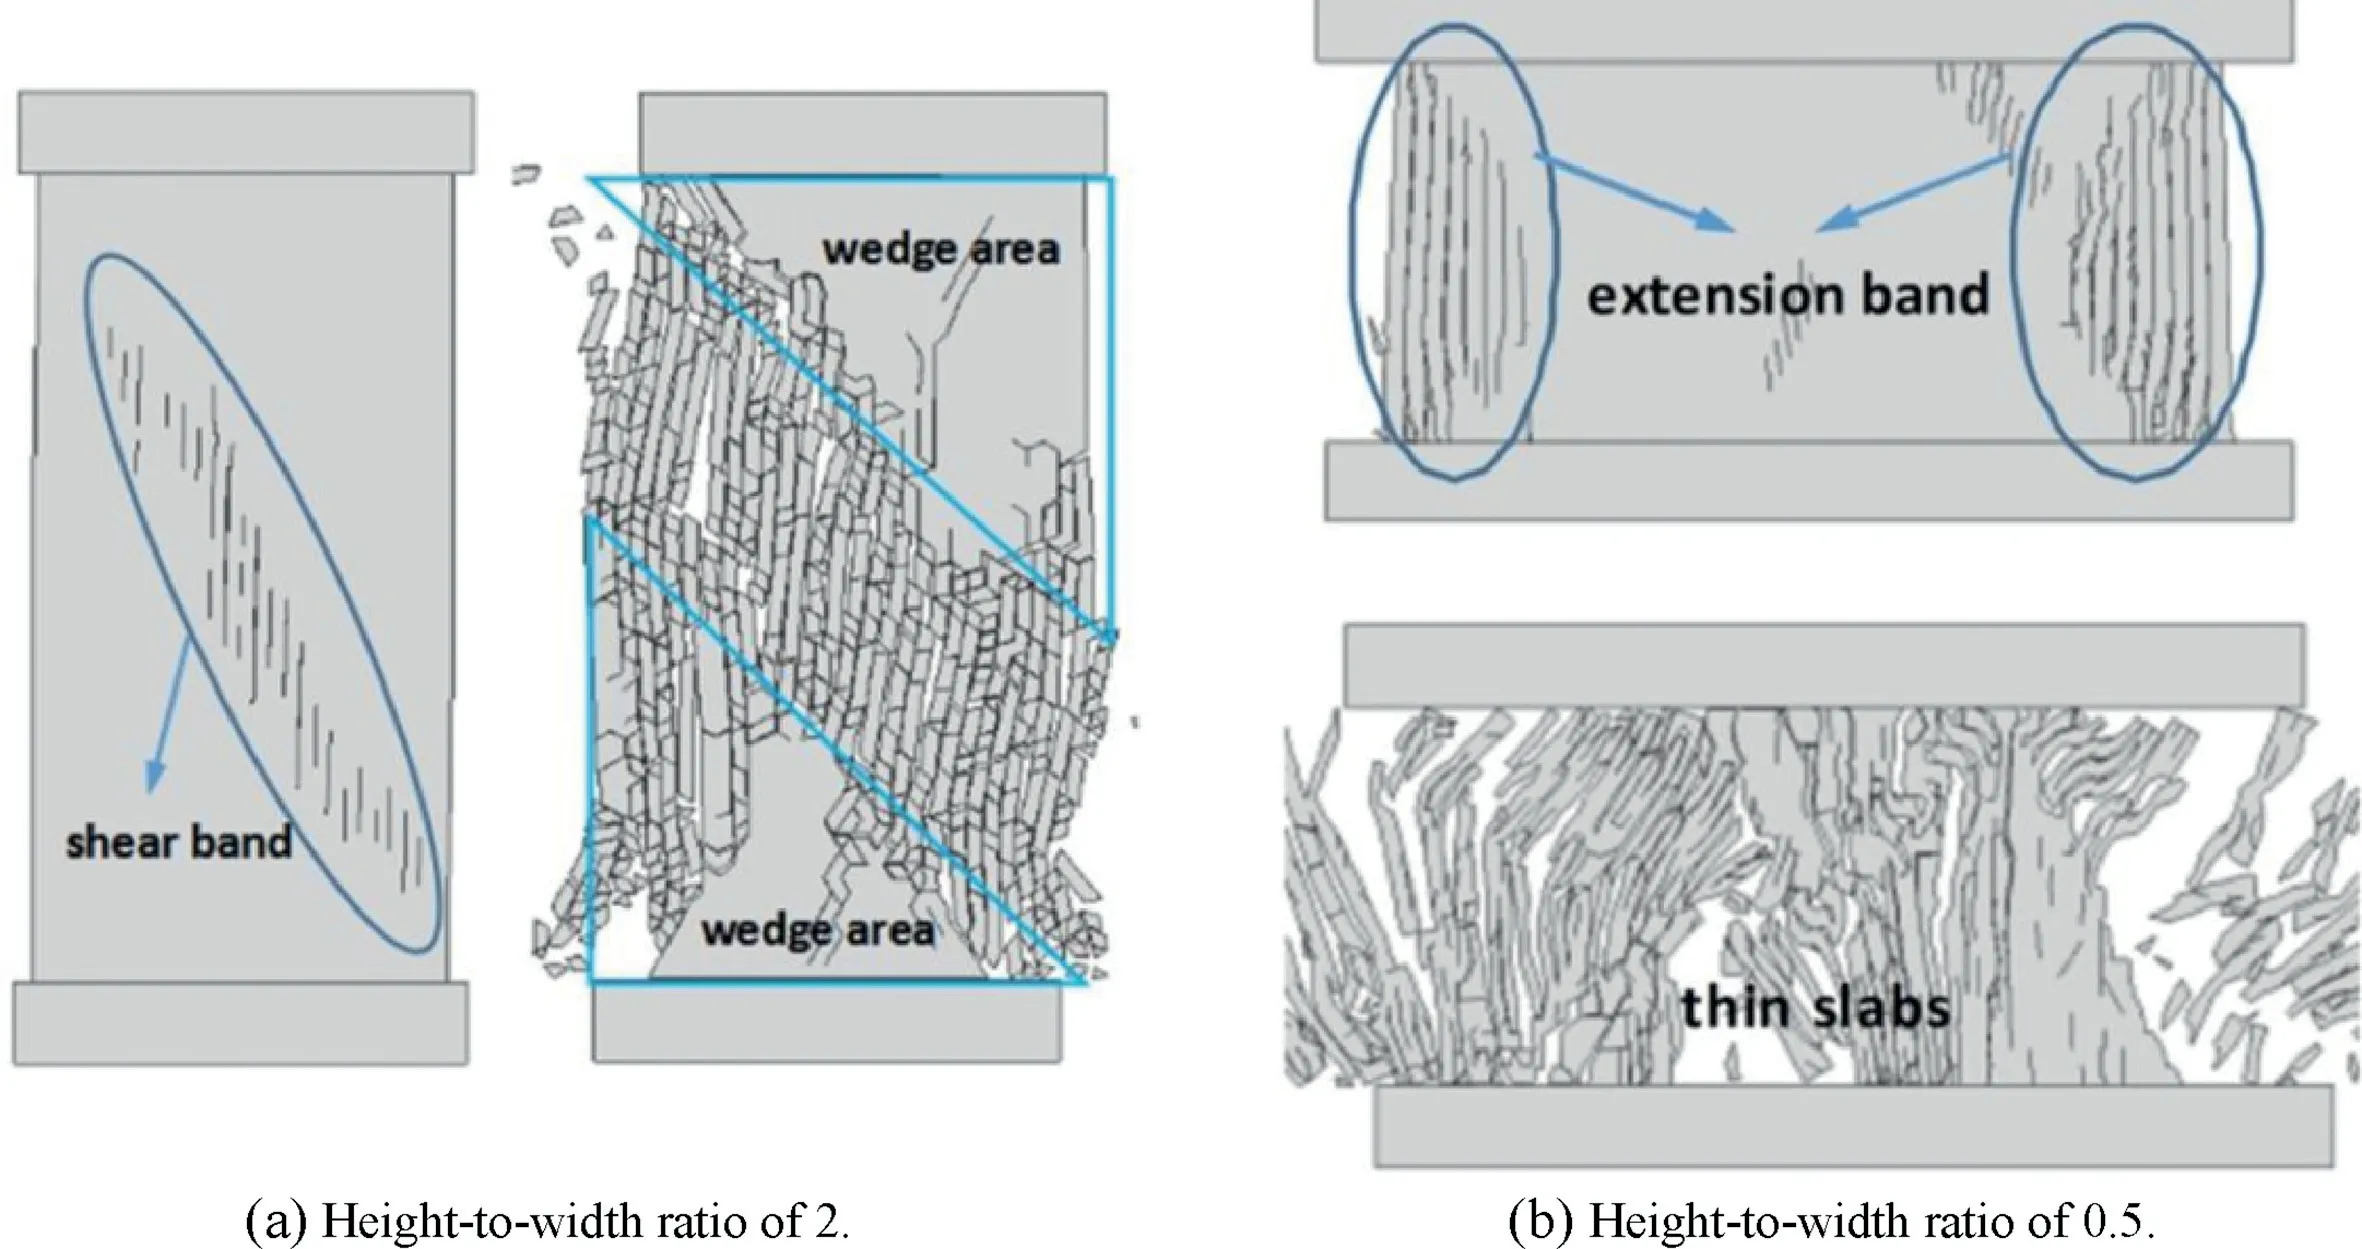
Fig.14. Effects of the rock specimen’s height-to-width ratio on the failure modes (Feng et al., 2017).
Apparently, in the three-point bending test,the high dominant frequency was induced by tensile microcracks, and the low dominant frequency was induced by shear microcracks.Only a few shear microcracks appeared,at three points:initial loading,AE onset,and final fracture.The relatively large shear force at the support points may have been responsible for these micro-shear signals. Most importantly, the time interval hardly affected the micro-damage mechanism of the sandstone specimen. Tensile microcracks were the major reason for the failure of the sandstone in the three-point bending test regardless of how long the specimen was stored after preloading.
Similar analyses were performed on the specimens using the Brazilian test.Fig.12 shows the dominant frequency distributions of the AE signals of YB1-1 and YB7-4, whose time intervals were the shortest (1 d) and the longest (60 d) among these specimens,respectively.Compared with the three-point bending test,the total number of AEs was very large in the Brazilian test. The dominantfrequency components were significantly concentrated in the high-frequency band(approximately 250e300 kHz)from the initial loading to the final failure. The high dominant frequency components were more abundant than the low counterparts,because the low dominant frequency components accounted for less than 0.5%of all the dominant frequency components. Additionally, the unimodal waveform located in the high-frequency band in the 3D time-frequency spectra (Fig. 13) indicated that regardless of the time interval,there was a single AE source in the Brazilian test.The distribution regularity of the power spectra confirmed that the high-frequency components at approximately 300 kHz corresponded to tensile microcracks, whereas the low-frequency components at approximately 125 kHz corresponded to shear microcracks.
In summary,the power-spectra characteristics of the sandstone specimens were time-independent when the specimens were reloaded after time intervals up to 60 d. The dominant-frequency components were concentrated on the high-frequency band, indicating that the tensile microcracks significantly contributed to the failure progress in both the three-point bending and Brazilian tests.Thus, among the factors considered, the time-sensitivity of the stress memory of the sandstone specimen under tensile stress was only affected by the stress path.
5. Discussion
According to the theoretical derivation, the FR values were lower than 1.1 when the microcrack was rotated with angles within approximate 0e25(see Table 1), and the Poisson’s ratio was usually approximately 0.2e0.4 for sandstone. These results are highly consistent with the experimental results presented in Section 3.4.When the sandstone specimens were rotated by up to 30,the FR values became invalid. Xie et al. (2018) reported that the critical valid rotation angle was 35for sandstone,and Lavrov et al.(2002) reported that it was 15for limestone. Multiple cracks initiate and grow in the loading process,leading to the differences between theoretical and experimental results for the critical angle.Further studies are needed on the micro-mechanisms to identify the reason for the differences.
The results confirmed the time-sensitivity mechanism of the stress memory properties under tensile stress.The size effect has a significant impact on the failure mode of brittle rock specimens under uniaxial compressive stress.The numerical results in Fig.14(Feng et al., 2017) indicated that the failure of a specimen with a large height-to-width ratio was caused by both micro-tensile and shear microcracks, whereas the failure of a specimen with a small height-to-width ratio was primarily controlled by tensile microcracks. This debates previous results regarding the rock stress memory under compressive stress.
Various rock types, such as sandstone, rock salt, granite, and limestone, were tested under compressive stress (e.g. Goodman,1963; Hardy, 1996). They concluded that the stress memory of these rock types was time-dependent under compressive stress.As rock failure controlled by tensile microcracks was timeindependent, it was reasonable to infer that the time-sensitivity under compressive stress was mainly induced by the shear microcracks.
However, other researchers (e.g. Seto et al., 1999) argued that the stress memory of rock specimens was time-independent under compressive stress.One interpretation for this was that the failure of the rock specimens was mainly controlled by tensile microcracks.Another possible explanation was that when the amount of shear microcracks was predominant,the time-independence of the stress memory was tenable under certain conditions. It should be noted that when the friction coefficient on the fracture surface changed between 0.1 and 0.4, the stress memory property was time-dependent. The methodology of this study can be applied to the cases involving compressive or more complex stress conditions.
6. Conclusions
The time-sensitivity of the stress memory properties under tensile stress was theoretically and experimentally investigated.The results confirmed that the stress memory of a sandstone specimen was likely to be time-independent under certain conditions. When the failure of the sandstone specimen was predominantly caused by tensile microcracks and crack path changes within 30, the stress memory properties were not time-sensitive. The material property (Poisson’s ratio) and crack angle affected the stress memory properties.According to the results,the conclusions were drawn as follows:
(1) The FR values were concentrated in the distribution for the sandstone three-point bending test, whereas those for the Brazilian test were scattered in the range of 0.9e1.1. This difference was induced by changes in the stress path,rather than by the time delay.When specimens were rotated by up to 30in the reloading process,the KE became gradually less pronounced and completely disappeared.Thus,it suggested that three-point bending test was more suitable than Brazilian test for investigating the time-history of peak stress with the KE.
(2) The power-spectra characteristics of the AE waveform proved that the specimens failed owing to tensile microcracks in both three-point bending and Brazilian tests.Additionally, there were correlations between the rock micro-damage and the statistical regularity of the AE dominant frequency: the AE dominant frequency in the highfrequency band at approximately 300 kHz was induced by tensile microcracks, whereas the low-frequency signal at approximately 125 kHz was induced by shear microcracks.
Declaration of Competing Interest
The authors wish to confirm that there are no known conflicts of interest associated with this publication, and there has been no significant financial support for this work that could have influenced its outcome.
Acknowledgments
The research was funded by the National Natural Science Foundation of China (Grant No. 51779021), Chongqing Natural Science Foundation (Grant No. cstc2019jcyj-msxm2176), and Scientific and Technological Research Program of Chongqing Municipal Education Commission (Grant No.KJQN201800745).
Appendix A. Supplementary data
Supplementary data to this article can be found online at https://doi.org/10.1016/j.jrmge.2019.12.012.
 Journal of Rock Mechanics and Geotechnical Engineering2020年3期
- Journal of Rock Mechanics and Geotechnical Engineering的其它文章
- An in situ monitoring campaign of a hard rock pillar at great depth within a Canadian mine
- Influence of location of large-scale asperity on shear strength of concrete-rock interface under eccentric load
- Controlling effects of differential swelling index on evolution of coal permeability
- Factor of safety of strain-softening slopes
- Modeling behaviors of a coal pillar rib using the progressive S-shaped yield criterion
- A method to model the effect of pre-existing cracks on P-wave velocity in rocks
