Quantitative analysis of saindha salt using laser induced breakdown spectroscopy and cross-validation with ICP-MS
M QASIM,M ANWAR-UL-HAQ,M SHER AFGAN,S U HAQ and M A BAIG
1 Department of Physics,University of Sargodha,Sargodha 40100,Pakistan
2 Department of Energy & Power Engineering,Tsinghua-BP Clean Energy Center,Tsinghua University,Beijing 100084,People’s Republic of China
3 National Institute of Lasers and Optronics (NILOP),Nilore,Islamabad 45650,Pakistan
4 National Center for Physics,Quaid-i-Azam University Campus,Islamabad 45320,Pakistan
Abstract
Keywords:elemental analysis,CF-LIBS,plasma parameters
1.Introduction
Laser induced breakdown spectroscopy (LIBS) is a sensitive and potentially growing optical diagnostic technique used for the qualitative and quantitative elemental analysis of materials in solid,liquid,or gas phase [1–4].In LIBS,a high-power laser pulse is focused on the sample surface,which ablates a minute amount of the sample forming a high-temperature transient plasma that comprises of excited species including atoms,ions,electrons and molecules [5].The optical emissions spectrum of the plasma is used to identify the sample constituents,whereas,the intensities of the spectral lines yield the relative concentrations of the emitting species of the target sample [4–6].The advantages of LIBS such as minimal sample pre-treatment,real-time multi-elemental analysis and several other advantages in terms of analytical time and cost,make it a popular analytical technique [7].As an elemental analysis technique,it has been applied to a wide variety of samples including pigments [8],archeology and cultural heritage [9,10],metallurgy [11,12],food and nutrition[13–15],rocks material [16,17],coal and minerals [18–20],plant materials [21],marbles and geological specimens[22,23],biological samples [24,25],environmental samples[26,27],steel industry [28]and soils [29,30].
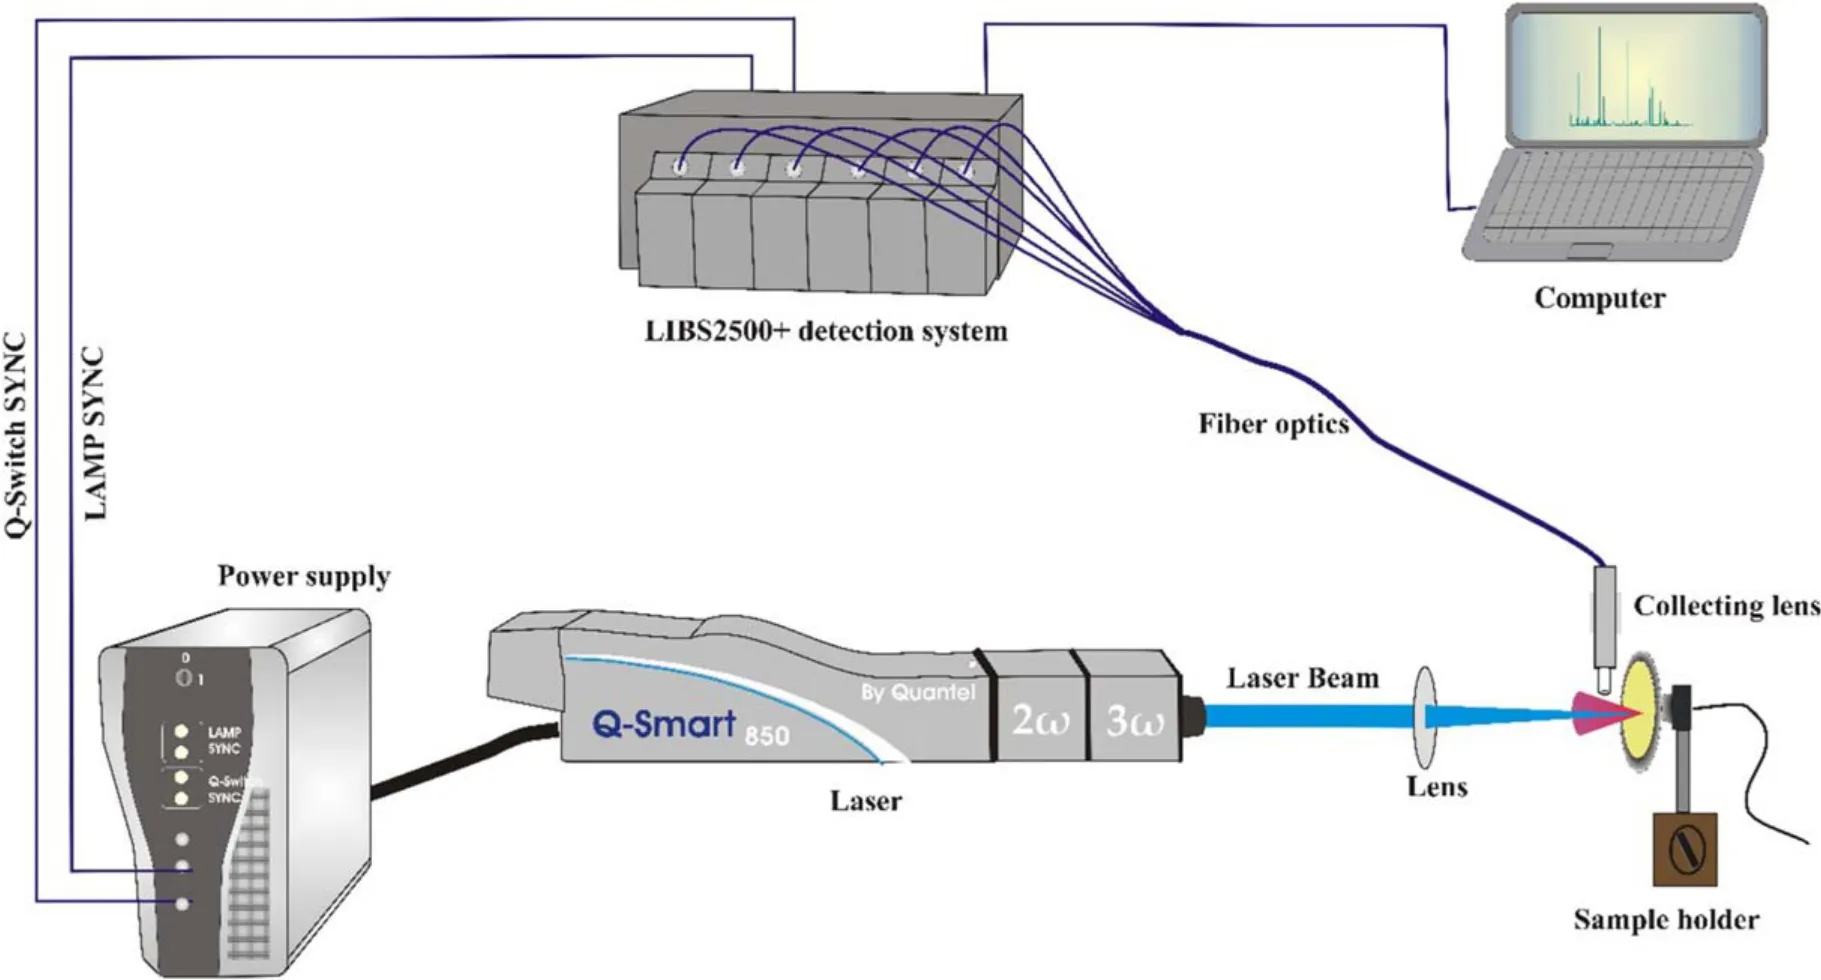
Figure 1.Schematic of the experimental setup used in the present work.
Conventionally in the LIBS based analysis,calibration curves are built from the reference samples to measure the elemental concentration,however,due to difficulty in the availability of matrix-matched reference samples,Ciucci in 1999 introduced an alternative approach,the calibration free-LIBS (CF-LIBS) technique [31].This approach utilizes the plasma parameters and emission line intensities to determine the quantitative information.CF-LIBS is based on the stoichiometric ablation of the sample as well as it fulfils the assumptions that the plasma is optically thin and follows the local thermodynamic equilibrium (LTE) condition,within the measurement time and spatial observation window.Since its inception during subsequent years,CF-LIBS has been developed and applied as a fast and accurate method by several research groups around the world for quantitative analysis of different materials [32–35].The results of CFLIBS are validated case by case with other well established techniques which substantiates that CF-LIBS may be considered as a reliable tool for the quantitative analysis [36].
The present study aims to exploit the LIBS technique to identify and quantify the elements present in the naturally occurring saindha salt available in the local market of Pakistan.The elemental analysis of salt is important in a sense that it is used in the daily human diet,and since it is extracted from the natural ores,therefore,hazardous species may be present in it.The spectroscopic analysis confirms the presence of Ca,Mg,Na,K,Fe,Sr,Si,Li and Al in various concentration in the saindha salt.The laser-produced plasma was characterized by calculating the electron temperature from the Boltzmann plots and the electron number density using the Stark line broadening method.The spatial behavior of the plasma parameters was also studied,which signifies the importance of further understanding the inter-relation between the spatial and temporal behavior of the laser produced plasma for further investigations.Besides,the effect of laser irradiance has also been investigated.The relative concentration of the elements present in the sample was determined by integrating the intensity of the strongest line of an element by using two different calibration free-LIBS techniques:self-calibration-LIBS and one-line calibration free-LIBS.To validate the LIBS results,these are compared with the analysis obtained by the inductively coupled plasma-mass spectroscopy (ICP-MS).A comparison of the quantitative results obtained by different LIBS techniques along with the standard ICP-MS technique reveals the importance of LIBS for precise quantitative analysis of materials and its precision can be further improved by the signal enhancement of the laser produced plasma emission.
2.Experimental details
The LIBS experimental setup is shown in figure 1.The ablation source was a Q-switched Nd:YAG laser (Quantel,Q-Smart 850),operating at 355 nm with 5 ns pulse duration and 10 Hz repetition rate,capable of delivering 230 mJ pulse energy.The laser pulse energy was varied by changing the flash lamp Q-switch delay time and was measured by a calibrated energy meter (Maestro-Gentec).A convex lens of 25 cm focal length was used to focus the laser beam which produced an area of 9.08×10⁻⁴cm2on the sample surface.The sample was mounted on a two-dimensional rotating stage to provide a fresh surface for each laser pulse.The distance between the lens and sample was kept less than the focal length of the lens to avoid air breakdown in front of the sample.The optical emission from plasma was collected through a collimating lens (0°–45° field of view),placed at a right angle to the direction of expansion of plasma plume.The emitted light was transferred via optical fiber and 10 μm entrance slit to the LIBS2500+ (Ocean Optics Inc.)spectrometer,consisting of a detection system (2048 element linear CCD array)and six high-resolution spectrometers.The overall spectral range is 230–805 nm with ~0.1 nm spectral resolution.The spectra were recorded at a delay time of 2.5 μs whereas the gate width was fixed at 2.1 ms which was the minimum value for the CCD detector.The emission signal was corrected by subtracting the dark signal of the detector using OOILIBSplus software.Each spectrometer installed in the LIBS2500+ detection system was calibrated using DH-2000-CAL standard light source.The output data acquired simultaneously by all spectrometers was stored in a computer through OOILIBSplus application software for subsequent analysis.

Figure 2.Piece of natural saindha salt.
A small piece of saindha salt as shown in figure 2,was crushed into a fine powder and pressed to form a pellet using a hydraulic press.The pellets of 4 mm thickness and 12 mm diameter were used for LIBS analysis.For the analysis of saindha salt using ICP-MS technique,100 mg saindha salt was mixed with 5 ml aqua regia and 2 ml H2O2in a 50 ml beaker.The solution was heated at 180°C on an electric heating plate until the sample was completely dissolved.The 100 ml solution was prepared by adding ultra-purified water to the prepared digestion solution.Ten percent of this solution was further diluted 100 times with 2% HNO3to prepare a 1 litre solution for analysis using ICP-MS (iCAP Q,ThermoFisher,Waltham,USA).
3.Results and discussion
3.1.Spectral analysis
The salt pellet was irradiated with a 25 mJ laser pulse energy,which produced plasma on its surface,and the associated plasma light was collected and analyzed.The analysis was performed using the Matlab code and NIST database [37].The analysis was further confirmed by comparing the spectral lines in the spectra of saindha salt with the independently recorded LIBS spectra of pure elements; Ca,Mg,Na,K,Fe,Sr,Si,Li and Al.Figures 3(a)–(d) show the analyzed emission spectra,covering the spectral range from 240 to 780 nm.The emission spectra consist of neutral and singly ionized emission lines of Ca,Mg,Na,K,Fe,Sr,Si,Li and Al.The identified elements and their wavelengths along with the ionic states are shown in table 1.
Figure 3(a)shows a portion of the spectra between 240 nm and 340 nm,showing multiplet structures of Si (I),originating from the 3p4s3P0,1,2upper levels to the 3p23P0,1,2lower levels.Another strong emission line of Si(I)is identified at 288.16 nm.In this region,a closely spaced multiple structures of Mg (II),identified as doublets due to the 3p2P1/2,3/2→ 3s2S1/2and 3d2D3/2,5/2→ 3p2P1/2,3/2transitions.Figure 3(b) covers the spectral region from 375 nm to 465 nm,mostly containing calcium lines,but some strong lines of other elements are also present in this region.For example,Ca (I) 4s4p1P1→ 4s21S0at 422.67 nm,Al(I)4s2S1/2→ 3p2P3/2at 396.15 nm,Fe(I)3d74p5G5→ 3d74s3F4at 438.35 nm and Sr(I)5s5p1P1→ 5s21S0at 460.73 nm.Figure 3(c)covers the spectral region from 490 nm to 580 nm,that is dominated by Ca and Na lines besides the triplet structure of Mg (I):3s4s3S1→ 3s3p3P0,1,2at 516.73 nm,517.27 nm and a dominant line at 518.36 nm.Figure 3(d)covers the spectral region from 570 nm to 780 nm,having well-known sodium doublet corresponding to the 3p2P1/2,3/2→ 3s2S1/2transitions at 588.99 nm and 589.59 nm.This portion of the spectra also contains the emission lines of Li (I) at 610.35 nm,670.79 nm and K (I) doublet at 766.49 nm,769.90 nm.
3.2.Determination of plasma parameters
The laser-produced plasma was characterized by measuring the electron temperature and electron number density.These parameters are of great importance and required in many LIBS applications.The electron temperature has been estimated by the integrated intensities of the emitted spectral lines by using the Boltzmann plot method [38]under the assumption that the plasma is in local thermodynamic equilibrium.The following relation is used to determine electron temperature:

where T is the electron temperature,I represents the integrated intensity,λkiandAkiare the line wavelength and transition probability of the emission line,respectively.Z(T) is the partition function,Ekis the energy of the upper level,kBis the Boltzmann constant,aCis the concentration of emitting species and F is the experimental parameter that accounts the optical efficiency of the collection system [39].The plot of left-hand side versus upper state energy (Ek) of the selected emission lines of the same ionization stage,yields a slope from the linear fitting and hence the electron temperature of the plasma.In this work,we extracted the electron temperature from the Boltzmann plot using well-resolved spectral lines of neutral Ca at 422.67 nm,445.48 nm,527.03 nm,612.22 nm,643.91 nm,646.26 nm and 649.38 nm present in saindha salt.The spectroscopic data of these lines are listed in table 2.For an accurate estimation of electron temperature,the integrated intensities of the spectral lines have been used instead of peak intensities [40].As an example,the electron temperature at a laser irradiance of 3.0×10¹⁰W cm-2is extracted as (19 450 ± 500) K.The uncertainty in the extracted electron temperature is ~10%,due to the uncertainties associated with the measurement of the integrated line intensity and transition probability.

Figure 3.Optical emission spectrum of saindha salt covering the spectral region from (a) 240–340 nm,(b) 375–465 nm,(c) 490–580 nm,(d)570–780 nm recorded in air at atmospheric pressure using 355 nm laser pulses of a Nd:YAG laser.The identified spectral lines are also labelled on the spectrum.

Table 1.Identified elements in saindha salt along with charge states and transition wavelengths.
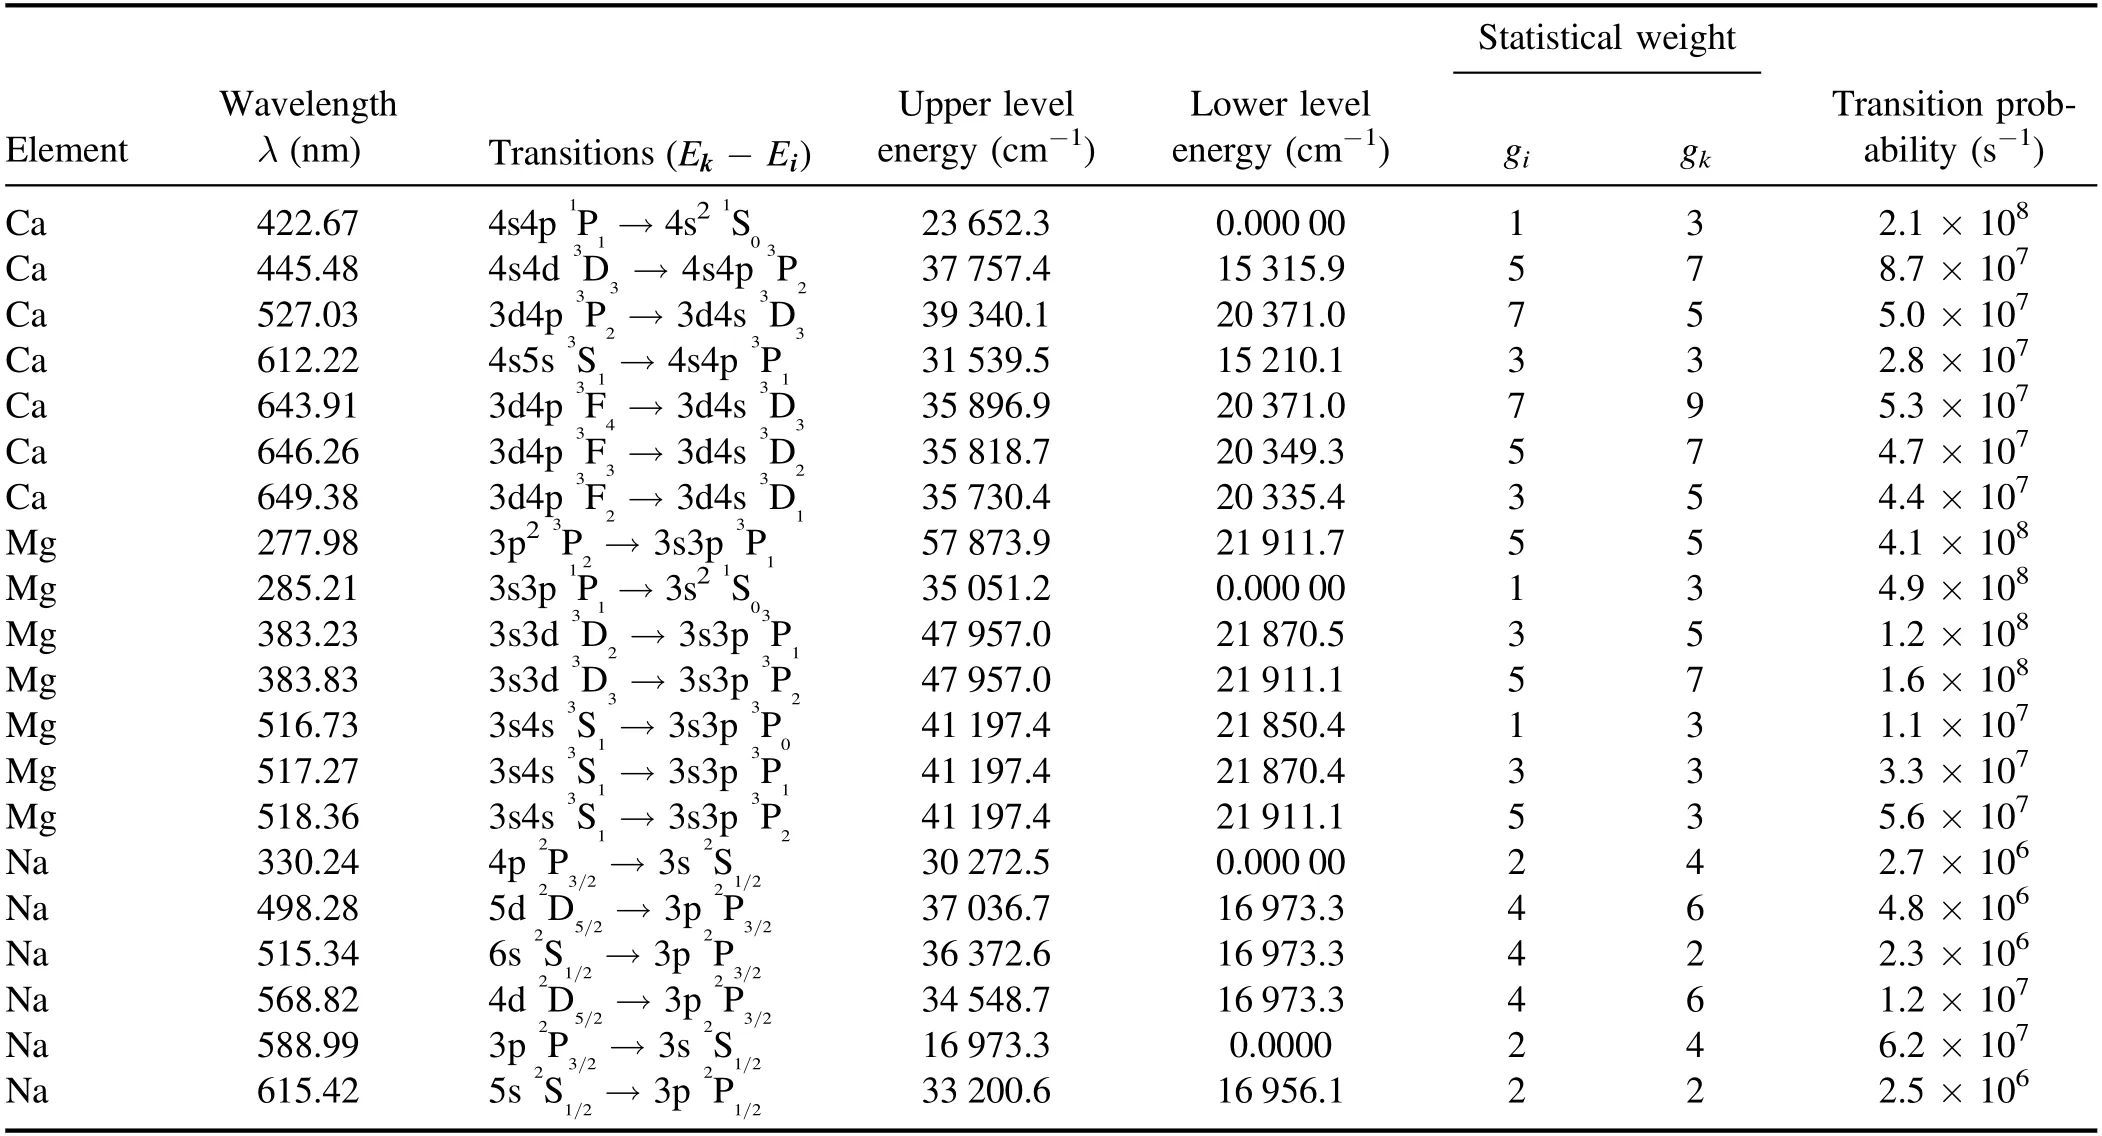
Table 2.Spectroscopic parameters of the observed neutral Ca,Mg and Na lines used in Boltzmann plots.
The electron number density can be determined from the Stark broadened line profile due to the collision of charged species inside the plasma,using full width at half maximum(Δλ1/2) of the line by the following equation:

where ω is the electron impact parameter,its value at the corresponding temperature is taken from Griem tables [41].The neutral Ca line at 422.67 nm was selected for the determination of electron number density.Several studies report the electron number density,extracted using this emission line of calcium [42–45].The self-absorption effect can influence the accuracy of results.The self-absorption was evaluated using the internal reference method [46].The value of the self-absorption coefficient measured for the selected line was close to 1,which shows negligible self-absorption in the line profile.The Lorentzian fitting to the experimentally observed line profile was used to estimate the Δλ1/2of the neutral Ca line at 422.67 nm.Furthermore,the instrumental broadening was subtracted from the line profile to determine the electron number density from the Stark broadened line profile using equation (2).The electron number density at laser irradiance of 3.0×10¹⁰W cm-2is estimated as 1.16×10¹⁸-
cm .3 The uncertainty in these results is about 10%,which mainly comes from the fitting over line profile and in the values of electron impact parameter.
Having determined the electron temperature and electron number density,we used these parameters to check the plasma LTE condition.For this,the McWhirter criteria is used as a necessary condition for the validity of LTE:

whereneis the electron number density,T is the electron temperature,and ΔE is the energy difference between the highest energy level to the ground level.The minimum electron number density required to satisfy the LTE is ~1015cm-3,whereas our measured values are about two orders higher,which satisfy the criteria for the existence of LTE.
The plasma parameters have been studied as a function of distance from the target surface along the line of propagation of plasma plume.The emission spectra were recorded at a fixed laser irradiance of 3.0×10¹⁰W cm-2and up to 4.5 mm,with a step of 0.5 mm.At each step,the electron temperature and electron number density were extracted and plotted in figure 4.The temperature close to the target surface was 19 450 K,which decreases exponentially to 9500 K up to 4.5 mm from the sample surface.Similarly,the electron number density close to the target was 1.21×10¹⁸-
cm 3 which decreased to 9.80×1017cm-3at 4.5 mm,following exponential decay with distance.This decrease can be attributed to the plasma expansion and plasma-ambient interaction resulted in recombination,which accounts for the decrease in electron temperature and electron number density away from the sample surface.

Figure 4.Spatial behavior of electron number density and electron temperature at a fixed laser irradiance of 3.01×10¹⁰ W cm-2.

Figure 5.Variation of electron temperature and electron number density as a function of the laser irradiance.
Furthermore,the plasma parameters were investigated as a function of laser irradiance from 3.7×10⁹W cm-2to 3.0×10¹⁰W cm-2.As shown in figure 5,with increasing irradiance,the electron temperature increased exponentially from 13 600 K to 19 300 K and the electron number density increased from 9.80×1017cm-3to 1.16×1018cm-3.With the increase in the laser irradiance,the ablated mass is increased and the plasma heating is more rigorous resulting in higher plasma temperature and number density [47].
3.3.Quantitative analysis
For the quantitative analysis of the saindha salt,we compared three LIBS based techniques,the integrated intensity of the strongest line of an element,self-calibration-LIBS(SC-LIBS)and one-line calibration free-LIBS (OLCF-LIBS).In the first method,the strongest emission line of each element was used to measure its relative concentration as the use of the integrated intensity of the strongest line to measure its concentration in a sample is reported in the literature [48–50].The following emission lines of each element were selected:calcium 4s4p1P1→ 4s21S0at 422.67 nm,magnesium 3s4s3S1→ 3s3p3P2at 518.36 nm,sodium 3p2P1/2→ 3s2S1/2at 589.59 nm,potassium 4p2P3/2→ 4s2S1/2at 766.49 nm,iron 3d74p5G5→ 3d74s3F4at 438.35 nm,strontium 5s5p1P1→ 5s21S0at 460.73 nm,silicon 3p4s1P1→ 3p21D2at 288.16 nm,lithium 3d2D3/2→ 2p2P1/2at 610.35 nm and aluminum 4s2S1/2→ 3p2P3/2at 396.15.Based on the aboveselected emission lines,sodium has the highest relative concentration of 91.4%,whereas,the relative concentration of other elements has been determined as; Ca (3.8%),Mg(2.7%),K (0.63%),Fe (0.12%),Sr (0.16%),Al (0.32%),Li(0.61%) and Si (0.11%).
The SC-LIBS approach is based on the assumptions of optically thin plasma and in local thermodynamic equilibrium[31].In this method,the Boltzmann plots for each element were separately drawn to determine the intercepts,and an average value of the temperature has been used to calculate the relative concentration.Re-arranging equation (1),gives the intercept asmoreover,the equation becomes;

where Z(T) is the partition function,defined as:

The experimental factor F is determined by normalizing the sum of the concentrations of all the species to unity as:

Knowing all these parameters,equation (4) is used to deduce the concentration of each species.Since the laser induced plasmas undergo a fast temporal decay,most of the species present in the plasma are neutral but singly ionized emission lines also appear in the spectra.Hence,the total concentration of an element can be approximated by summing the concentration of neutral and ionic species of that element[31,51]:

where the subscript ‘I’ stands for the neutral and ‘II’ for the singly ionic species.
The Boltzmann plots for Ca,Mg and Na lines are shown in figure 6.The linear fitting,as illustrated by a solid line,yields nearly the same slopes and hence the same temperature of all the species.The values of the intercepts for each species account for the concentration of the corresponding species in the plasma.Using the plasma temperature and intercepts in the above equations,the relative concentration of different elements in the saindha salt has been determined as; Na(67.3%),Ca (11.1%),Mg (5.2%),K (8.4%),Fe (4.5%),Sr(1.7%),Al (1.1%),Li (0.34%) and Si (0.26%).
In order to compare the results,we have also used the one-line calibration free-LIBS (OLCF-LIBS) technique to measure the relative concentration of the elemental species.In this technique,instead of taking the multiple lines,a single optically thin line is used to measure the concentration of an element.The intensity of an emission line is related to its concentration through the Boltzmann equation [52]:
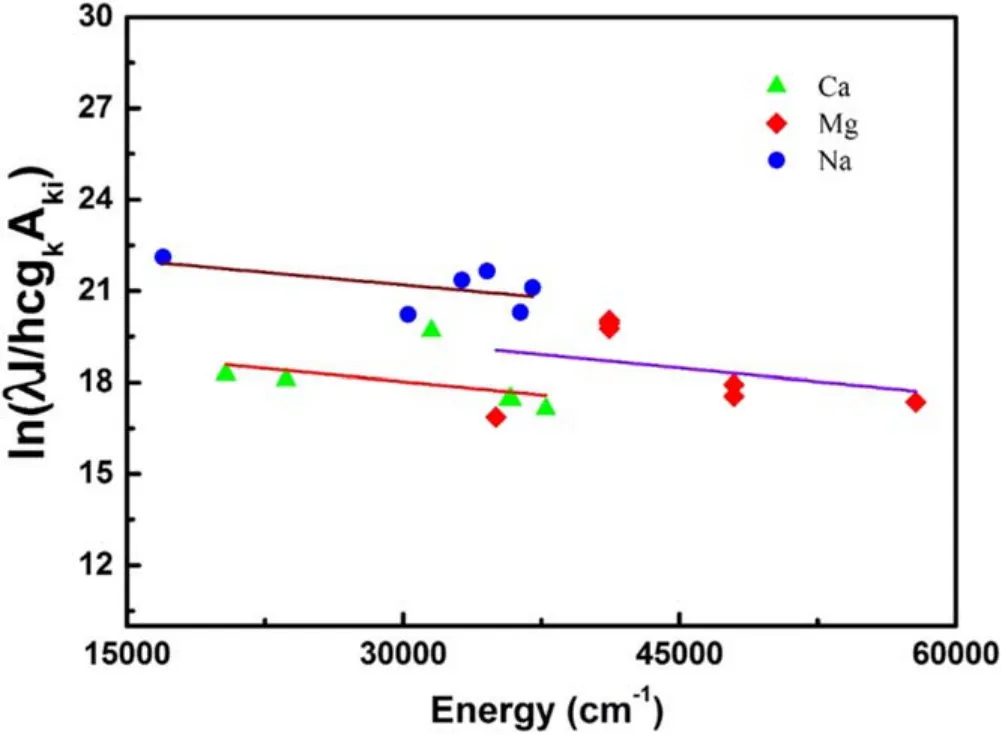
Figure 6.Boltzmann plots for Ca,Mg and Na.The solid lines in the Boltzmann plots represent the linear fitting over the experimental data points,which yield nearly the same slope but different intercept for each species.
The concentration of the neutral species was determined using plasma temperature of 17 600 K,whereas,the concentration of the ionized species is determined using the Saha–Boltzmann equation.The concentration of the two consecutive charged states x and x + 1 can be determined using the following relation:

whereEion(e V) is the ionization energy of an element in the charge state x,a+Zx1andaZxare the partition functions of the upper charge state x + 1 and lower charge state x respectively and all other terms are already defined.We take x and x + 1 as neutral and singly ionized species.The average electron number density was 1.16×1018cm-3.After determining the ionized species concentration,the total concentration of an elementcan be determined.The relative concentration of an element ‘α’ was determined using the following relation:

Using OLCF-LIBS,the relative concentration of elements in the saindha salt has been determined as;Na(93.2%),Ca(1.3%),Mg(2.9%),K(0.09%),Fe(2.1%),Sr(0.03%),Al(0.06%),Li (0.02%) and Si (0.09%).
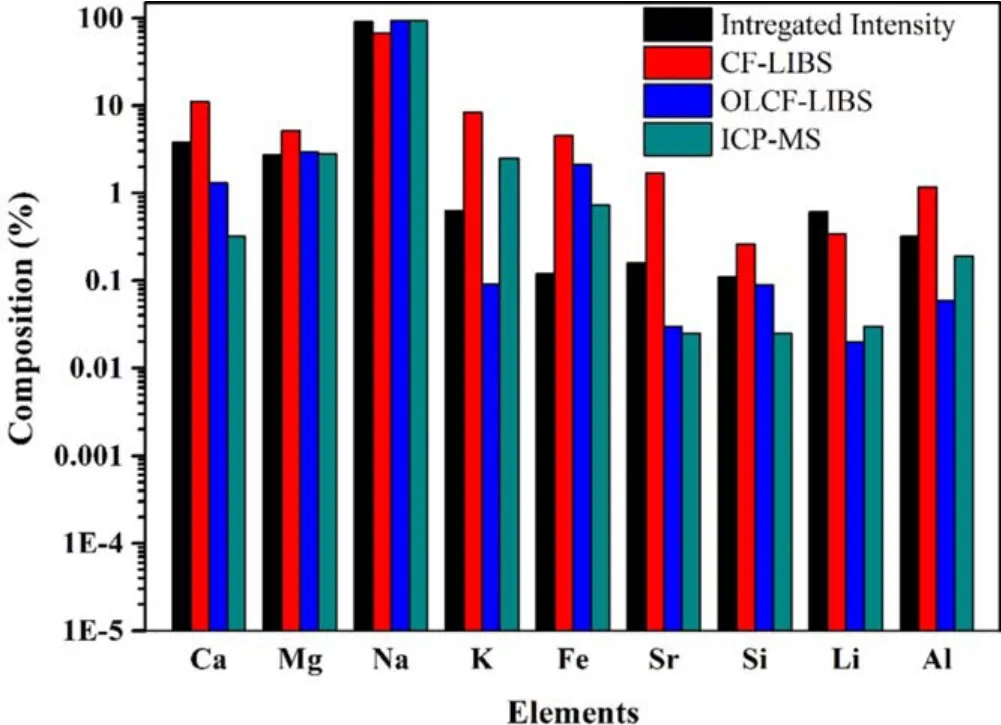
Figure 7.Comparison of the relative concentrations of the elements in the saindha salt using LIBS-based methods and ICP-MS.

For the quantitative analysis,the ICP-MS is used as a standard technique,therefore,saindha salt was also analyzed through this technique to compare the results of LIBS- based techniques.The results obtained with this technique and other LIBS based methods are summarized in figure 7.The comparison shows that the results obtained from the integrated line intensity of the strongest spectral line approach and OLCF-LIBS agree well with the ICP-MS results.The SC-LIBS results were found to be less accurate when compared with the other techniques.This may be due to the errors in the experimental parameters and biasing factors such as fluctuations in the measured line intensity and spectral efficiency of the detector.The integrated intensity of the strongest line is a better choice since other sources of uncertainty are not used,however mere intensity is also influenced by the plasma opacity,detector efficiency,and self-absorption.In OLCF-LIBS,the intensity of a carefully selected line is used along with other statistical factors instead of the Boltzmann plot intercept which gives a better quantitative performance compared to the other two techniques.However,the partition functions for all elements are not available in NIST database [37]; therefore,un-availability of partition functions may directly affect the quantitative results.Using more accurate theoretical parameters,including the partition function [53]and experimental conditions,the OLCF-LIBS performance for calibration free applications of LIBS can be further improved.
4.Conclusions
This work demonstrated the feasibility of laser induced breakdown spectroscopy to determine the relative concentration of elements present in the sample.The spectroscopic analysis reveals the presence of Ca,Mg,Na,K,Fe,Sr,Si,Li and Al in the saindha salt.The electron temperature was determined by the Boltzmann plot method,while the electron number density was estimated from the Stark broadened line profile.Both the parameters were also studied as a function of laser irradiance and distance from the target sample.Both the plasma parameters increase with the increase in the laser irradiance and decrease with an increase in the distance from the target.Among the three methods used,the quantitative performance of OLCF-LIBS was found to be better than the line intensity method and much better than SC-LIBS for the relative concentration measurement of saindha salt.The concentrations of Ca,Mg and Na by OLCF-LIBS were 1.3%,2.9%and 93.2%respectively,which were reasonably close to 0.32%,2.75% and 90.97% concentrations of the same elements determined by ICP-MS.The OLCF-LIBS technique can be further improved for a better quantitative analysis,especially for the elements with a concentration of less than 3%.
Acknowledgments
This work is supported by the Higher Education Commission(HEC) of Pakistan under the HEC project No.20-1868/R&D/10/5754.
ORCID iDs
 Plasma Science and Technology2020年7期
- Plasma Science and Technology的其它文章
- Influence of target temperature on femtosecond laser-ablated brass plasma spectroscopy
- Spectral characteristics of underwater laserinduced breakdown spectroscopy under high-pressure conditions
- A novel strategy for quantitative analysis of soil pH via laser-induced breakdown spectroscopy coupled with random forest
- Quantitative analysis of the content of nitrogen and sulfur in coal based on laserinduced breakdown spectroscopy:effects of variable selection
- Geographical authenticity evaluation of Mentha haplocalyx by LIBS coupled with multivariate analyzes
- Temporal and spatial evolution measurement of laser-induced breakdown spectroscopy on hydrogen retention in tantalum
