Trace elemental signatures and mineral chemistry of clays associated with the alteration halos of the Paleoproterozoic U mineralization in Bijawars of the Sonrai Basin,Central India
Surendra Kumar Jha·Rashmi Sharma·Jaya Prakash Shrivastava
Abstract Paleoproterozoic Bijawars of the Sonrai basin consists of(a)Sonrai(mostly carbonate carbonaceous shale and phosphatic breccia) and (b) Solda Formations (commonly chloritic and ferruginous shale)with well-developed clay-organo-rich facies,often marked with hydrothermal activities.Previous studies revealed abundance order of kaolinite >chlorite >illite >smectite;and kaolinite >illite >chlorite in clay (0.2–2.0 μm) fractions separated from the Sonrai and Solda Formations,respectively.To understand atomic substitutions and trace elemental concentrations,clay minerals were analyzed by fusion ICPMS and SEM–EDS.PAAS normalized data plots show U,Th,Rb,Ba,Pb Sr,and large-ion lithophiles enrichment,whereas,Bandai sandstone and Rohini carbonate clays show HREE enrichment with asymmetrical patterns,similar to those reported from the well-established McArthur River,Cigar Lake,and Sue UTUD of Canada.For Rohni carbonate,chondrite-normalized REE data plots revealed M shape REE patterns,ascribed to Gd–Tb–Dy–Ho tetrad effect and anomalous Y,Zr,and Hf concentrations.Owing to HREE incorporation in the clay inter-layers,linear and flattened REE trends were noticed.Flat REE patterns associated with the highly altered chlorite and illite represent negative Eu anomaly related to the dilational nature of the uraninite structure and is suggestive of anoxic conditions.
Keywords Bijawars·Sonrai basin·Clays·REE patterns·Uranium mineralization
1 Introduction
The Paleoproterozoic,intra-cratonic,and siliciclastic Bijawar Group (2–1.4 Ga) of rocks in the marginal Sonrai basin(Fig.1)overlies the Archean Bundelkhand Basement Complex (3.3–2.5 Ga) and lies below theVindhyan Supergroup (1.4–0.5 Ga) with unconformable contacts(cited Table 1:Jha et al.2012).The Sonrai basin is rectilinear in shape,trending in the E–W directions and dipping gently in southern direction,covers an area of 28 km in length and 5–7 km in width.In the Sonrai basin,the Bijawar sequence rests unconformably over the pre-existing Berwar Formation (Sharma and Rahman 2000),where mafic-ultramafics of the Madaura Formation cut across the Berwar Formation and Basement Gneissic Complex (Prakash et al.1975).In this area,E–W faults represent reactivation of rift-related earlier faults in the granitic basement(Prakash et al.1975; Srivastava 1989).The stratigraphy of the area (cited Table 1:Jha et al.2012) proposed by Prakash et al.(1975)sub-divided Bijawar rocks into(a)Sonrai and (b) Solda Formations.The former is further sub-divided into Jamuni carbonate,Gorakalan shale,Rohini quartzite,Rohini carbonate,and Bandai sandstone (including Kurrat volcanic),whereas,the latter is sub-divided into Chloritic shale,Dhorisagar,and Solda quartzite as members (Fig.1).The Sonrai Formation unconformably overlies the Mehroni Group and is marked by a basal conglomerate.U mineralization occurs at or near the unconformable contacts between regionally metamorphosed Archaean to Lower Proterozoic basement and Lower to Middle Proterozoic (1900–1200 Ma) continental clastic sediments.Moreover,Roy et al.(2004)reported the dominance of pitchblende with a minor amount of U silicate in this area.Recently,Rawat et al.(2018) reported uranium-bitumen association within the fractures of the Gorakalan shale,Rohini carbonate,and Bandai sandstone of the Sonrai as well as lower chloritic shale of the Solda Formation.In Paleoproterozoics of the Sonrai basin,mineralization occurs at two different stratigraphic levels in dolomite and pelite-arenite horizons of the Rohini carbonate and Chloritic shale,respectively.
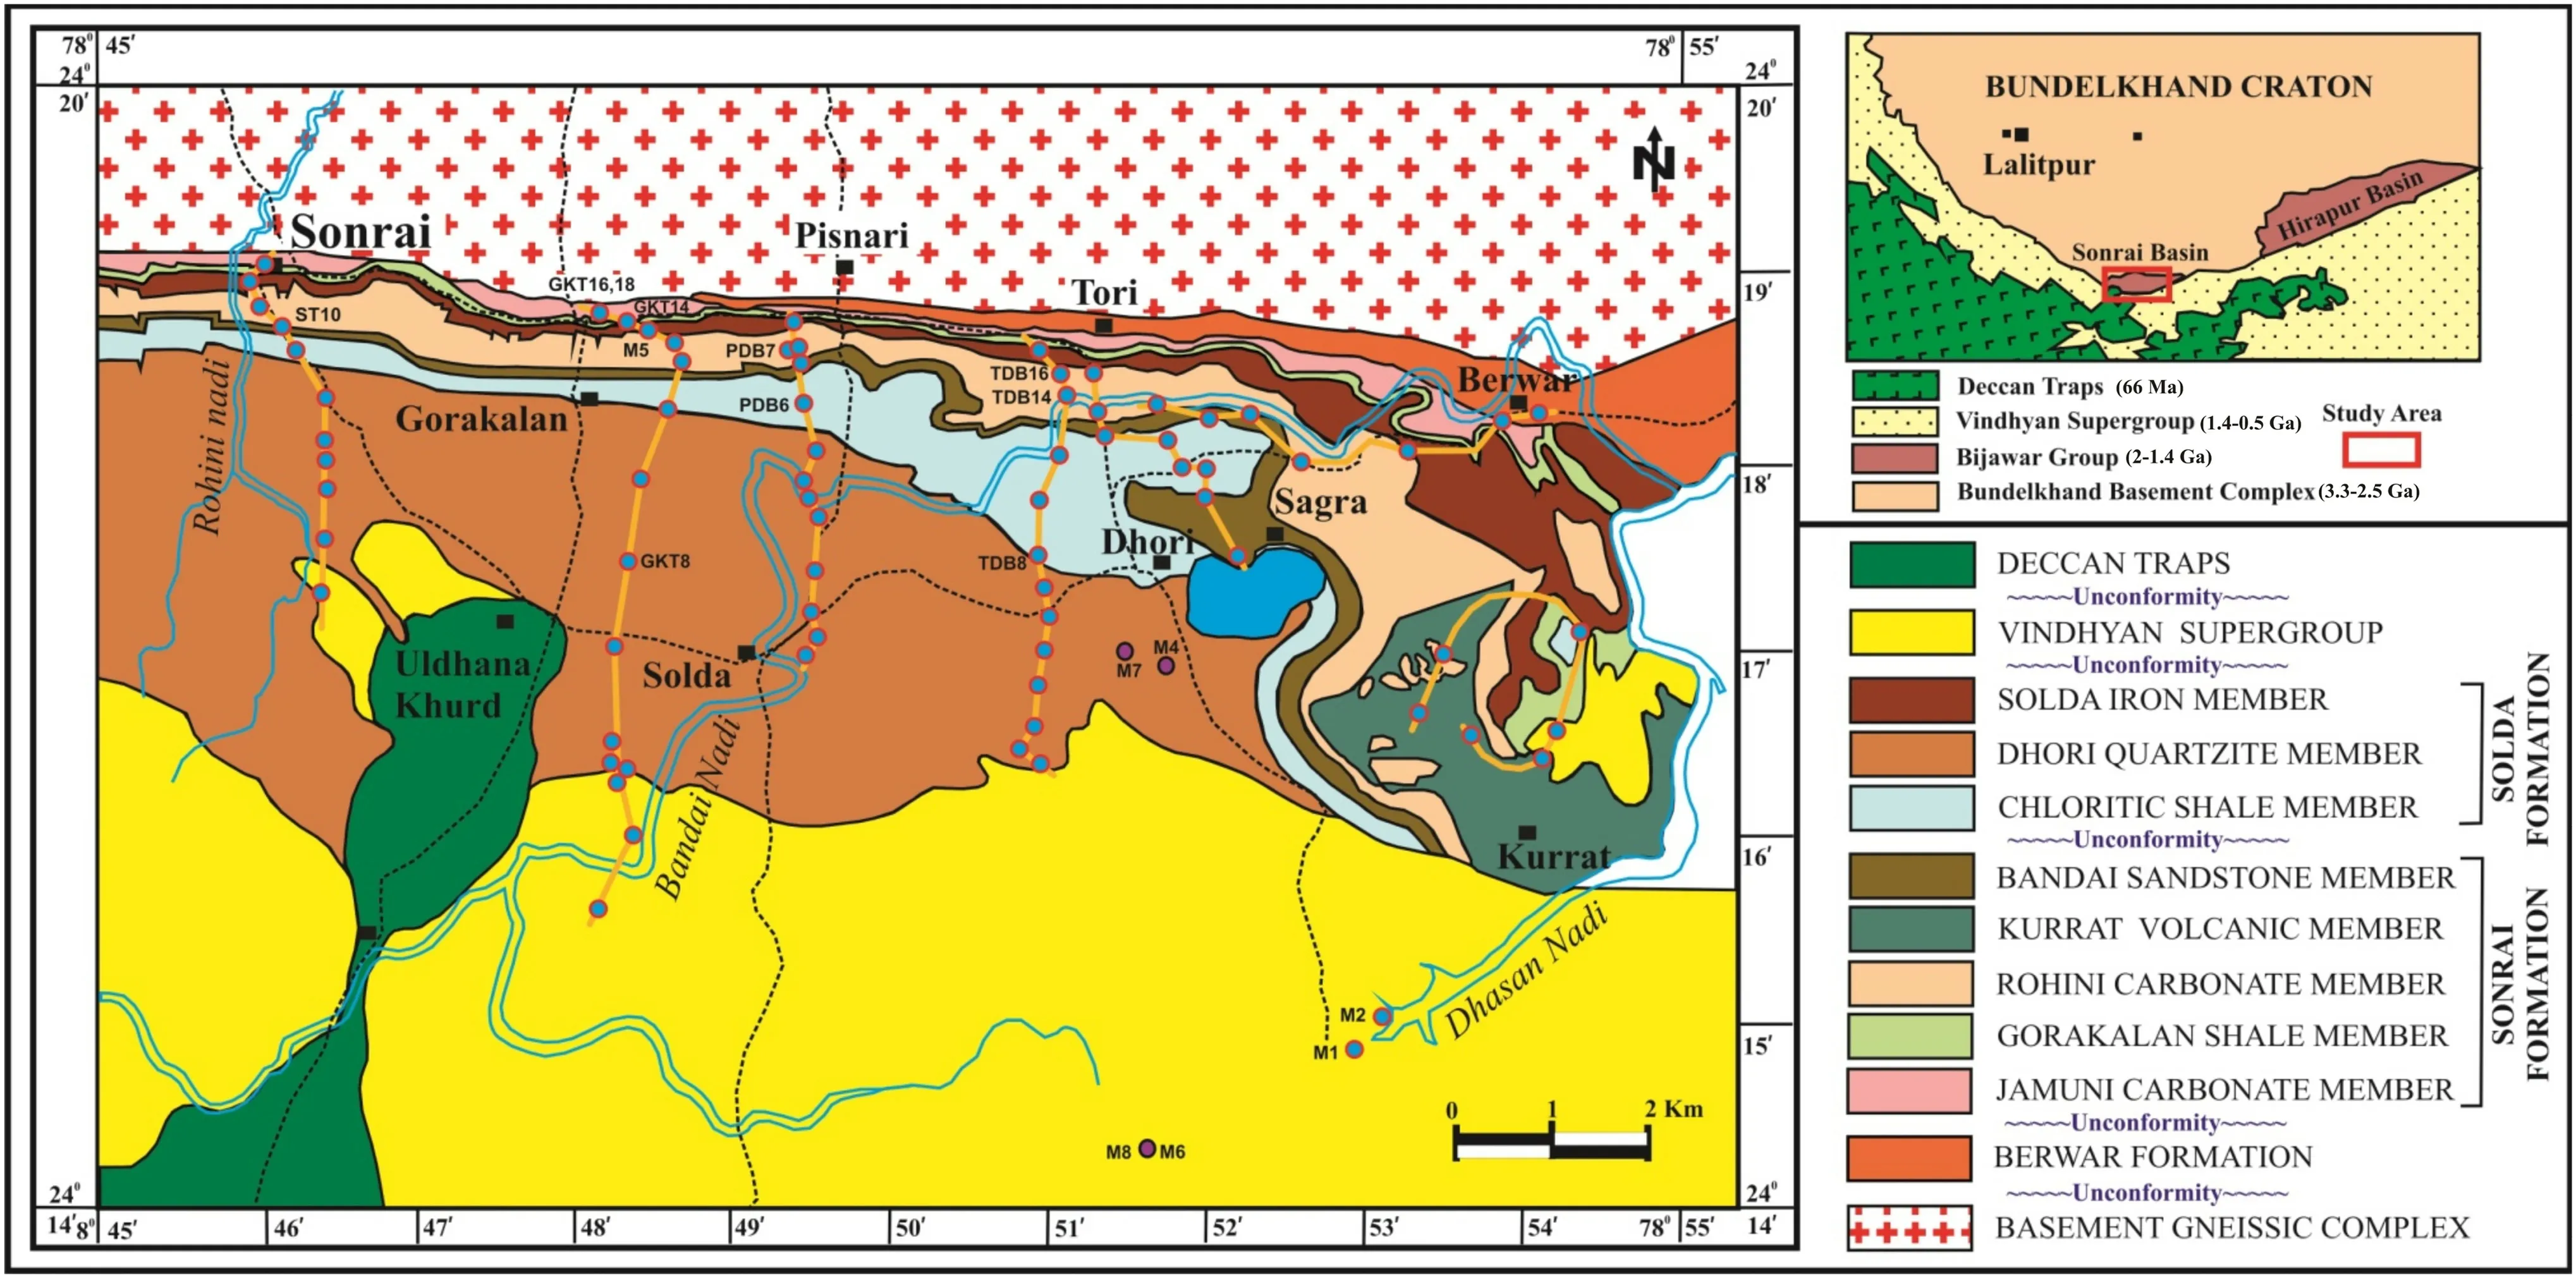
Fig.1 Geological map (modified after,Prakash et al.1975) of the Palaeoproterozoic Sonrai basin,Central India
Illite and chlorite are commonly associated with the sedimentary rocks (Daniels and Altaner 1990) and hydrothermal alteration halos.Morichon et al.(2010) discussed that clay minerals occur in the unconformity-type uranium mineralization (UTUM).Clay mineral assemblages form major constituents of an alteration halo around Proterozoic UTUM (Hoeve and Quirt 1987; Percival and Kodama 1989; Iida 1993; Pacquet and Weber 1993).Beaufort et al.(2005) reported a variety of clay mineral assemblages in the Proterozoic UTUM.Thus,chlorite and illite have been used to comprehend the nature,origin,and timing of the fluids that altered Precambrian granites as well as overlying rock in the Sonrai basin.Jha et al.(2012)on the basis of needle shape (trans-vacant) tv-1M polytype,illite and inter-stratified mixed smectite (Sm)/illite(Ill) or Sm/chlorite (Chl) in the Jamuni and Rohini carbonate and Bandai sandstone,suggested high fluid/rock interaction under hydrothermal conditions.
Sorption and adsorption of the uranyl ions onto clay structures are causative for the removal of U ions from the solution (Borovec 1981).Organic substances interact with the uranyl ions and form soluble complexes which are responsible for ionic precipitation via reduction,adsorption,ion exchange or other sorption processes and modify entrapment in clay structure,thus,affecting depositional mechanism,diagenesis,and hydrothermal processes(Wood 1996).Kister et al.(2006) proposed several chemical and geological conditions conducive to the formation of U deposits.In this area,Prakash et al.(1975)reported uranium-bitumen and Cu–Pb–Zn veins occupying fractures of Bandai and Gorakalan shale,but,Mahadevan(1986)discussed that the U mineralization is hosted within the sandstone inter-bedded with the carbonate rocks.Additionally,Mishra (1996) reported U mineralization in the bituminous shale of the Rohini carbonate.Roy et al.(2014) discussed that the U occurrences are closely associated with the unconformity,separating Sonrai metasediments and the Archean-Paleoproterozoic crystalline basement.Jha et al.(2012) discussed clay-organo-rich facies,structural discontinuities,and frequent hydrothermal alterations together with the fault-bounded nature of the basement as favorable sites for U mineralization in the Sonrai basin.Clay minerals control trace (especially rare earth elements) elemental abundance as they are immobile and adsorbed by the phyllosilicates at the time of weathering (Cullers et al.1987).Immobile elements undergo dilution during rock alteration,but extraction causes increase in the trace elemental concentration (Bao et al.2004).REE content and rocks within the basin have been used to determine paleoenvironmental conditions associated with U deposition(Fayek and Kyser 1997).Moreover,the REE pattern is the most efficient tool for constraining geological models for U deposits (Mercadier et al.2011).In this area,clay minerals are abundantly present in almost all the major rock types.The clay mineral chemistry is significant in this context.However,clay phyllosilicates and their bearing on uranyl and other associated trace elemental ionic enrichment are yet to be ascertained.Thus,clay structures and associated trace elemental concentrations help to comprehend paleoenvironmental reasons necessary for preferential U enrichment; therefore,present clay compositional studies were carried out with the primary objective to understand clay skeletal structures and possible U in this area.
2 Geological considerations
Generally,UTUM occurs in ancient craton,close to the unconformity between Archaeans and Paleoproterozoic igneous and metamorphic basement with a cover of younger clastic sediments (Pohl 2011).The fertile K-feldspar rich granitic basement bearing a large number of fractures and a high degree of illitization in the Sonrai basin provided an ideal set-up for hosting U mineralization.Similar to other well-established U deposits,Bijawar basin represents a close relationship with the tectonized granitoid basement (with faults and fractures,reactivated fractures)and post-Bijawar faults (Rawat et al.2010).Moreover,chloritization together with the illitization and kaolinization is also recognized in this area.Thus,present U mineralization complies with these parameters in the Bundelkhand craton and lies close to the unconformity between Archaean and Paleoproterozoic rocks of 3.7–2.24 Ga ages.
3 Materials and methods
For this purpose,75 fresh samples (each~2 kg.) were collected along 7 traverses,laid down across the E–W trending Sonari basin,covering the Sonrai,Solda,Madaura,and Berwar Formations and spread over the Toposheet No.54 L/15,(scale of 1:50,000) of the Survey of India (1976) and also over the geological map of the Sonrai basin (Fig.1).Based on the megascopic characters(Table 1),19 samples were selected for the analyses.
Prior to trace elemental analysis,0.2–2.0 μm fraction was separated out from each of the bulk specimens and subjected to washing by disaggregating in distilled water.It was followed by crushing and grinding.Each powdered sample was treated with H2O2,CH3COOH,NaOH (to remove organic matter,carbonates and allophone/silicates,respectively) using a combination of the procedures(Jackson 1969; Wilson 1987; Keil et al.1994; Yang and Aplin 1997; Tan 2005).The concentration of acid in the residual water was removed by centrifugation.Subsequent to the removal of the suspension,clay fractions were separated out after a specified time interval (based on the settling velocity of the particles),following the dispersion–centrifugation-decantation procedure (Jakson 1985).Samples were finally air dried at 60 °C.For clay mineral identification,oriented mounts prepared by filtering the clay suspension onto a membrane filter and then transferring it onto a glass slide to obtain a uniform diffraction mount and to avoid differential settling of clay particles(Drever 1973).Obtained smears were scanned by an X-ray diffractometer (PANalytical make; X’Pert3model) with Cu-Kα radiation at an adopted scanning speed of 1°/min.The internal standard method (Srodon et al.2001),where,quartz was used as an internal standard,was followed to obtain quantitative results (within an error of <5 wt%).
Prior to a scanning electron microscopic (SEM) study,clay specimens were transferred onto an adhesive carbon film and characterized by a Carl-Zeiss make; an EVOMA10 model field emission gun scanning electron microscope (SEM) equipped with an Oxford make (Inca X-Act model)EDXS system at 20 kV voltage and 8 mm working distance after being coated with gold for electrical conductivity.Clay minerals were examined over a range of magnifications as high as 20,000×,but most of the textures were best seen in the range 1000 to 50,000×.To determine major oxides,clay minerals in a window mode,precision better than 1% was maintained throughout EDS analyses and obtained values are presented in Table 1S.To understand chemical composition of clay minerals in terms of atomic ratios in the octahedral,tetrahedral,and interlayers,structural formulae were calculated based on the number of oxygen atoms in the half cell unit and atomic concentration was given on the basis of atom per formula unit (apfu)following the method discussed by Ross and Hendricks(1945)and Weaver (1989).Structural formula calculations imply two basic assumptions (1) anion and cation charges must be equal;the anion charge of half unit cell O10[OH]2of 2:l illite and smectite is equal to 22 and for 2:1:l chlorite O2[OH]8it is equal to 28 and (2) the number of tetrahedral cations must be 4.0.Oxide values (in wt%)were converted into atomic proportions.Single cation[SiO2,MgO,FeO,and CaO(in wt%)]values were divided by their molecular weights,whereas,double cation[A12O3Fe2O3,K2O,and Na2O] values by the half of their molecular weights.To derive the structural formula,atomicproportions multiplied by the K factor obtained by multiplying the atomic proportion of each cation to its valency.Total of these values divided by 22 for 2:l phyllosilicates and by 28 for 1:1 phyllosilicates.
Major (Table 2) and trace (Table 3) elements were determined by fusion ICP-AES (Inductively Coupled Plasma—Atomic Emission Spectrometry,Model-Thermo Jarrell Ash ENVIRO II)and ICP-MS(Inductively Coupled Plasma Mass Spectrometry,Model:Perkin Elmer Sciex Elan 6000) methods in the Activation Laboratories,Ontario,Canada.For analytical quality control of major and trace elemental data,20 Geostandards were analyzed intermittently and calculated standard deviation (1σ) values (as detailed in the Electronic Supplement:Tables 2Sand 3S).Each 0.25 grams of the samples were placed into Teflon beakers and digested with few drops of deionized water and concentrated acids,beginning with 7 ml of concentrated HF (23 M),followed by 3 mL of HNO3(15.5 M)and 1 mL of HClO4(11.57 M).Each sample was finally dissolved in the 10 mL of 1:1 volume of HNO3and water and beakers heated over the hot-plate.Several ramping and holding cycles of acid treatment took the samples to dryness.After dryness was attained,samples were again dissolved in the HF.Twenty internal rock standard solutions were prepared similarly and analyzed simultaneously to check analytical quality control of the data.
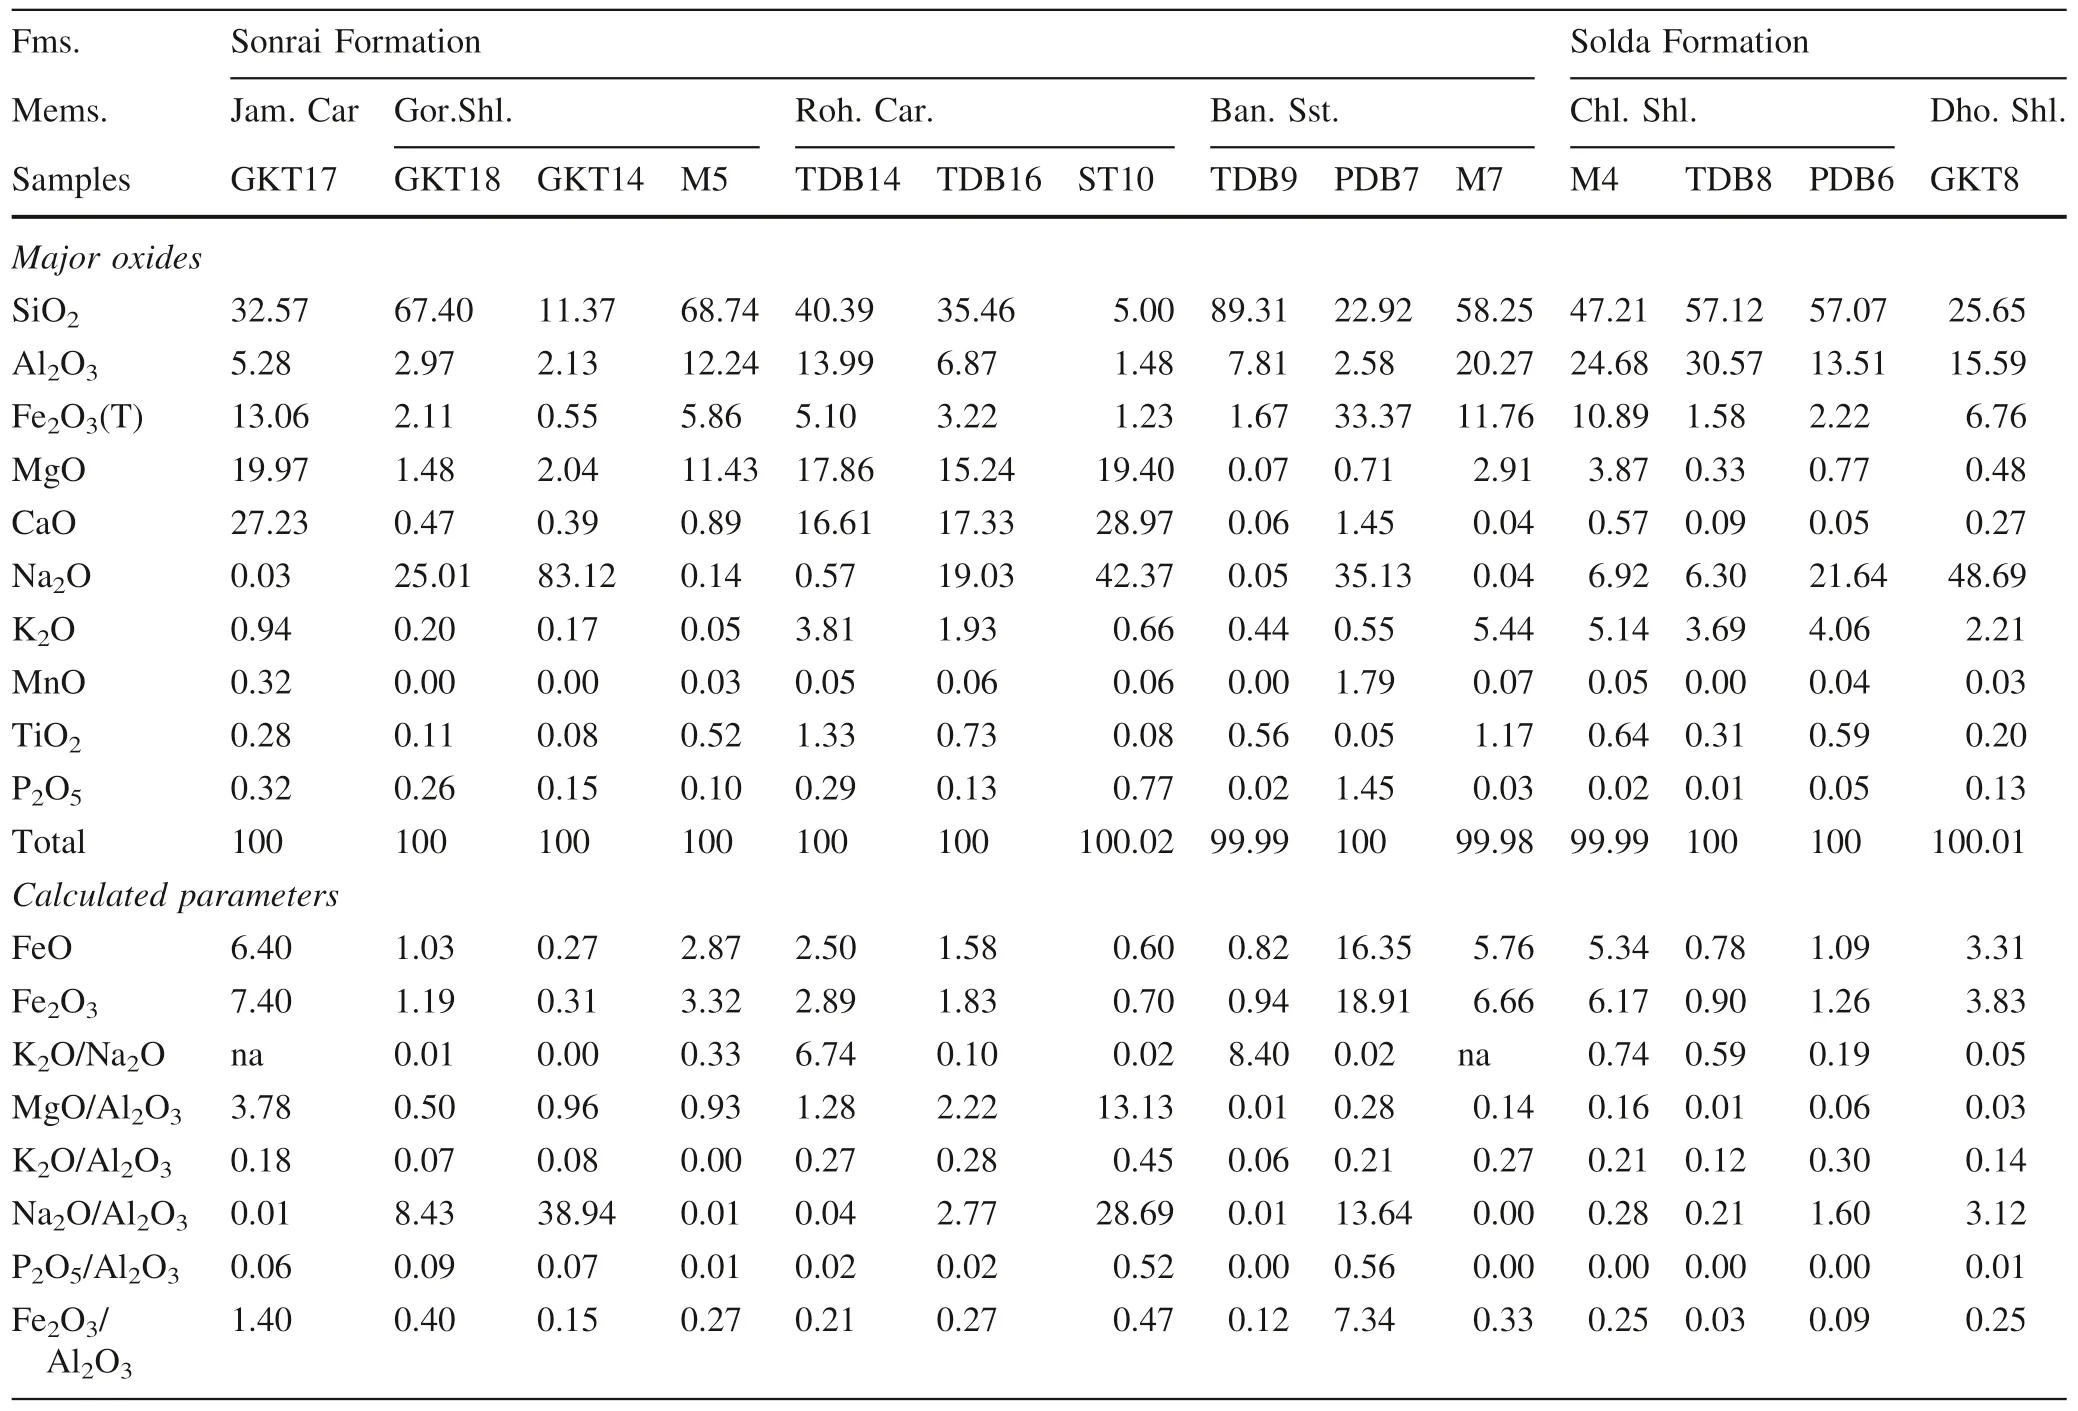
Table 2 Major oxides (wt%) and calculated parameters for the Bijawar rocks of the Sonrai basin
4 Results
4.1 Petrography
Prior to the petrographic study,fresh samples collected from the field were cleaned with the deionized water and finally air dried in an oven for megascopic study.Summarized megascopic characters(Table 1)and polished surface photographs(Fig.2)of major litho-units show that the Sonrai Formation comprises of dark grey laminated shale,light grey dolomite,and ferruginous sandstone,whereas,the Solda Formation consists of light grey laminated shale.The dominant rock type in this area is brickred phosphatic breccia with randomly oriented poorly sorted angular silty phosphatic shale.Besides this,detrital monocrystalline,rounded to sub-rounded poorly sorted quartz and chert clasts,quartzite,and vein-quartz fragments were noticed.Roy et al.(2014) observed that thin sections of highly jointed,moderately fractured siliceous buff phosphatic breccia of Rohini member show encrustations of secondary apatite.The phosphatization of mineral grains is prolific and represented by silty phosphatic shale fragments as well as phosphate cement.It also replaces authigenic silica at several places.The veins and veinlets cutting across the bedding plane at several places.Dark brown,highly ferruginous,coarse-grained,fibrous apatite in the form of encrustations developed over the grain surfaces.The chloritic shale member comprises of alternate bands of dark metapelite and light silty arenaceous bands.Former consists of recrystallized aggregates of muscovite porphyroblasts,whereas,later comprises of quartz clasts.Pyrite and chalcopyrite occupy interstices of clasts and carbonaceous globules.
I found that the scars on my chest and my leg were a big deal. They were my marks of life. All of us are scarred by life; it s just that some of those scars show more clearly than others. Our scars do matter. They tell us that we have lived, that we haven t hidden from life. When we see our scars plainly, we can find in them, as I did that day, our own unique beauty.
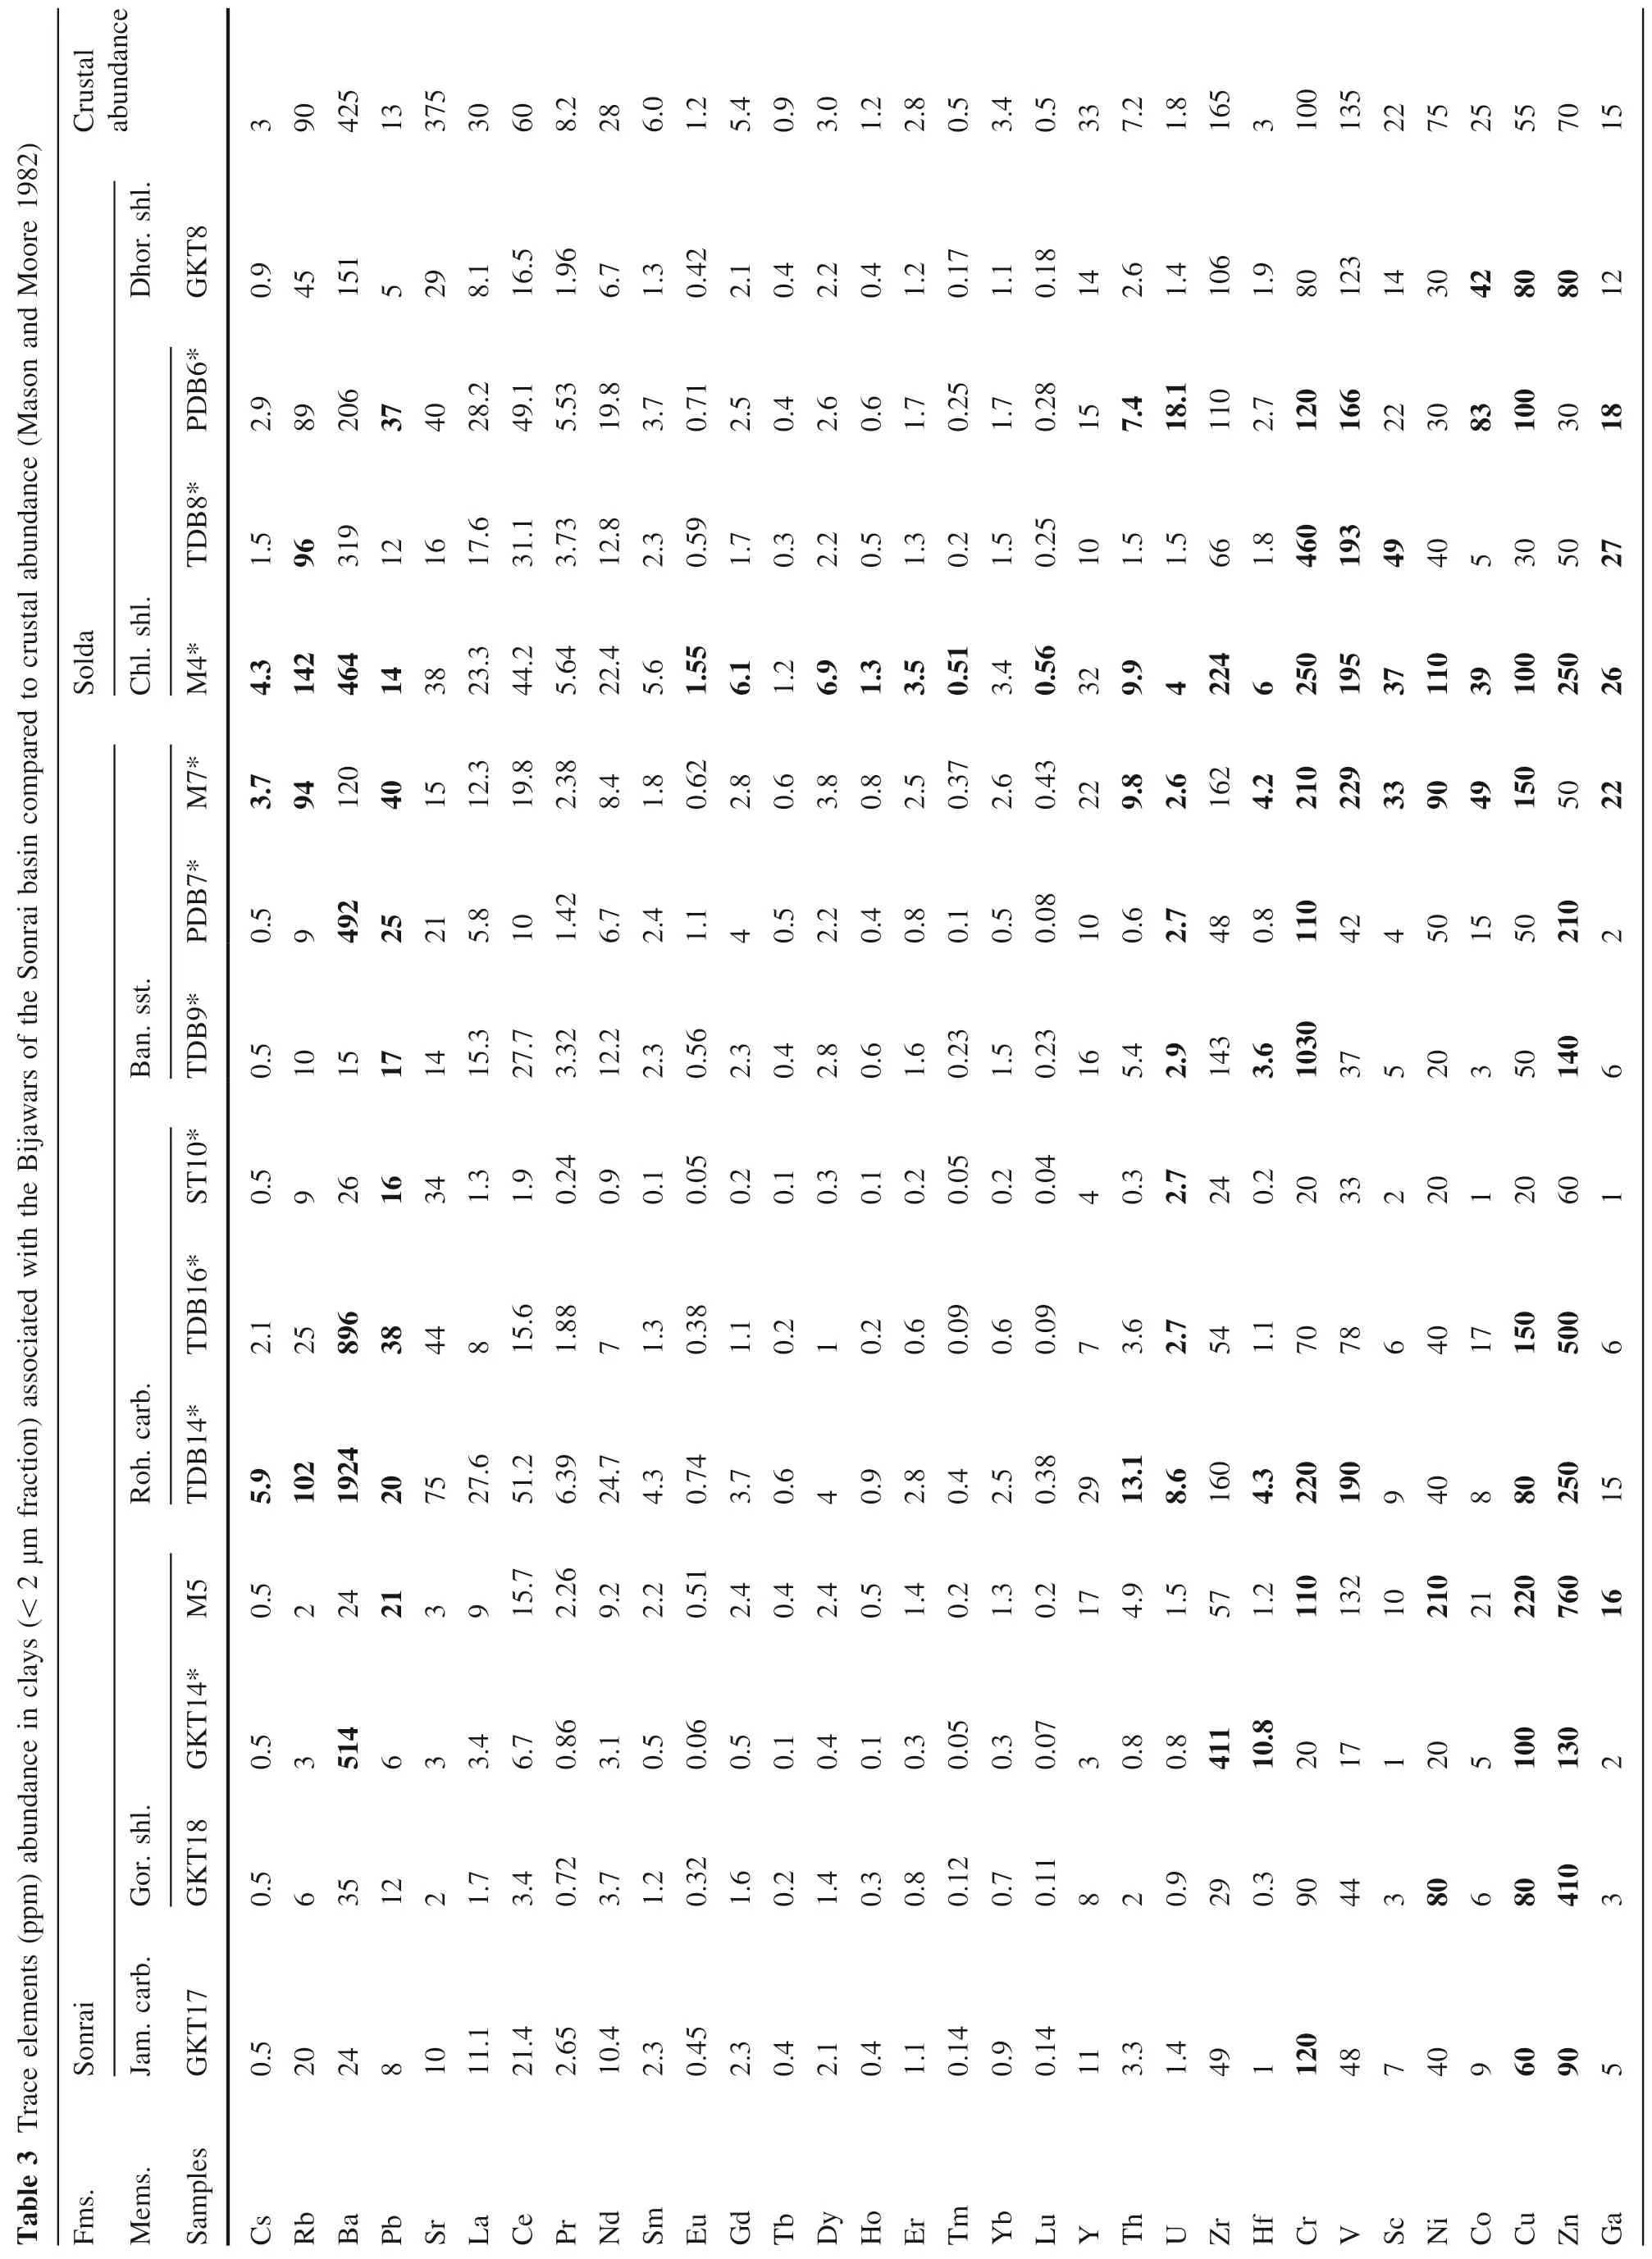
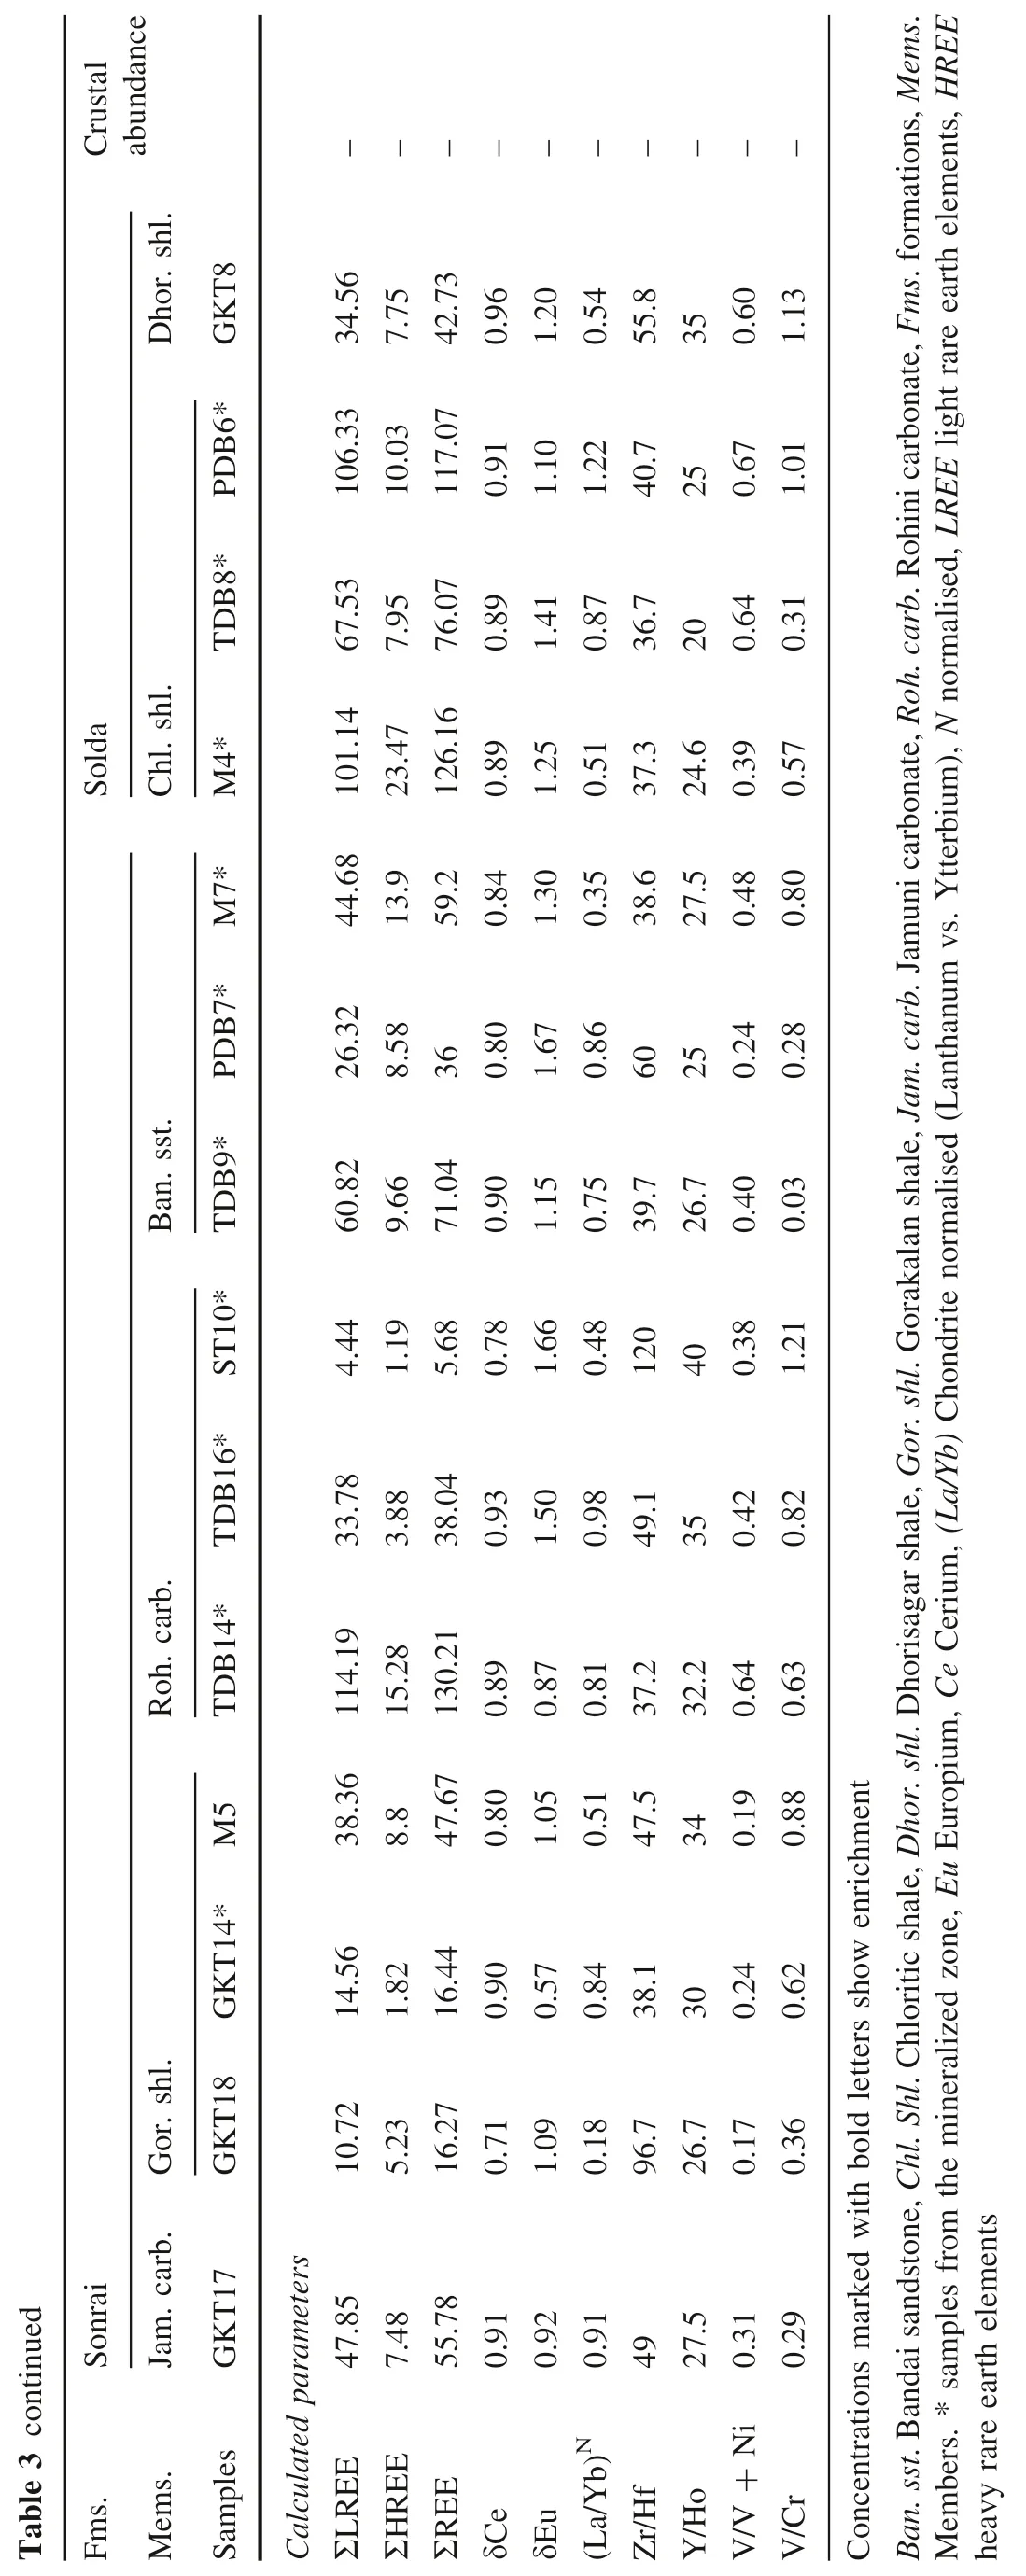
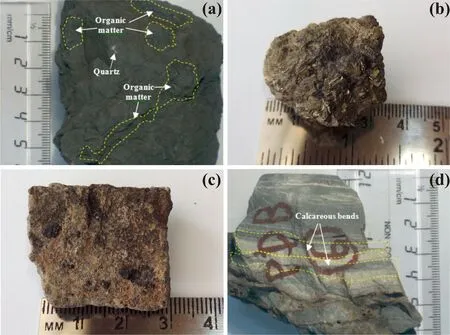
Fig.2 a Gorakalan graphitic shale,b pyrite nodules with bitumen from Rohini carbonate,c Rohini carbonate with bituminous organic matter and d Chloritic shale with calcareous bands
4.2 XRD
XRD data revealed the dominance of Kln >Chl >Ill >Sm in the Sonrai and Kln >Ill >Chl in the Solda Formations,respectively (Fig.1S).Clay mineral assemblages for Gorakalan graphitic shale,Rohini carbonate and Bandai sandstone of the Sonrai Formation represent Kln >Chl >Sm,Kln >Sm >Ill >Chl and Kln >Ill >Sm >Chl,respectively.Chloritic shale and Dhorisagar member of the Solda Formation exhibits clay in order of their relative abundance as Kln >Ill >Chl and Ill >Chl >Kln.
4.3 SEM-EDS
Obtained SEM images show a variety of microstructural attributes of the clay minerals (Fig.3).Based on major oxide data (as an electronic supplement:Tables 1S),structural formulae(Tables 4S and 5S)were calculated for individual clay minerals.Calculated thermodynamic data(Table 4S) when plotted over ternary [M+–4Si–R2+] diagram (Meunier and Velde 1989),data plots lie within the mixed layer field (Fig.4).Further,octahedral (Zo) versus interlayer (Zt) charges,tetrahedral (Zt) versus octahedral(Zo) charges and tetrahedral (Zt) versus interlayer (Zi)charges (Tables 1S),when plotted over binary diagrams,the data plots confine to illite and chlorite fields (Fig.5).These data plots show closeness with the data published by Alexandre et al.(2005)for the Dawn and Rabbit lakes and McArthur River basement-hosted unconformity-type deposits of the Athabasca basin.
Based on Si position occupied in the tetrahedral sheet and relative Fe or Fe/(Fe+Mg) values of the octahedral sheet,chlorites of the Sonrai basin were grouped into clinochlore,talc-chlorite,pennantite,ripidolite,and thuringite types.They lie within their compositional limits(Fig.6).The clinochlore and Mg-chlorite compositions from Rohini carbonate indicate hydrothermal alteration possibly linked to the Kurrat volcanic activity.The Mg rich-chlorite was abundantly found in the alteration zone.Nutt (1989) reported chlorite with high Mg and Al(VI)contents associated with the extensive chlorite dominated alteration zone enclosing an unconformity-type ore body in the Jabiluka U deposit.The U minerals are commonly associated with Mg-rich (e.g.amesite and clinochlore)chlorite and considered the abundance of clay-size Mg-rich chlorite as the end product of alteration.When Fe/(Fe+Mg)2+and Si+4values plotted for chlorite compositions (Table 1S),they lie close to the chlorite compositional field of Jabiluka UTUD,Australia (Fig.7).
4.4 Geochemistry
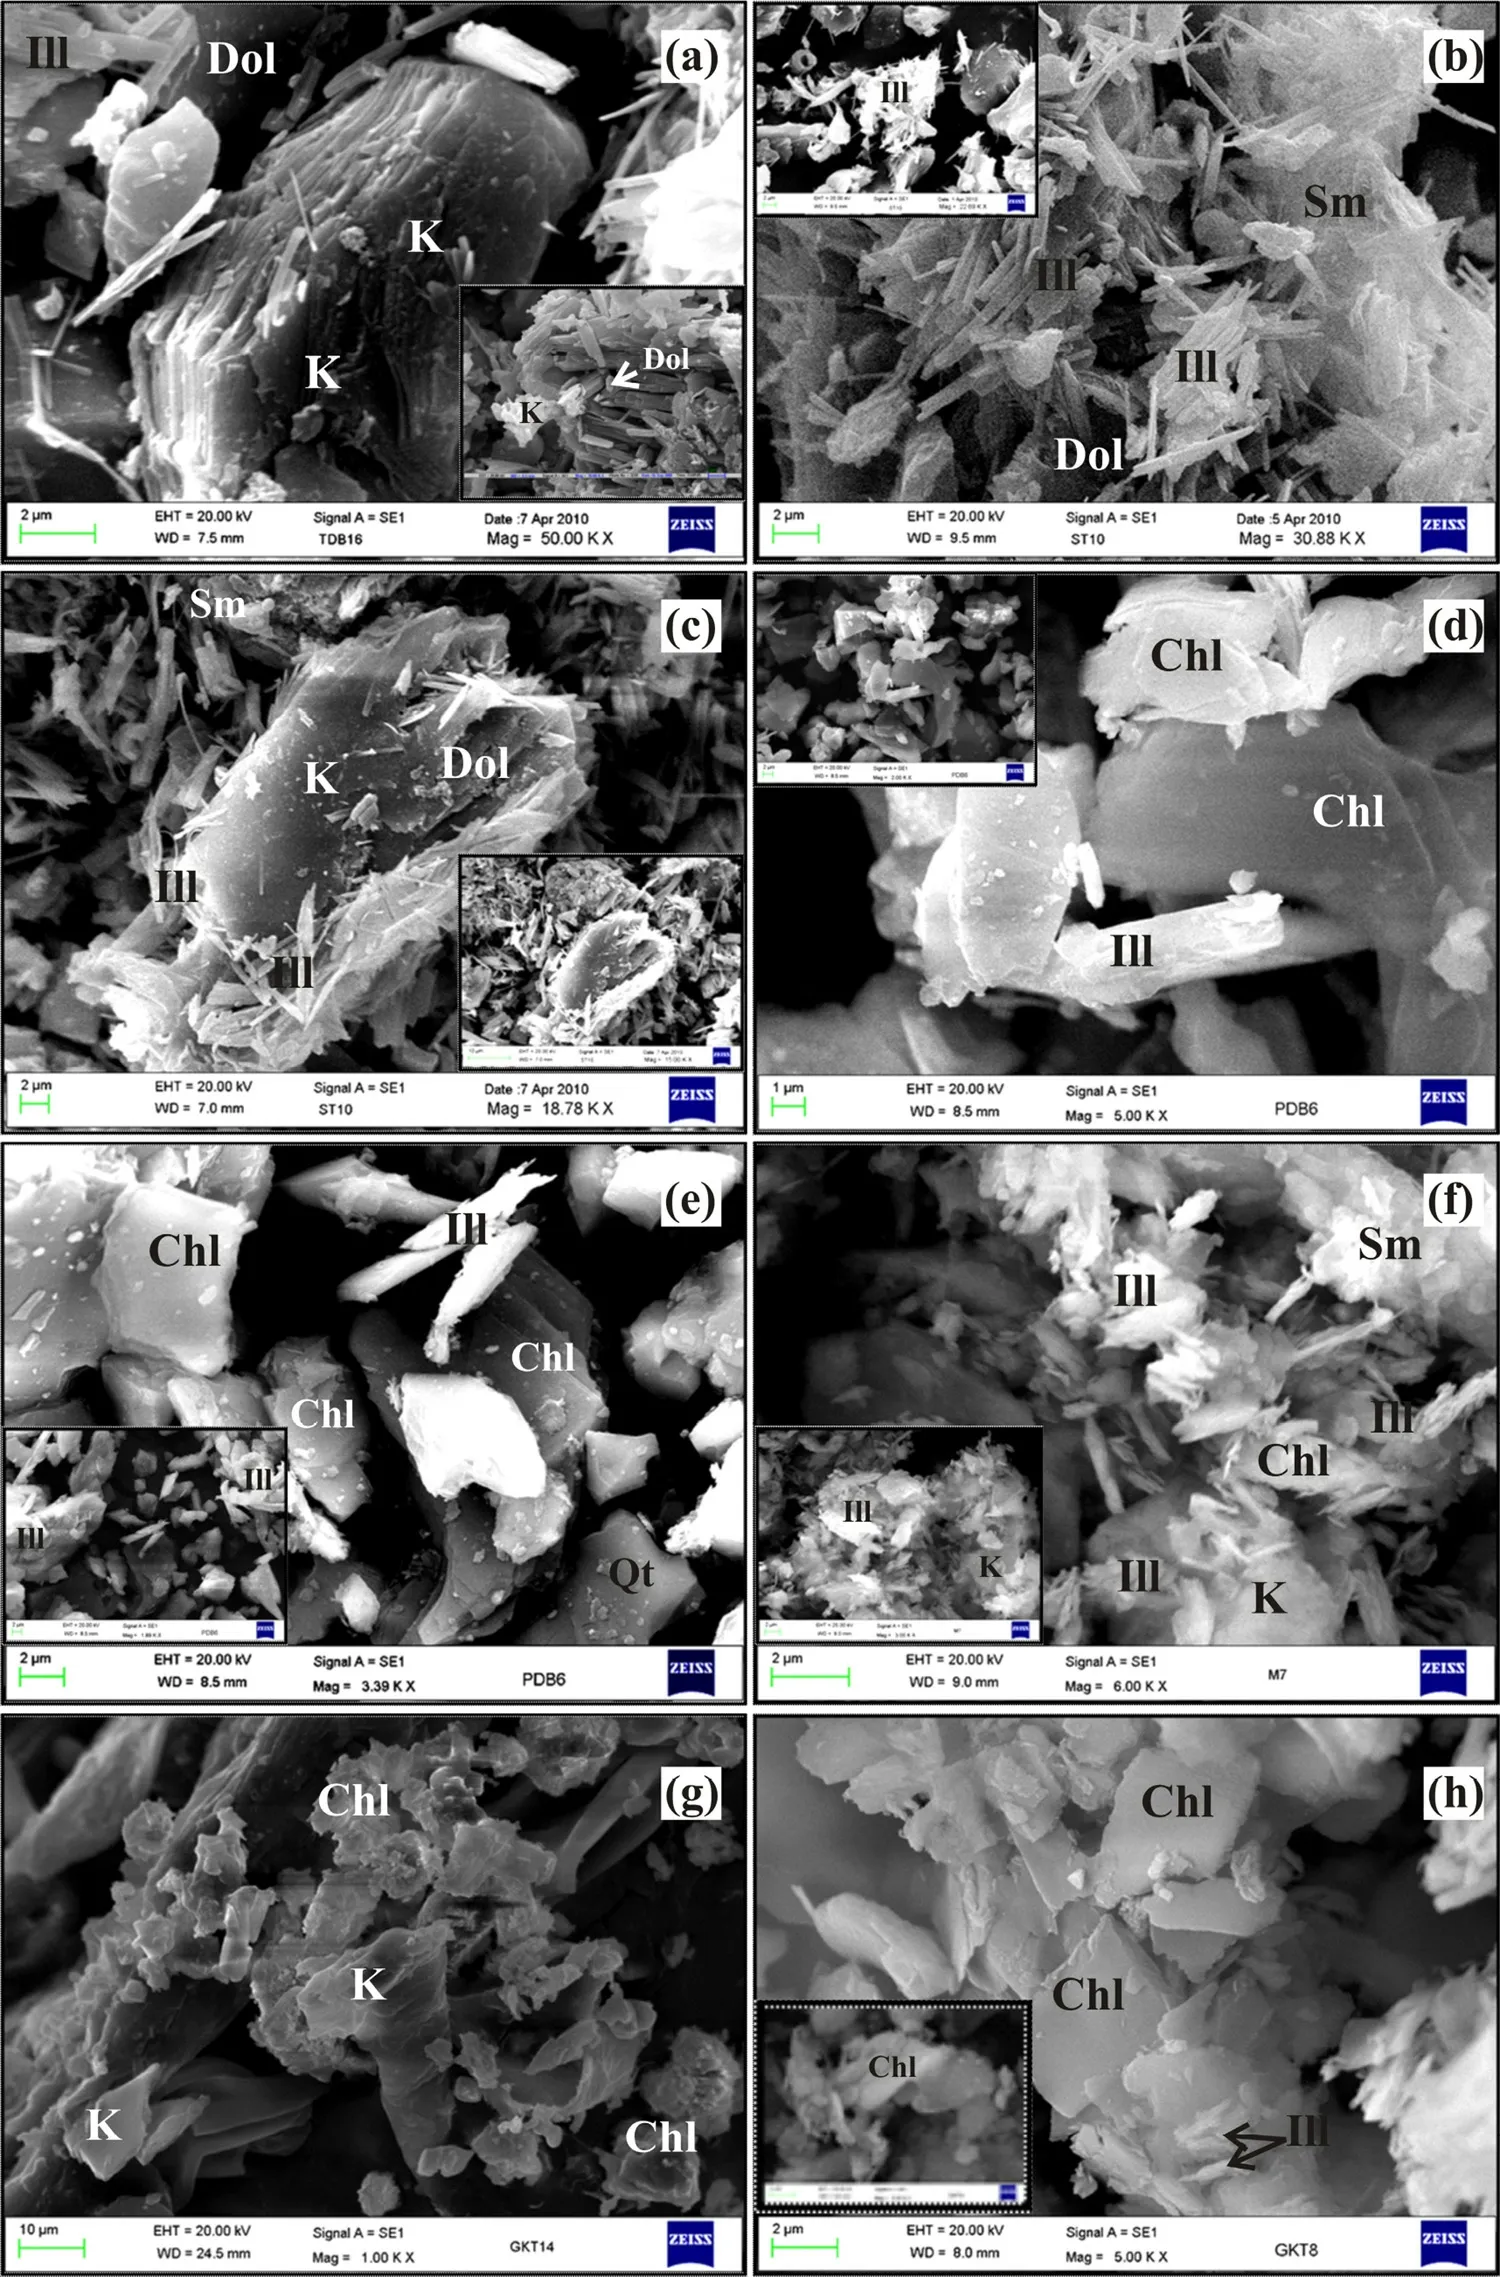
Fig.3 SEM-BSE images of (1)Rohini carbonate shows a platy kaolinite and fibrous,spiky tv-1M poly type illite(in the inset),shattered massive dolomite grains and quartz with flaky kaolinite,b abundant needleshape tv-1M poly type illite (in the inset),shattered massive grains of dolomite and hairy illite c display alteration and transformation of kaolinite into hairy tv-1M polytype illite.(2)Chloritic shale shows d uneven,flat surface,layered chlorite,massive quartz grains,laths of illite (also seen in the inset),e pseudo-hexagonal,platy laths of chlorite and platy illite(in the inset),illite laths and massive quartz gains,(3) Bandai shale shows f platy laths of kaolinite,illite,and smectite,(4)Goralalan shale shows g platy kaolinite and chlorite and (5)Dhorisagar shale shows h uneven,flat surface,layered chlorite and platy flakes of illite(in the inset) platy chlorite and illite
Despite intensely and hydrothermally altered illite and chlorite associated with the mineralized Rohini carbonate,the Bandai sandstone and Chloritic shale of the Sonrai basin show least alteration.PAAS normalized (Nance and Taylor 1976; Taylor and McLennan 1985; Mclennan 1989,2001) trace elemental data (Table 3) plotted for Gorakalan shale,Rohini carbonate,Bandai sandstone of Sonrai Formation,and Chloritic shale of Solda Formation(Fig.2S) show large-ion lithophiles (LIL) enrichment.Rb,Ba,Sr,Th,and U in rock units of both the formations indicate high retention of these elements (Fig.2S).PAASnormalized REE data when plotted for (a) Jamuni carbonate and Gorakalan shale (b) Rohini carbonate and Bandai sandstone of Sonrai Formation and (c) Chloritic shale and Dhorisagar shale of the Solda Formation(Fig.8)show low LREE and high HREE abundances.Most of the REE patterns are linear and flattened without any intensive fractionation (Fig.8).PAAS-normalized REE patterns show HREEs enrichment,whereas,LREEs represent depletion due to their fractionation (Fig.9).To study UTUD,Fayek and Kyser (1997) used Post-Archean Australian Shale(PAAS)and Chondrite normalized data plots.REE study on U deposit and their host rocks help to understand genesis and formation of U deposits (Rene 2008;Mercadier et al.2011).PAAS normalized(Mclennan 1989) REE data (Table 1) plots (Fig.8) for (a) Jamuni carbonate and Gorakalan shale (b) Rohini carbonate and Bandai sandstone of the Sonrai Formation,and (c) Chloritic and Dhorisagar shale of the Solda Formation,contain low LREE and high HREE values and show linearly/flattened patterns.But Chondrite normalized (Taylor and McLennan 1985) REE data plots show LREEs enrichment and negative Eu anomalies (Fig.10).
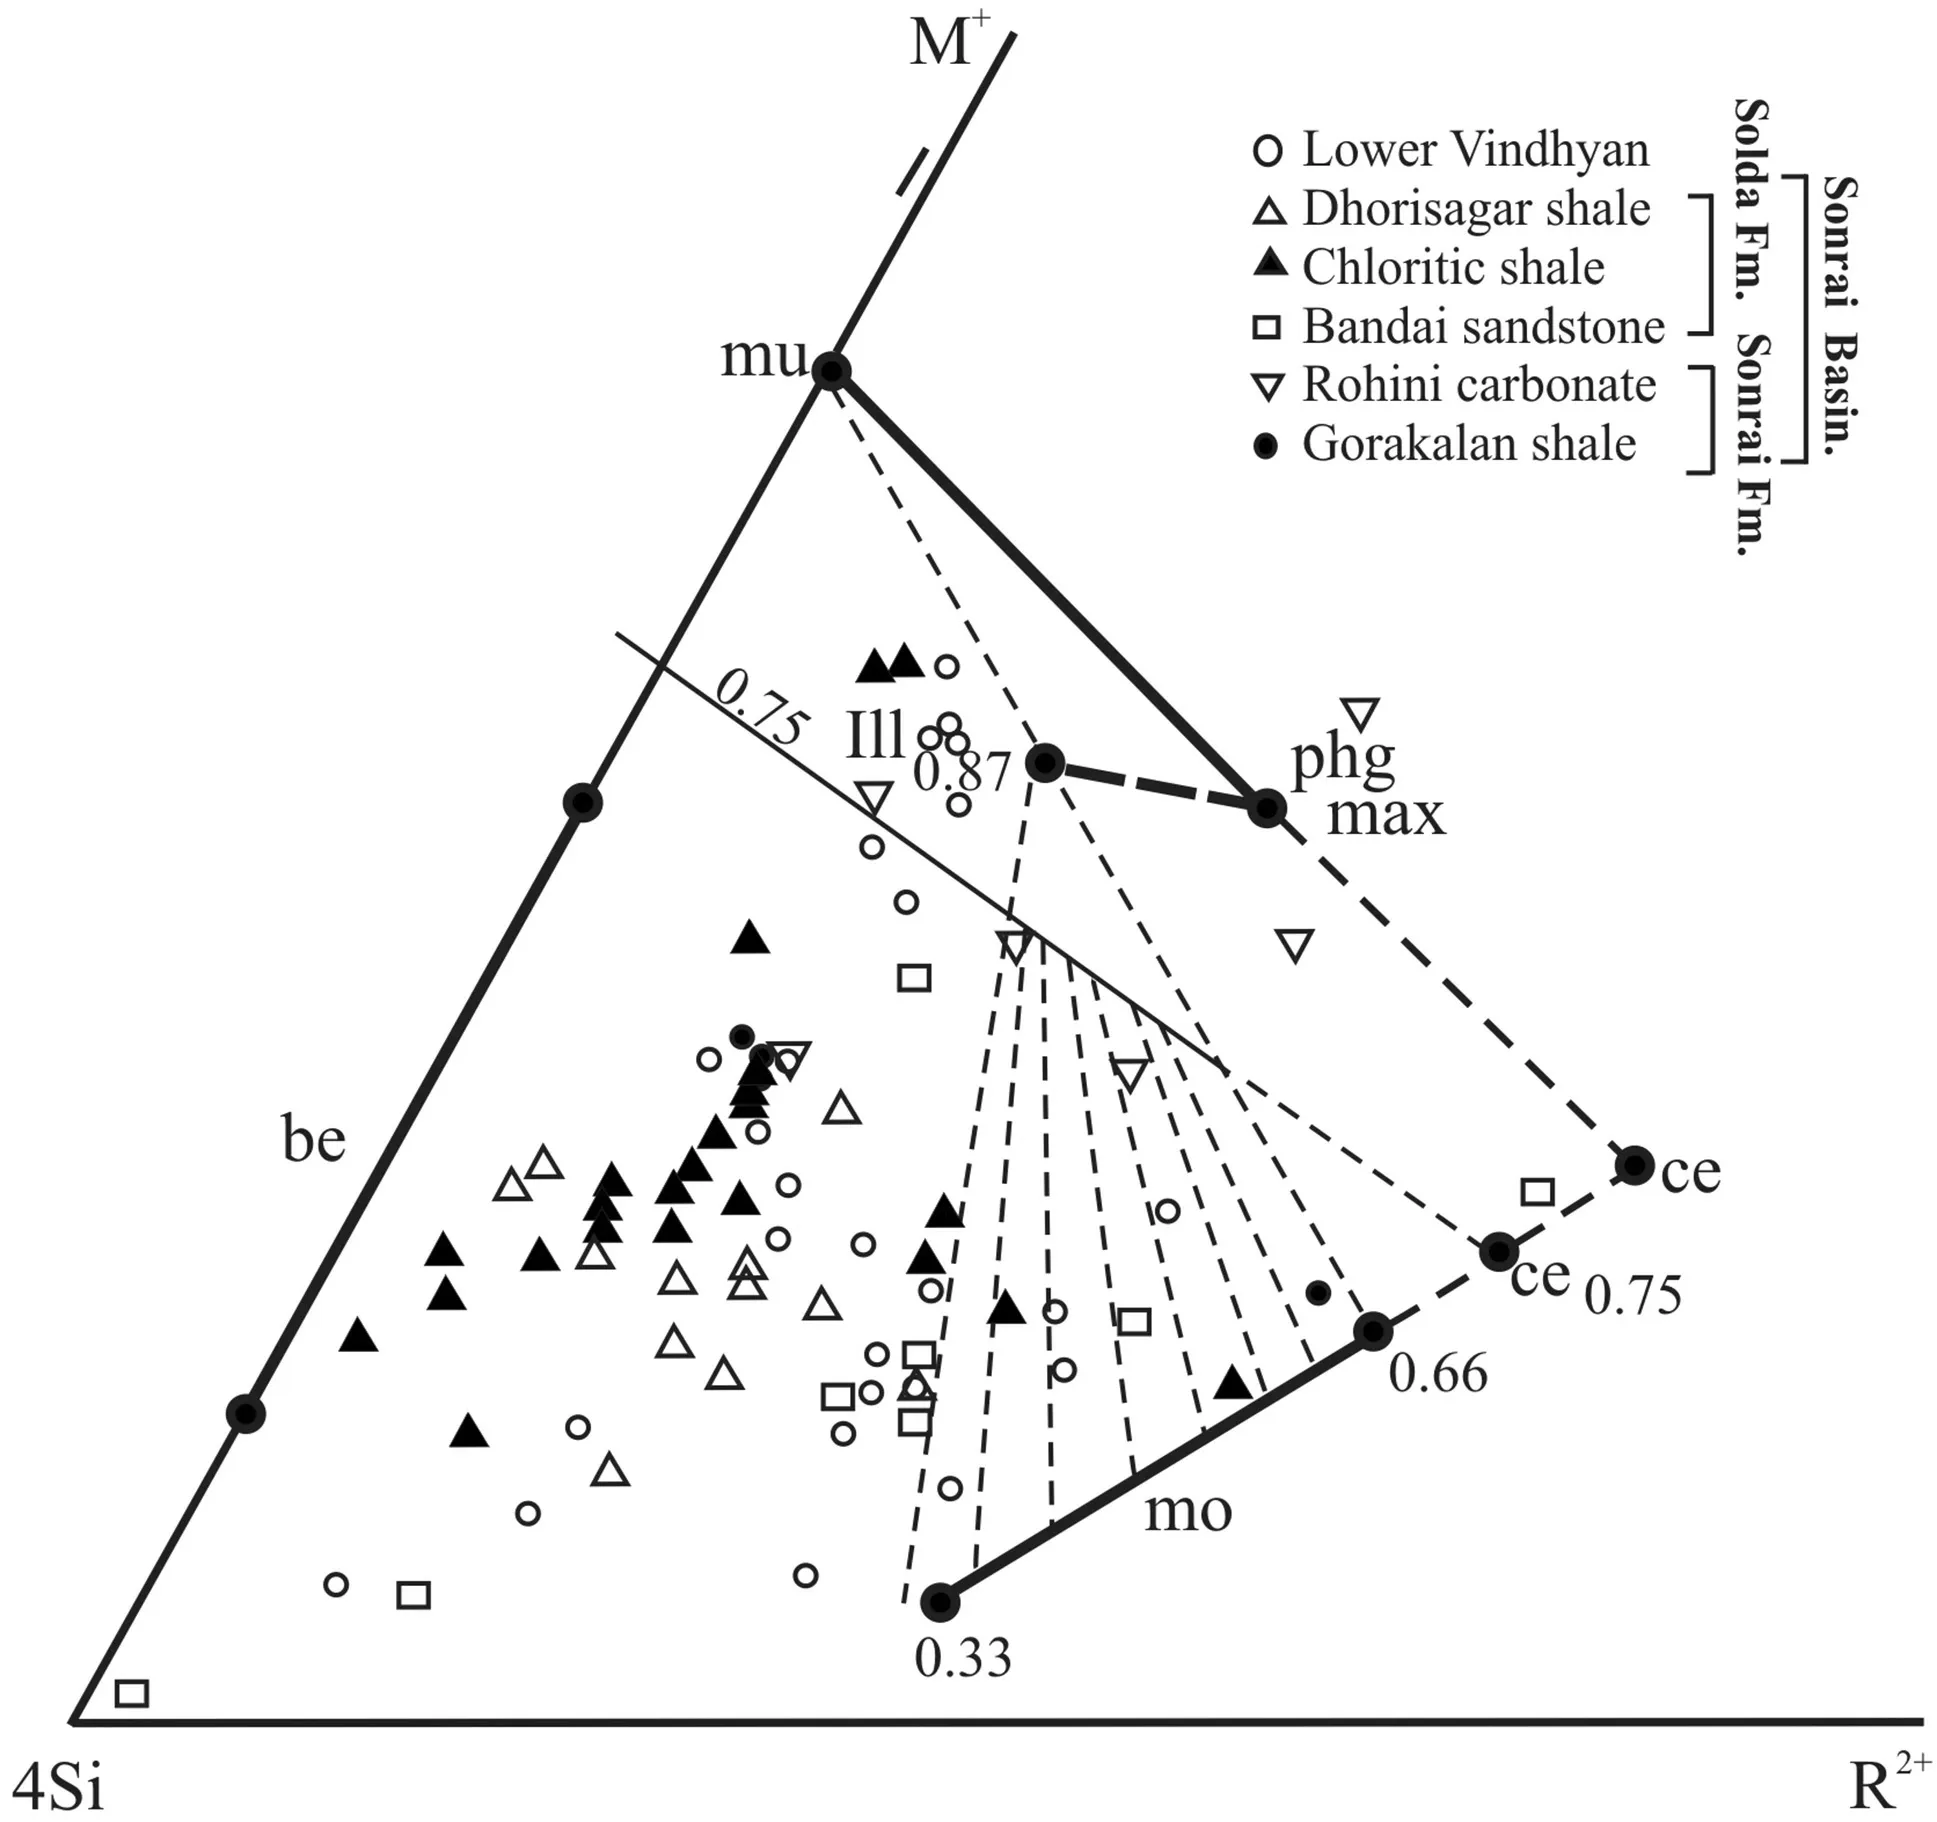
Fig.4 Chemographic representation of smectites,I/S mixed layers,illite and mica in the M+–4Si–R2+ system (after Meunier and Velde 1989) showing data plots (for Solda,Sonrai Formations,and Vindhyan clays) lie within illite and mixed layer clay fields.Bipole solid solutions are represented by heavy lines.Solid-solution tie lines for I/S mixed-layer mineral series are symbolized by dashed lines.Ce celadonite,be bentonite,mu muscovite,mo montmorillonite
4.4.1 Whole rock geochemical analysis
Out of 14 samples,10 from Sonrai and 4 from Solda Formations (covering each member) were analyzed for major (Table 2) and trace (Table 3) elemental concentrations by Fusion ICP-MS method.The SiO2versus(a)TiO2,(b) Al2O3,(c) Fe2O3(t),(d) Na2O,(e) CaO and (f) MgO data plotted (Fig.11) for Jamuni carbonate,Gorakalan shale,Rohini carbonate,Bandai sandstone,Chloritic shale,and Dhorisagar shale units.Besides this,Al2O3versus(a) MgO,(b) Na2O,(c) K2O,(d) TiO2,(e) P2O5and(f)Fe2O3(t)data also plotted for these units(Fig.12).High SiO2,CaO,and MgO contents show positive trends(Fig.11) for TiO2and Al2O3in case of Jamuni carbonate containing abundant smectite and illite phases (Das and Haake 2003).The Gorakalan shale shows linear trends over SiO2versus CaO,MgO and Fe2O3diagrams(Fig.11c,e,f)and Al2O3versus K2O and P2O5diagrams(Fig.12c,f).For graphitic shale,the positive correlations between SiO2versus TiO2and Al2O3(Figs.11 and 12) show a high degree of weathering which was responsible for the dominance of residual fine clay minerals in this unit.In the case of the Dhorisagar shale of the Solda Formation,the data plotted (Fig.11) between SiO2and Al2O3,TiO2,Fe2O3,and Na2O show high values.High K2O/Na2O values (>2)were found in the case of Gorakalan shale and Rohini carbonate.However,low K2O/Na2O values (0.01–2)observed in the case of Jamuni carbonate,Bandai sandstone,and Chloritic shale.The Gorakalan shale shows strong negative anomalies for Rb and Sr and positive anomalies for Pb,Ni,and Zn (Fig.1Sa).
4.4.2 Altered rock geochemical analysis
The Rohini carbonate shows negative trends over SiO2versus CaO,MgO and Na2O diagrams,however,Fe2O3and TiO2data plots (Figs.11 and 12) representing positive trends,and Fe and Ti enrichment in the residual rocks at the time of chemical weathering.Bandai sandstone show both positive and negative correlations between TiO2and Al2O3,and Fe2O3and Na2O data plots (Fig.11),respectively.The Chloritic shale of Solda Formation is characterized by positive and negative trends as observed in the case of SiO2versus Al2O3,Na2O and MgO,Fe2O3,TiO2data plots (Fig.11),respectively.The U mineralization reported from Rohini carbonate and Bhandai sandstone from the Sonrai Formation show Eu enrichment which is possibly attributed to reducing environment.Moreover,hydrothermally altered rocks of the Rohini carbonate show M-shaped (Fig.10) Gd–Tb–Dy–Ho tetrad effect (Masuda et al.1987)and is more or less similar to that reported from the Moldanubian U deposits(Rene 2008).The mineralized rock of Rohini carbonate (Zr=160 and Y=29),Bandai sandstone (Zr=162 and Y=22) of the Sonrai Formation and Chloritic shale (Zr=224 and Y=32) of Solda Formation represent high mobility of Zr and Y with respect to HREE.Further,high mobility of Zr and Y is explained by M-shaped tetrad effect,accompanied by anomalous behavior of Y,Zr,and Hf.In Bijawar metasediments,nonchondritic Y/Ho and Zr/Hf values (Table 3) vary from 38.1–96.7 to 20–40,respectively.Moreover,these values are comparable to those reported by Rene (2008) from the Rozna and Moldanubian U deposits and suggested considerable mobility of Zr during U mineralization.
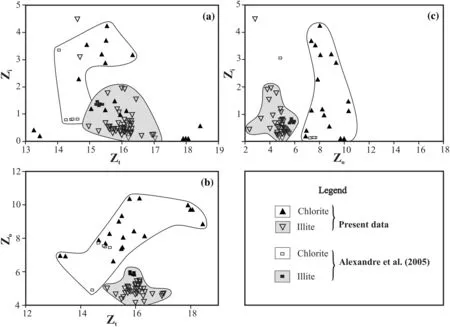
Fig.5 Bivariate data plots for a octahedral (Zo) versus interlayer (Zi),b tetrahedral (Zt) versus octahedral (Zo),and c tetrahedral (Zt) versus interlayer (Zi) charges in illite and chlorite clays from Sonrai basin (Table 2S) and their comparison with the published data (cited Table 2:Alexandre et al.2005)
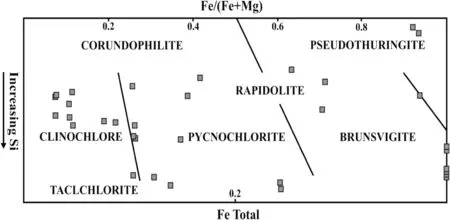
Fig.6 Chlorite compositions when plotted over Si and octahedral Fe,and Fe/(Fe+Mg)contents(Hey 1954)show clinochlore,rapidolite,talcchlorite and compositions
5 Discussion
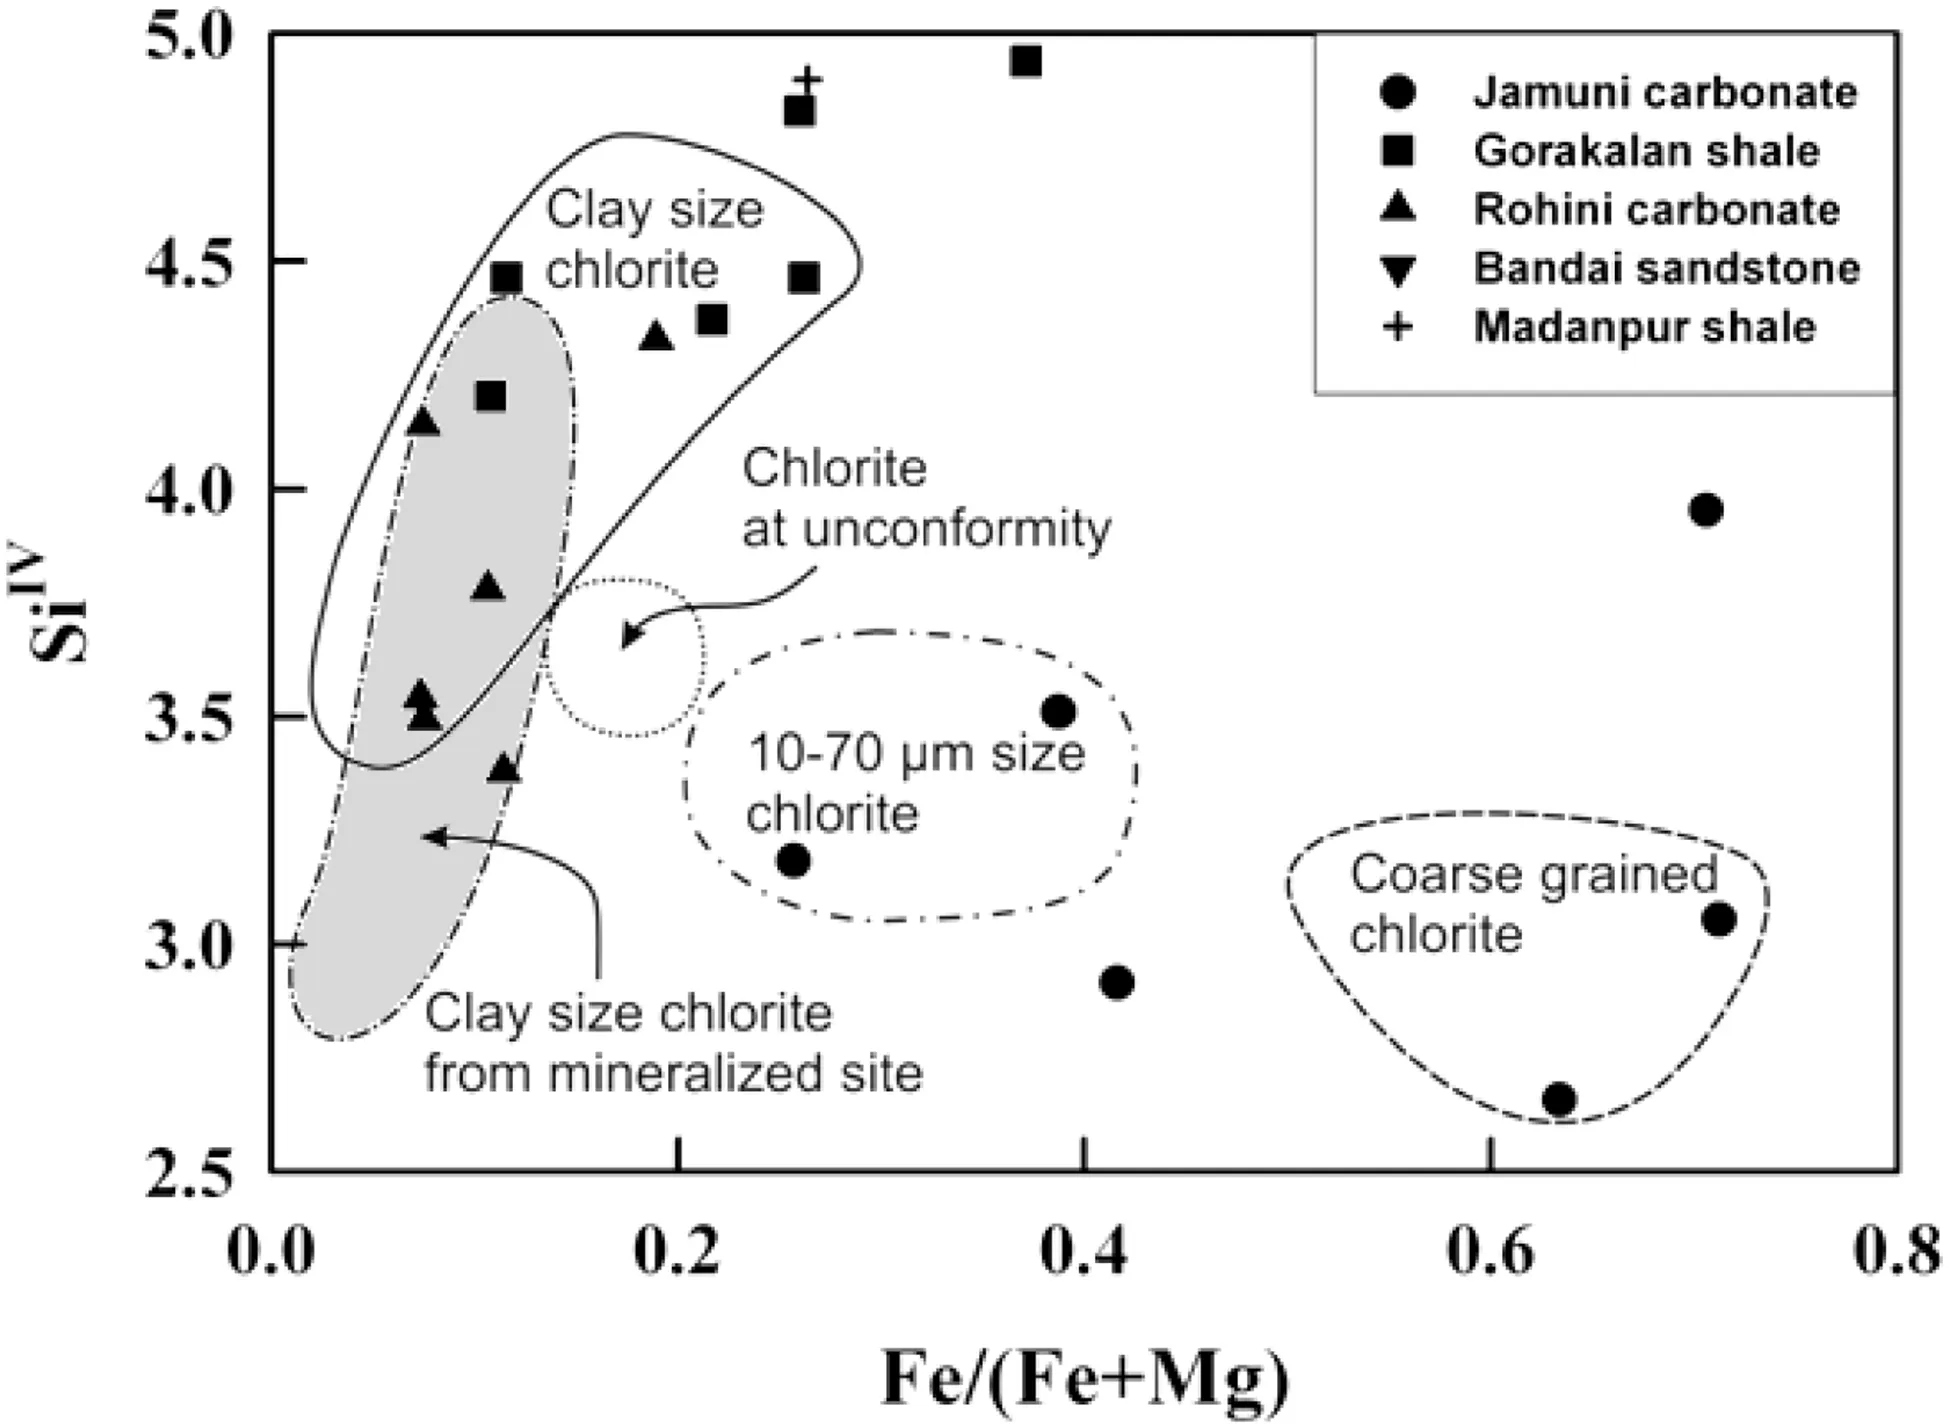
Fig.7 Present chlorite data when plotted between Fe/(Fe+Mg)and Si (in mole fractions) diagram (Nutt 1989) show compositional correlation with the coarse grained chlorite,10–70 μm size chlorite,and clay size chlorite from the mineralized zone of Jabiluka UTUD,Australia
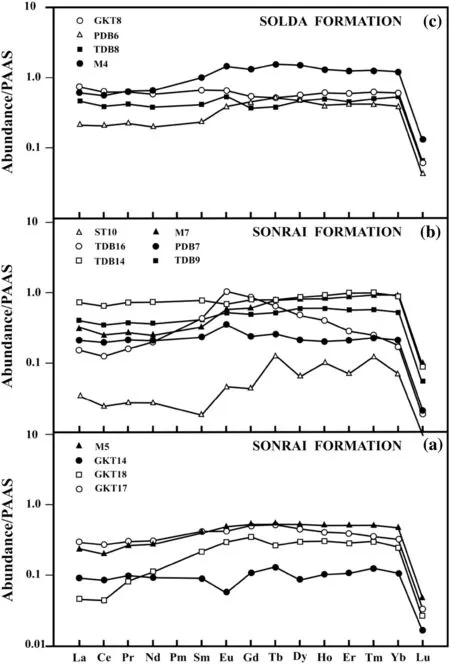
Fig.8 PAAS-normalized (McLennan 1989) REE (arranged in order of increasing ionic radii) data plots for a Jamuni carbonate and Gorakalan shale,b Rohini carbonate and Bandai sandstone of Sonrai Formation,and c Chloritic shale and Dhorisagar shale of Solda Formation of the Bijawar Group.U mineralization is associated with the Rohini carbonates and Bandai sandstone,whereas other units are non-mineralized
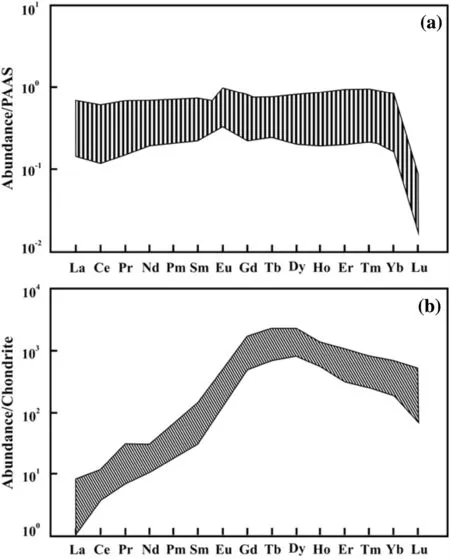
Fig.9 a PAAS normalized (McLennan 1989) REE (arranged in order of increasing ionic radii) patterns for clays (<2 μm fractions)separated from Rohini carbonate and Bandai sandstone of Sonrai Formation and b Chondrite normalized (Anders and Grevesse 1989)REE patterns of the unconformity related McArthur and Sue U deposits of Canada (Mercadier et al.2011)
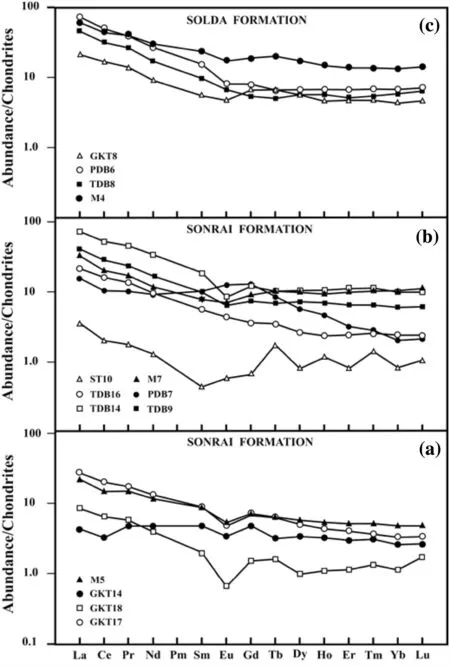
Fig.10 Chondritic-normalized (Taylor and McLennan 1985) REE(arranged in order of increasing ionic radii) data plots for a Jamuni carbonate and Gorakalan shale,b Rohini carbonate and Bandai sandstone of Sonrai Formation and c Chloritic shale and Dhorisagar shale of Solda Formation of the Bijawar Group
REE abundance in the U oxides suggests a type of U deposit (Fryer and Taylor 1987).Fayek and Kyser (1997)discussed that the REE signatures are analogous to the alteration halos associated with the typical UTUD.In the case of U oxides,REE fractionation is important as their ionic radii (1.16 to 0.977 A˚)are close to that of U4+(1 A˚)in eight-fold coordination.However,most of them are not sensitive to the changes in the redox conditions(Bonhoure et al.2007).Jha et al.(2012) discussed high fluid/rock interaction and super-saturation of fluids in proximity to the U mineralization.
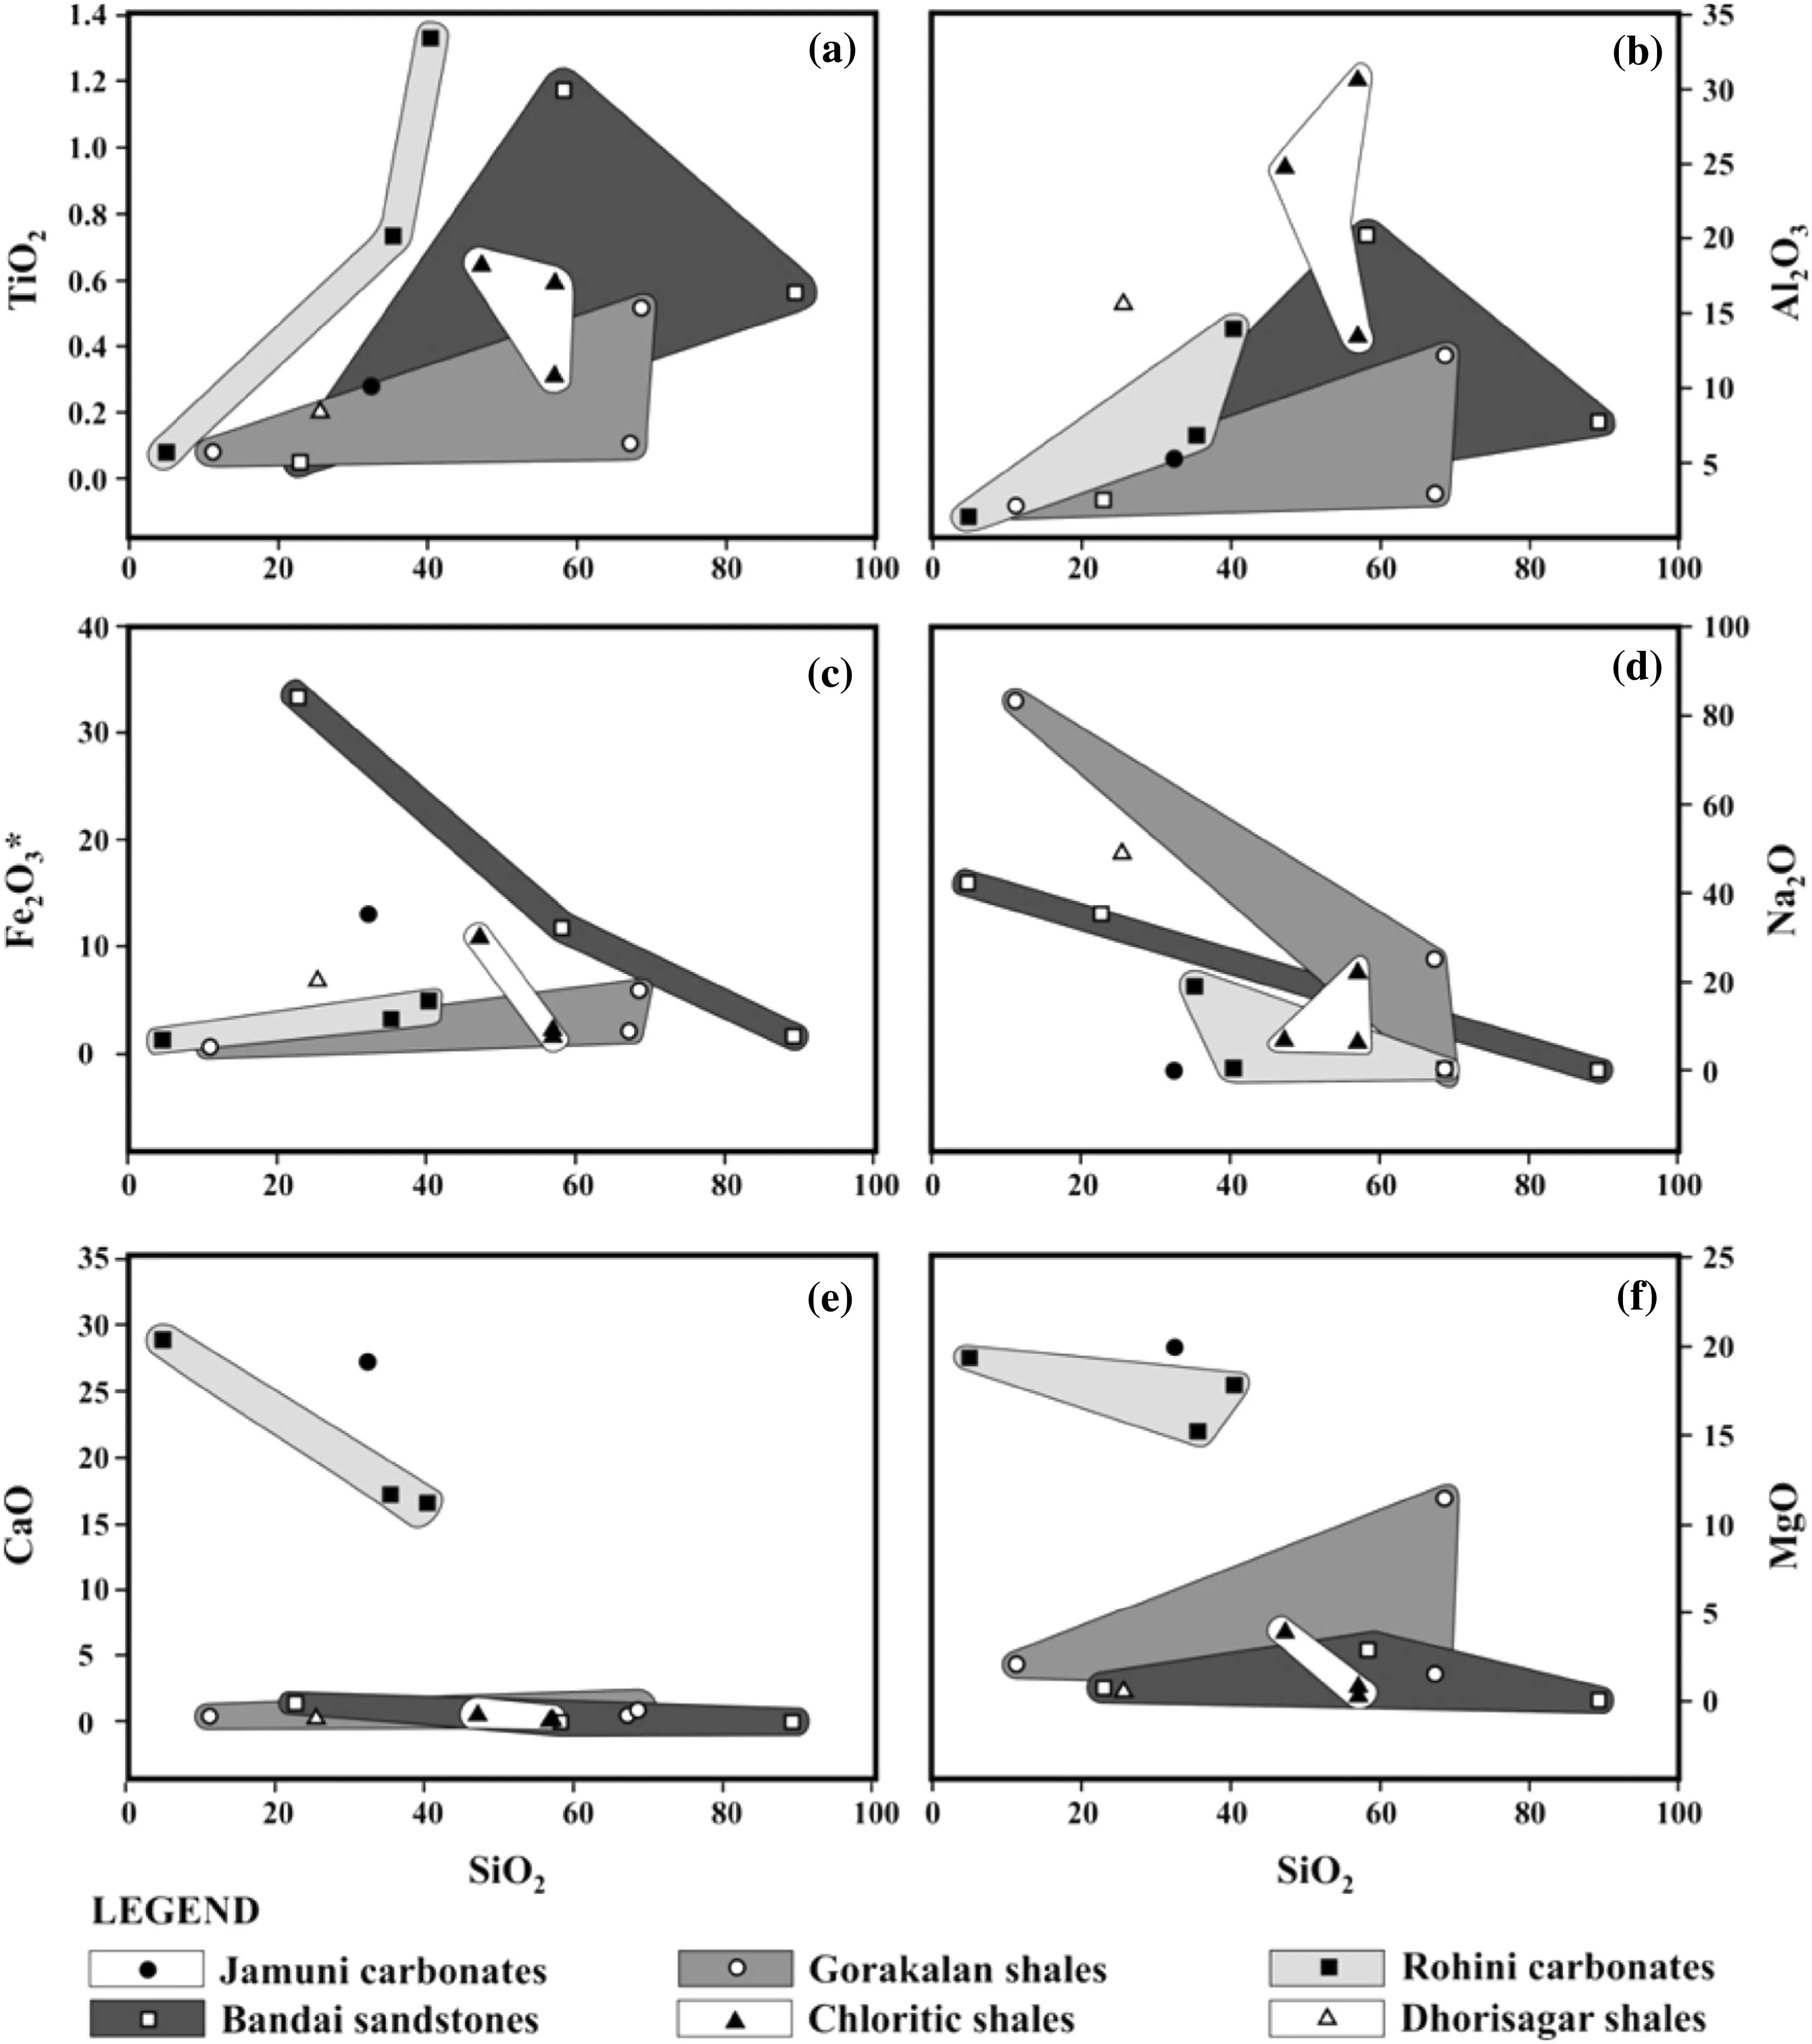
Fig.11 Bivariate data plots between SiO2 versus a TiO2,b Al2O3,c Fe2O3(total),d Na2O,e CaO and f MgO for Jamuni carbonate,Gorakalan shale,Rohini carbonate,Bandai sandstone,Chloritic shale and Dhorisagar shale members of the Bijawar Group
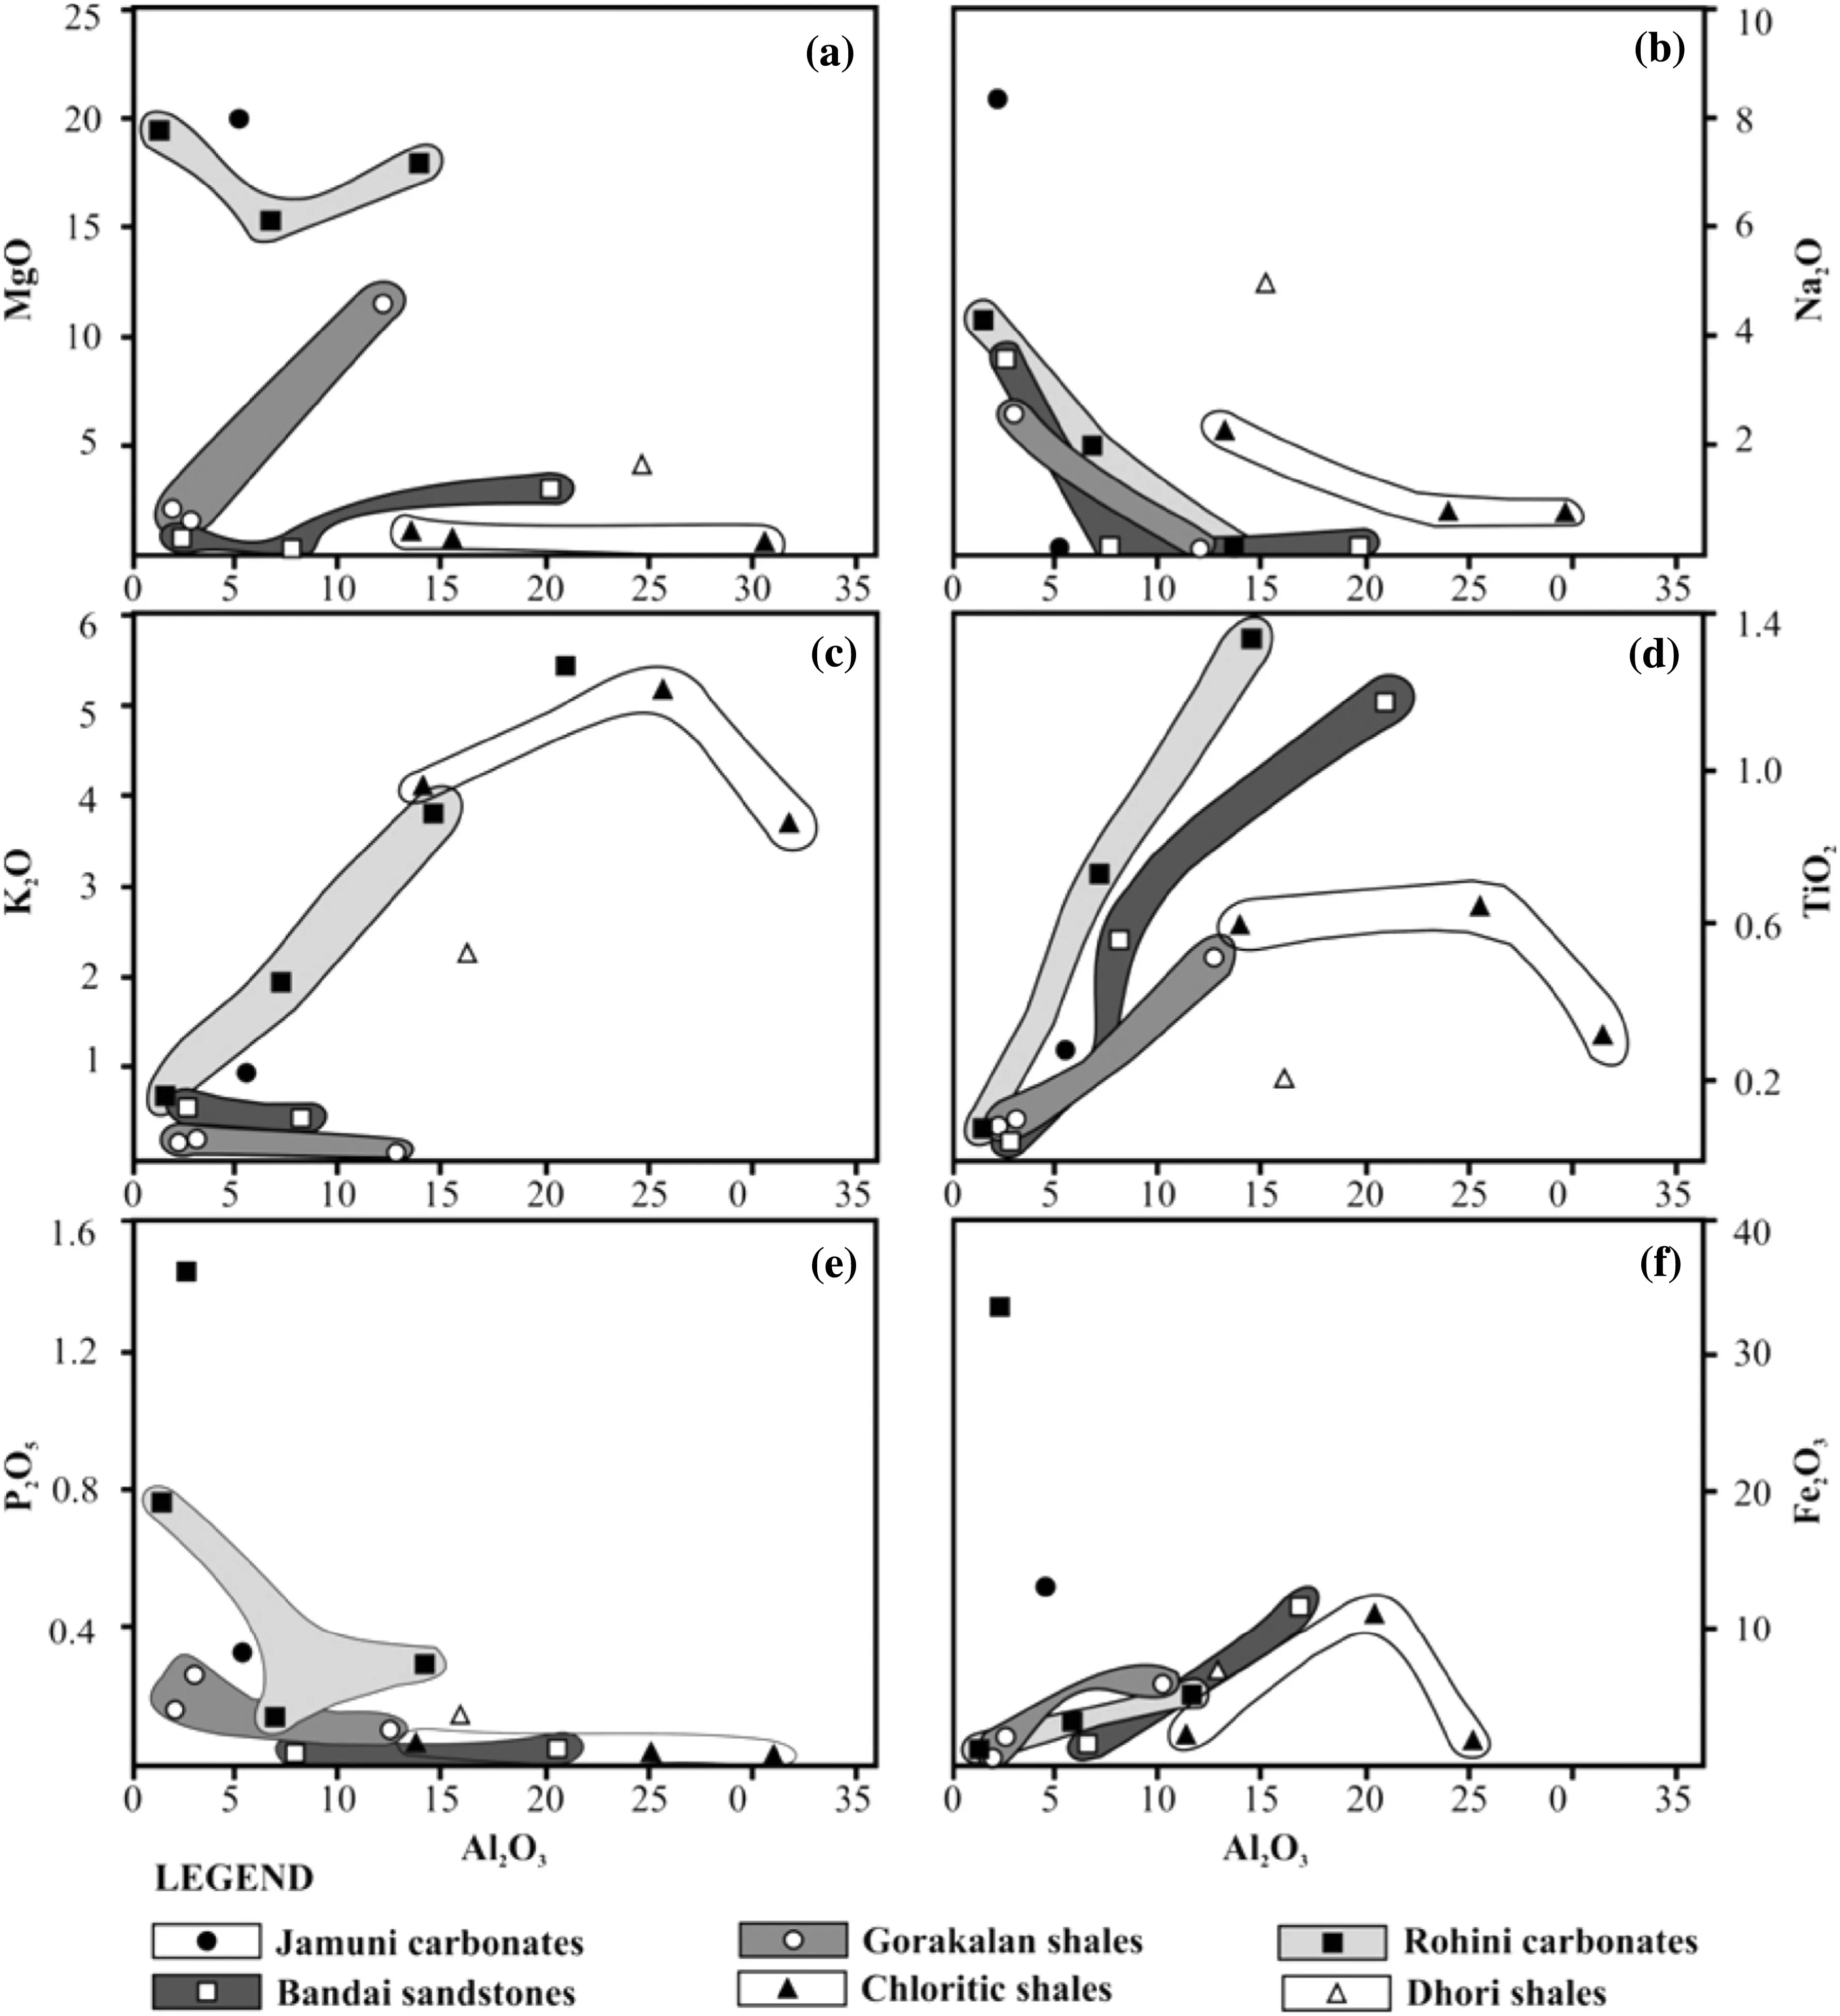
Fig.12 Bivariate data plots between Al2O3 and a MgO,b Na2O,c K2O,d TiO2,e P2O5 and f Fe2O3 for Jamuni carbonate,Gorakalan shale,Rohini carbonate,Bandai sandstone,Chloritic shale and Dhorisagar shale of the Bijawar Group
Chlorite associated with the unconformities and alteration halos represents low Fe/(Mg+Fe)and high Si values.But,clay size chlorite with low Si,Fe/(Fe+Mg)and Alvi/Alivvalues suggests chloritization,where,quartz dissolution by Mg-rich fluids at high fluid-rock ratios occurred as a product of alteration (Nutt 1989).The low Fe/(Fe+Mg) values obtained from clay-size chlorite of this area suggest that the Mg-rich fluids were available throughout the process of chloritization.Moreover,chlorite compositional attributes of the Jamuni carbonate resemble coarse-grained chlorite and 10 μm size chlorites of the altered meta-sedimentary rocks (Fig.7).These coarsegrained chlorites show low octahedral occupancies and also net-layer charges varying from 0.3 -1.8 and 6.09 -8.69,respectively (Table 5S).It occurs in veins.These veins cut across the clay-size matrix chlorite.A few Fe and Mg-rich chlorite types contain Mn with negative tetrahedral charges and are restricted to the pennanite and clinochlore compositional fields (Fig.7).Bailey and Lister(1989 and references therein) discussed that small amount of Ca+Na+K are often reported from chemical analyses of dioctahedral chlorites as cations residing between the 2:1 layers and the interlayer sheet,but they are more likely to be impurities.Amount of K ions present in most of the chlorites of this area is very close to the K content of chlorite associated with the UTUM (Beaufort et al.2005).Moreover,hydrothermally altered chlorite contains minor amount (0.01–0.04) of K.Presence of these ions is due to the incorporation of K,Na and Ca ions in the chlorite lattices(Wilkinson et al.2015).Assumingly,K+,Na2+and Ca2+are present in the mixed-layer chlorite/corrensite(Shau and Peacor 1989).In Jabiluka U deposit,clay-size chlorite is the main constituent of the host rock matrix and is conspicuously associated with the ore minerals.Finegrained chlorite (ranges from 50 μm in length to <5 μm across it) appears as cryptocrystalline and categorized as clay size chlorite.Mg-rich host rock alteration mainly involves the exchange of Mg for Fe ions during replacement of the earlier-formed chlorite by clay-size chlorite(Nutt 1989).Chlorite associated with the Gorkalan and Madanpur shale is similar to fine clay size chlorite of the Jabiluka UTUD (as characterized by high Mg and Si contents).Clay size chlorite compositions reflect substitution or replacement in the mineral lattices and a variable degree of chloritization (Nutt 1989).Thus,pre-existing coarse-grained detrital clays so resulted were converted into authigenic clay size chlorites and characterized by high Si4+and negative tetrahedral charges (including octahedral occupancy that ranges from 1.8 to 4.5).These chlorites contain octahedral Al3+(varies from 1.4 to 2.6),high Mg2+(varies from 1.5 to 3.1) and much higher net layer charges that range from 5.9 to 10.4 (Table 1S).Chlorite composition of the mineralized Rohini carbonate is characterized by high Si4+(3.5) and Mg2+(3%–3.8%)contents with low octahedral occupancy (from 1 to 1.7).The Mg-rich chlorite resembles to clay size clinochlore and sudoites of the Jabiluka U ore deposit (Fig.7).Most of them formed after mineralization were responsible for U ions remobilization.However,chlorite compositions from Bandai sandstone do not fall within the compositional limit of these chlorites.Present study on clay mineral assemblages or clay-types,paleoclimatic conditions and claycrystallinities suggested U mineralization in the Sonrai Formation.Presence of clay-size Mg-rich chlorite (Mgclinochlore) composition of Rohini carbonate suggests early stages of hydrothermal alteration in vicinity of the U mineralization.However,coarse-grained Fe,Al chlorite(pennantite,Al-sudoite,and clinochlore) compositions from Jamuni carbonate and Gorakalan shale show late stages of alteration,occurred far away from the mineralized zone.
Generally,Post-Archaean sedimentary rocks show an increase in the Al2O3versus CaO,Fe2O3,MgO and Na2O ratios with the decrease in the Al2O3versus K2O ratios(Taylor and McLennan 1985).However,major oxide data do not show their characteristic monomineralic composition as other minerals including quartz,feldspar,dolomite,calcite,and pyrite were also present.None of these clay separates comprised of a single phase,but,they are an admixture of more than one variety of clays,therefore the chemistry of the mixed clay minerals is not comparable to a particular single standard clay mineral.Bivariate data plots (Figs.11 and 12) show high mobility of Na,Ca,Mg,K,and Fe in almost all the rock units of Sonrai and Solda Formations.The linear trend of CaO and MgO with SiO2(Fig.11) is suggestive of leaching of Ca,Mg,Na,and Fe ions during chemical weathering of the clay minerals (Liu et al.2009).The high amount of Al,Fe,K,and Mg,but,low Na contents in weathered products of this area is indicative of enhanced chemical weathering as also suggested by Wei et al.(2004).High K2O/Na2O values (>2)found in case of Gorakalan shale and Rohini carbonate is related to periodic upliftment and intense weathering at the time of deposition of these rocks (Sharma and Rahman 2000).However,low K2O/Na2O values (0.01-2) associated with the Jamuni carbonate,Bandai sandstone,and Chloritic shale is related to periodic deepening or rifting of the basin (Engel et al.1974).
Most of the REE patterns are flattened and do not show intensive fractionation (Fig.10).Owing to the expandable nature of the clay structure,incorporation of a large amount of HREE without fractionation (Fig.10) is also possible.Cullers and Graf (1983) demonstrated that silicic rocks usually contain high LREE/HREE ratios ad negative Eu anomalies.Therefore,REE patterns of the source rocks are usually preserved in the sedimentary rocks (Taylor and Mclennan 1985; Wronkiewicz and Condie 1989).Although,flat REE patterns with negative Eu anomaly is inherited from the source rock,rich in quartz and silicic feldspar.Cuney (2010) demonstrated REE patterns of uraninite for individual grains from the Dominion reef,South Africa.Duhamel et al.(2009) studies from Elliott Lake show similar characteristics as those associated with the uraninite grains crystallized at high temperature from granite or anatectic pegmatite (such as Rossing,Namibia)includes:(1) almost 104 times more than the chondritic abundance for most of the REE resulted from their increased substitution into the uranium oxide crystals at high temperature compared to those crystallized at lower temperature (Bonhoure et al.2007).(2) Moderate global fractionation of the REE pattern,reflect a weaker crystalochemical control for REE incorporation relative to their ionic radii into the uraninite structure at high temperature compared to those crystallized at a lower temperature (as shown by comparing to the REE patterns of uranium oxides from unconformity-related deposits).(3) Strong and variable negative Eu anomaly reflects plagioclase fractionation in the magma from which they have been crystallized,similar to the Eu anomalies observed in the uraninite from Rossing and Finland pegmatoids.The phosphatic component is in the form of apatite varying form from microcrystalline to well crystallized coarser crystal aggregates comprised of cement,veins,and botroidal encrustations (Roy et al.2014).It is generally believed that the Ca is replaced by U,Th,Pb,Fe and REE ions within the apatite lattices and charge imbalance is adjusted through suitable anionic substitution.An important property of apatite is that it accommodates U ions.The mechanism is not completely understood,but most likely it is because of the incorporation of U4+in the apatite mineral structure that replaces Ca ions.The decaying organic material reduces the U6+to U4+,facilitating its incorporation into the apatite structure.More or less similar studies of Stevko et al.(2014) revealed that the fractures and interstitial spaces between fluorapatite crystals were filledup by younger crystals and aggregates.In context to REE geochemistry of phosphorites of the Sonrai area,where,normalized REE patterns show positive Eu anomalies are attributed to reducing conditions as also inferred earlier by Khan et al.(2012).Moreover,Post-Archean sediments show similar rare earth patterns and characterized by negative Eu anomalies of almost constant magnitude (relative to chondrites) and nearly constant LREE/HREE values (Nance and Taylor 1976).It occurs due to chemical fractionation of plagioclase feldspar in the continental crust(Taylor and McLennan 1985).Contrarily,continental Eu enriched crust indicates reducing environment eventually evolved in the upper continental crust.
Roy et al.(2004) reported U mineralization from carbonate and sandstones of the Sonrai Formation characterized by marginal Eu enrichment that also in the M4 sample of Solda Formation(Table 3).Overall high(0.35–0.98)La/Yb values are attributed to reducing environmental conditions.PAAS normalized elemental data plots show enrichment of large-ion lithophiles (LILs).Marginal enrichment is noticed in the case of Rb.But,Ba,U,and Th concentrations are as high as >4,>10 and >20 times higher than the crustal abundance (Table 4),suggest enrichment in TDB14,PDB6,and PDB14 specimens,respectively.Adsorption and high retention of U and Th ions are inferred during chemical weathering and diagenesis.Present data show concentrations >3 and >4 times higher than the crustal abundance of Pb and Ba,indicating enrichment in the mineralized Bandai sandstone (M7) and Rohni carbonate(TDB14)of the Sonrai Formation clays.It is explained by low mobility as well as retention of these elements on the tetrahedral as well as inter-layer sites of the smectite rich clays under reducing conditions (Balasubramaniam et al.1989).But,non-mineralized Gorakalan shale shows strong negative (for Rb and Sr) as well as positive (for Pb,Ni,and Zn) anomalies (Fig.2Sa).Concentrations~2,4,and 10 times higher than the crustal abundance of Pb,Ni,and Zn show their enrichment,respectively.Such enrichment of cation is accountable for positive anomalies,but,these anomalies are restricted to Gorakalan shale only.But,in general,both Sonrai and Solda Formations represent concentrations >4 and >10 times higher than the crustal abundance of Cu and Cr elements suggest enrichment,respectively (Fig.3S).Such high cationic concentrations are due to their occupancies in the octahedral sites of the illite and smectite structures.Moreover,retention of Cr within the matrix and primary structures of the alumino-silicates at the time of weathering is evidenced by positive Cr anomaly associated with a maximum number of litho-units of this area,although,Cu,Zn,and Pb ions released with ease are absorbed on to finegrained clays.In general,high Th,U,Sc,Cr,Ni,and V mobility in both the formations indicate acidic environmental conditions that existed during chemical weathering(Fig.2S).Both Th and U show positive anomalies for most of the Sonrai Formation clays(Fig.2Sa),but,Th depletion is observed in ST10 and PDB7 samples.REEs,Th,Pb,and Sc contents (Table 3) observed in these rocks is comparable to the crustal abundance(Mason and Moore 1982)as their distribution is least affected by the secondary processes such as diagenesis and metamorphism.Likewise,Zr,Hf,and Sc are also least affected by heavy mineral fractionation.Moreover,enrichment of Pb and Zn in the Sonrai Formation is indicative of anoxic conditions prevailed during deposition (Fig.3Sa),but,Pb,Mo,Cu and Zn enrichment found in these clays is due to sulfides and organic matter associated with the anoxygenic sediments(Taylor and McLennan 1985).High field-strength elements,such as Zr and Hf show negative correlation for Sonrai and Solda Formation rocks due to their low water solubility and physiochemically resistant to weathering and alteration(Fig.3S).However,GKT14(of Gorakalan shale)and M4 (of Chloritic shale) specimens represent concentration >3 times higher than the crustal abundance of Zr and Hf,indicating enrichment.Though,these elements were perhaps derived from the granitic basement source rocks.Significantly,Cr,V,and Ni show positive trends,whereas Co and Sc show negative trends for the Sonrai Formation clays,but Ni and Cr show negative correlation for the Solda Formation clays (Fig.3Sb).These elements not only reside in the clay fractions,but their abundance is also related to clay minerals (Condie 1992).High Ba values in the Rohini carbonate (samples TDB14 and TDB16)and Bandai sandstone (sample PDB7) indicate their adsorption onto clay particles during chemical weathering(Nesbitt and Young 1984).
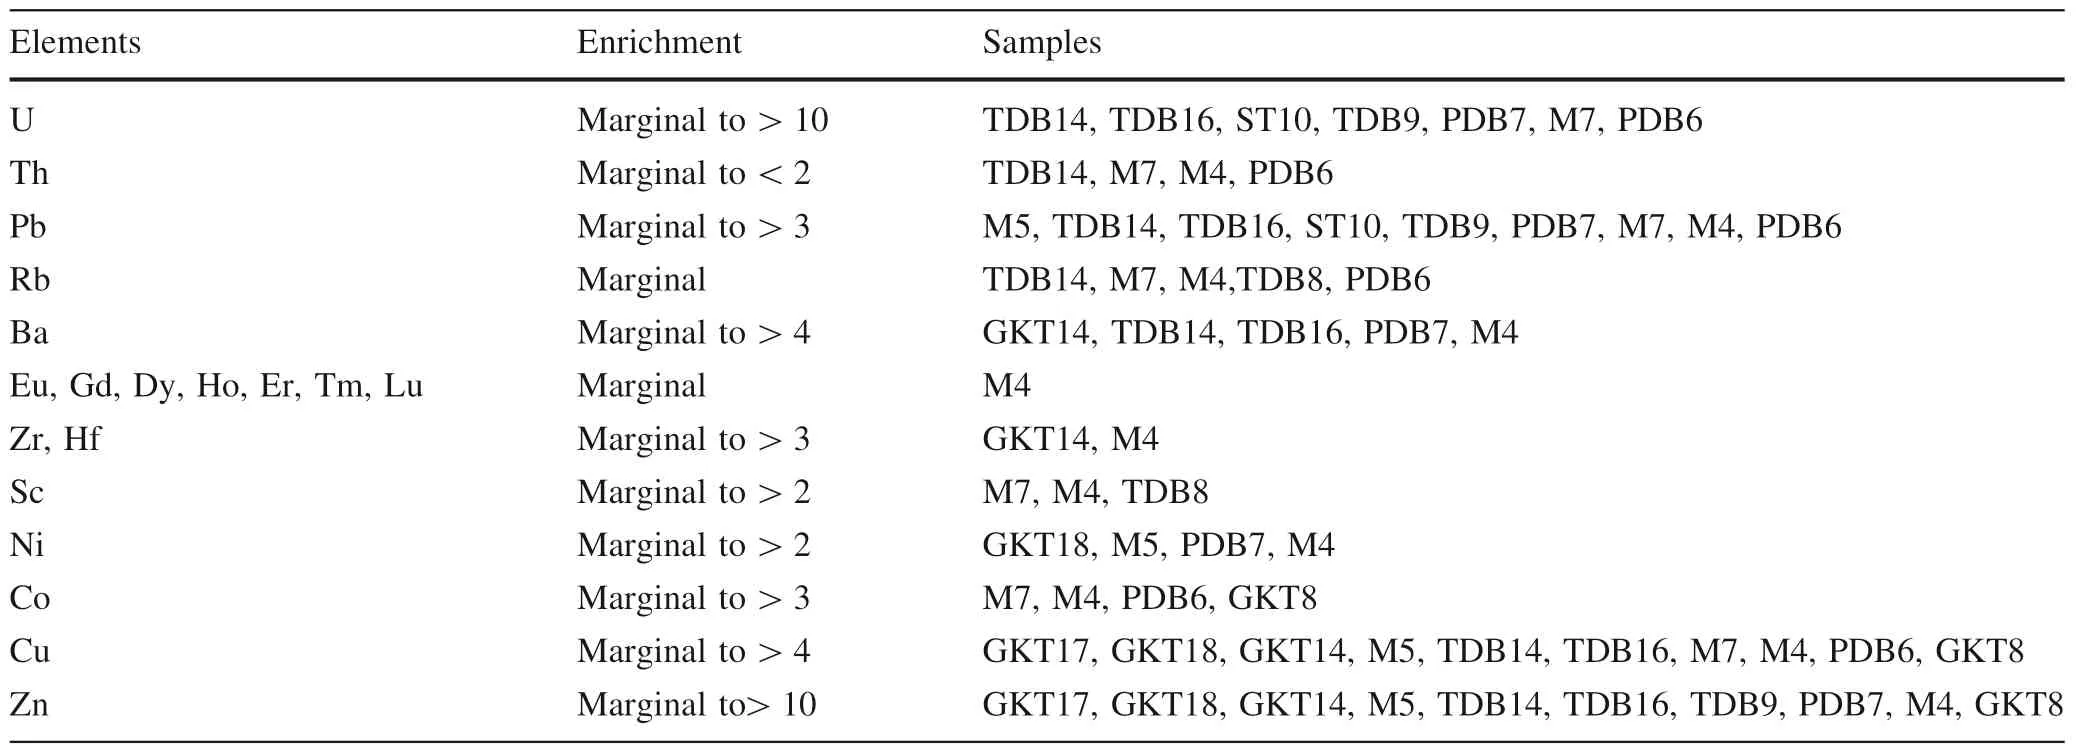
Table 4 Summarized trace element concentrations (in ppm) and their enrichment (number of times higher than the crustal abundance) in clay minerals associated with the Sonrai metasediments
Further,REE fractionation at the time of chemical precipitation of carbonate is controlled by fixation or supergene enrichment processes; therefore,clays represent high La/Yb values (Zhaoliang et al.2006).HREE enrichment and LREE depletion in Sonrai and Solda Formations show a high degree of fractionation.Due to high mobility,REE ions occur abundantly during hydrothermal alteration and chemical weathering (Fig.2S).Mobility,as well as fractionation of REE,is affected by the alteration processes(Nesbitt 1979).As illite,mica,and feldspars are susceptible to alteration; a significant change in the REE patterns is also observed.Rare earth elements were mobilized at the time of incipient and moderate stages of weathering.But,REE ions mobilization was not so during intense weathering.Thus,the former process is more responsible for the mobilization and fractionation of these elements.Fractionation of the REE in these clays is also related to selective leaching of the rocks which contain both stable and unstable minerals.REE ions released from the weathered minerals preferentially and subsequently concentrated to yield supergene enrichments(Middelburg et al.1986).Fayek and Kyser (1993) pointed out that U bearing minerals possess slightly low total REE contents;therefore,they were not substantially remobilized or fractionated at the time of the alteration.Owing to the fractionation,PAAS normalized REE patterns reflect HREE enrichment and LREE depletion (Fig.9).To some extent,REE fractionation is also responsible for the shrinking of U oxide structure by crystallization of co-genetic LREE-rich minerals (Gaboreau et al.2007).Consequently,total REE content decreases and departure is observed in LREE and HREE patterns.It is due to crystallographic control of the mineral structure,thus,display preferential incorporation of HREE having similar ionic radii to U4+,thus,forms HREE enriched patterns as centered from Tb to Er(Fig.9).PAAS normalized REE patterns of the Rohini carbonate and Bandai sandstone units of the Sonrai Formation(Fig.9) form asymmetrically HREE enriched patterns.Incidentally,they show a close resemblance to the REE patterns of the McArthur River,Cigar Lake,and Sue Unconformity Type U deposits,Canada (Mercadier et al.2011).Hydrothermally altered illite and chlorite with a high amount of total REE contents(Table 3)are associated with the mineralized Rohini carbonate,Bandai sandstone,and Chloritic shale of the Sonrai basin (Jha et al.2012).Thus,high total REE content of the alteration halos is because of the high amount of clays.High HREE content in the bulk composition of these rocks and the high proportion of HREE enriched clays are mutually interrelated.Additionally,weak Ce anomaly suggested high rock-fluid interaction and low fractionation during diagenesis under oxic conditions(German and Elderfield 1990).Oxidization of V forms soluble V6+under oxic conditions and reduced to V4+and form insoluble VO(OH)2under mildly reducing conditions (Wanty and Goldhaber 1992).Some other redox-sensitive elements such as Co and Cr behaved in a similar manner under oxidizing conditions (Algeo and Maynard 2004).Proportionality of V/Ni is mainly expressed by V/(V+Ni) and is commonly used to find out Eh and pH in the depositional environment (Lewan and Maynard 1982;Madhavaraju and Lee 2009).Low(<0.46)V/(V+Ni)values in most of the samples pointing towards oxic conditions.Whereas,a few of the values ranging from 0.60 to 0.63 (Table 3) indicate that these sediments were deposited under dioxic conditions.Thus,V is enriched under anoxic conditions (Cao et al.2012).Clay associated with the Sonrai basin represent (low <2) V/Cr values,indicating an oxic depositional environment (Kuscu et al.2016).Comparing to other rocks of this area,Rohini carbonate,Bandai sandstone,and Chloritic shale show high U and Th abundance(Table 3)and also a high degree of REE substitution within their clay complexes.As a result,high total REE and LREE/HREE values found in the clay complexes of the Rohini carbonate,Bandai sandstone of the Sonrai Formation and Chloritic shale,reflect hydrothermal alterations (illitization,chloritization,and carbonatization),perhaps related to Kurrat volcanic activity(Jha et al.2012).Although,it is quite common that REE patterns normalized to chondrite (Fig.10) and to PAAS(Figs.8,9) and show mutually contrasting patterns (Rene 2008) as former is affected by the extent of tetrad effect(Masuda et al.1987).Owing to REE mobility variations in F,P,and CO2enriched hydrothermal fluids,chondritenormalized REE patterns show consecutive curved (La–Ce–Pr–Nd; Pm–Sm–Eu–Gd; Gd–Tb–Dy–Ho; and Er–Tm–Yb–Lu) tetrads (Rene 2008) which are either convex or concave,form M-and W shape patterns,respectively(Masuda et al.1987).Takahashi et al.(2002)also reported similar patterns from the rock-water system of the U ore deposits.Hydrothermally altered Rohini carbonate(sample ST10) shows M-shaped Gd–Tb–Dy–Ho tetrad effect(Figs.8b and 10b),analogous to that reported from theMoldanubian U deposits (Rene 2008).Lanthanide tetrad effect accompanied by anomalous behavior of Y,Zr,Hf,and other immobile elements is suggestive of significant change in their mobility during alternate oxidation and reduction processes(occurred in the hydrothermally altered carbonate)which led to the precipitation of disseminated U ores (Rene 2008).Such mineralization is associated with the clay minerals and found within or along with the fractures of the Rohini carbonate and Bandai sandstone.Mineralized Rohini carbonate,Bandai sandstone and Chloritic shale (Table 3) represent high Zr and Y mobility with respect to HREE.As a result,Y and Zr rich U ore complexes were formed.High Zr and low Y values are also found in the graphitic Gorakalan shale which is due to unpredictable high Zr mobility during weathering and deposition of the granitic basement (U source rock);however,it was least affected by hydrothermal activity.Positive Eu anomaly (Fig.8) associated with the Sonrai Formation is explained by the presence of reducing conditions at the time of precipitation of U ions (Mercadier et al.2011).Abundant sulfide minerals associated with the Rohini carbonate and Bandai sandstone pointing towards reducing conditions.Crystallographic control over mineral composition is influenced by hydrothermal process.In the vein-type U oxides and roll-front type U deposits,rare earth elements are highly fractionated.Obtained La/Sc,La/Co,Th/Sc,Th/Co and Th/Cr values for the clays associated with the Bijawar rocks when compared to felsic and mafic rocks as well as to upper continental crustal (UCC) and PASS values (Table 5) show comparable values to that of the intermediate to felsic source rocks.Most of the U and REE enriched clays in this area are pointing towards their derivation from the fertile Bundelkhand K-feldsphathic granitoid source under oxidizing conditions.Thus,trace elements incorporated in clay minerals signify changes in the physicochemical constraints (such as temperature and composition of the mineralizing fluids)at the time of U ore deposition.

Table 5 Range of elemental ratios for Sonrai and Solda metasediments when compared to the trace elemental ratios in similar fractions derived from mafic and felsic rocks,upper continental crust,and Post-Archean Australian Shale
Trace elemental abundance in clay minerals largely depends upon cation interaction with existing crystal structures,ionic radii,electronegativity and crystal field stabilization energy especially in case of transition elements (Rollinson 1993).Thus,clay crystal chemistry is complex with cationic and anionic substitutions being common due to mixed-layer architecture in which two or more mineral structures occur randomly.As diagenesis progresses,the cationic substitution increases in the tetrahedral and octahedral sites that causes changes in the interlayer charges (Nadeau and Bain 1986).Incidentally,Mg and Mg–Fe rich chlorites show close similarity to the diagenetic as well as hydrothermal chlorites (sudoite) of the Jabiluka U deposit,Australia.Few chlorites with low Si(<3) and high Fe contents (>0.2) represent low-grade metamorphic effects (Fig.7).These chlorites are comparable to the chlorite spherules and metamorphic chlorites of the Alligator River U deposits,Australia (Beaufort et al.2005) and resulted from existing geothermal conditions.Thus,suggesting that the alteration is accountable for the remobilization of U ions.
6 Conclusion
Mineralized Rohini carbonate shows moderate rainfall and reducing conditions,favorable for a high degree of U substitution in the clay lattices.Mineralogical studies together with field evidence revealed that the intense chloritization and illitization were associated with the alteration halos,resulted from progressive fluid-rock interaction processes within the network of active faults and fractures on both sides of the unconformity between the Sonrai metasediments and the metamorphic basement rocks.Low Fe/(Fe+Mg) values obtained for clay-size chlorite suggested that the Mg-rich fluids were available throughout the process of chloritization.Major oxide data show high mobility of Na,Ca,Mg,and K ions which led to Fe and Ti ionic enrichment during chemical weathering of clay minerals.High K2O/Al2O3and MgO/Al2O3values for the Rohini carbonate and Chloritic shale show intense illitization due to hydrothermal alteration.
PAAS normalized trace elements data plots show U,Th,Rb,Ba,and Sr enrichment,whereas,Bandai sandstone and Rohini carbonate clays show HREE enrichment with asymmetrical patterns,akin to those reported from the well-established McArthur River,Cigar Lake and Sue UTUD of Canada.Chondrite-normalized REE plots form four convex M/W shape consecutive curved tetrads (La-Ce–Pr–Nd,Pm–Sm–Eu–Gd,Gd–Tb–Dy–Ho,and Er–Tm–Yb–Lu) and show evidence of strong water–rock interaction.Hydrothermally altered Rohini carbonate REE data plots show M shape Gd–Tb–Dy–Ho tetrads and anomalous high Y,Z,and Hf contents together with the negative Eu anomalies (associated with the highly altered clays) is suggestive of anoxic conditions.Due to the incorporation of HREE (without fractionation) in the clay interlayer spaces,REE data plots show linear and flattened trends.High U and Th abundances and total high REE content associated with the altered clay minerals of the mineralized Rohini carbonate,Bandai sandstone,and Chloritic shale are related to a high degree of REE substitution within their clay complexes.Moreover,weak Ce anomalies suggest high rock-fluid interaction and low fractionation during diagenesis under oxic conditions.REE and U enrichment in clays indicate derivation of a significant amount of U ions from fertile Bundelkhand granitoid source under oxidizing conditions.
AcknowledgementsJPS acknowledges Delhi University for financial support towards this work in the form of R&D Project Grant(No.DRCH/R&D/2012-2013/4155).
- Acta Geochimica的其它文章
- Even-carbon predominance of Monomethyl branched alkanes in Humic coal from Junggar Basin,NW China
- Hyperspectral estimation model of soil Pb content and its applicability in different soil types
- Geochemical constraints on the origin and tectonic setting of the serpentinized peridotites from the Paleoproterozoic Nyong series,Eseka area,SW Cameroon
- Zircon saturation model in silicate melts:a review and update
- A re-assessment of nickel-doping method in iron isotope analysis on rock samples using multi-collector inductively coupled plasma mass spectrometry
- Geochemical characteristics and origin of the Neoproterozoic high-K calc-alkaline granitoids in the northern part of Mandara hills,northeastern Nigeria

