Al3+荧光增敏快速检测酸奶和乳酸菌饮料中的胭脂虫红酸
2020-02-10 15:36:32刘兰香伊冠东马金菊孙彦琳
食品科学 2020年2期
刘兰香,伊冠东,,李 凯,马金菊,徐 涓,孙彦琳,张 弘,
(1.中国林业科学研究院资源昆虫研究所,云南 昆明 650224;2.昆明理工大学化学工程学院,云南 昆明 650500)
Cochineal dye, as one of the most well-known quality red dyes, is increasingly popular as consumers began demanding more “natural” colors[1-3].It is widely used in food, cosmetics, and pharmaceutical industries and art objects (textiles and paintings) as well[4-5]. Cochineal dye can be obtained from the dried bodies of females of Dactylopius coccus Costa insect species[3,6]. Carminic acid (CA) is identified as a major component of the cochineal, which is a large glucose unit attached by an anthraquinone[3,7](Fig. 1). Although CA is harmless and even healthy, its dosage is limited for industrial and non-industrial applications. For instance, in China, the CA content must not exceed 0.05 and 0.025 g/kg in fermented milk and drinks, respectively. Therefore, determination of trace level of CA is particularly significant.
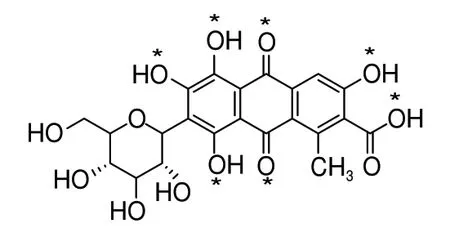
Fig. 1 Chemical structure of CA
High performance liquid chromatography (HPLC) is the most widely used technique for the determination of CA[6,8]. Capillary electrophoresis (CE)[9]and electrochemical techniques have been applied to detect CA as well, However, spectral methods were slightly employed. Only spectroscopic techniques (such as Raman spectroscopy) have been reported, while the majority of these methods suffer from lowersensitivity, poorer specificity, or complicated process[10-12]. Fluorescent spectroscopy is a powerful technique used to study the reactivity of chemical and biological systems because of its high-sensitivity, quickness, and simplicity[13-16]. CA has been confirmed to emit fluorescence, and the fluorescent properties have not been fully studied not since several years ago[17-20], however, currently few researches have been reported. On the other hand, the study of CA’s recognition of metal ions has not been reported[19,21]. In the present study, fluorescence and absorption spectroscopic of CA were fully investigated, including the influence of solvent, concentration, pH, and metal ions on the optical properties of CA. In addition, an association between CA and Al3+was assessed as well. The results achieved from this study would be precious to explore fast and effective methods for detection of CA.
1 Materials and Methods
1.1 Materials and reagents
The coloring material was extracted with ethanol-water (4:3, V/V) from cochineal insects, which were independently cultivated by Research Institute of Resources Insects, Chinese Academy of Forestry (Kunming, Yunnan province, China). CA (≥ 95%) was further purified and obtained by gradient elution chromatography with solution A (water + 2.5% formic acid) and solution B (methanol + 2.5% formic acid) from the coloring material. All other reagents and solvents were purchased from commercial suppliers and used without further purification. The yogurts (Yili and Ouya) and lactobacillus beverages (Yili) were purchased from local super market in Kunming. Deionized water was used throughout all the experiments as well.
1.2 Instruments and equipment
Echcomp F-4600 fluorescence spectrometer was purchased from Tianmei Corporation (Shanghai, China) with excitation slit set at 5 nm, emission slit set at 5 nm, scan speed set at 12 000 nm/min. The photomultiplier voltage of was 950 V unless specially noted and the wavelength of excitation for the fluorescence studies was fixed at 400 nm. The system was excited during the entire study at the same wavelength to study the emission spectra; Agilent Cary 60 UV-Vis Spectrophotometer was purchased from Agilent Technologies, USA (The vi sible absorption maximum of the CA in water was at 492 nm); TESTO 206-pH1 pH meter was purchased from Detu Instrument (Shenzhen) Co. Ltd., China.
1.3 Methods
1.3.1 Preparation of CA solution
Stock solution of CA at A 4.0 × 10⁻³mol/L was prepared by dissolving CA in water and adjusting the volume to 500 mL in a volumetric flask. The stock solution was further diluted to 2.0 × 10⁻³–6.0 × 10⁻⁶mol/L stepwise.
1.3.2 Preparation of solution with different pH values
Herein, 1.0 mol/L stock solution of HCl and 1.0 mol/L stock solution of NaOH were prepared, respectively. Then, stock solution was diluted step by step to get the solutions with pH of 1–13, and pH values of the solution were corrected by a pH meter. 2.5 mg CA was dissolved in the above solutions with different pH value (25 mL) and prepared into a CA solution with a concentration of 2.0 × 10⁻⁴mol/L.
1.3.3 Metal ion sensing
A standard stock solution of metal ion (0.1 mol/L) was prepared by dissolving an appropriate amount of chloride (except for silver nitrate) in buffer solution (pH 4) and adjusting the volume to 100 mL in a volumetric flask. This was further diluted to 1.0 × 10⁻³mol/L and the solution of aluminum chloride was diluted to 8.0 × 10⁻²- 1.0 × 10⁻⁶mol/L stepwise. The mixture solution of metal ions was prepared by adding 5.0 mL of CA (2.0 × 10⁻⁴mol/L) and 1.0 mL of the solution of metal ions was mixed well and maintained for 15 min. Blank solution of CA was prepared under the same conditions without metal ion.
1.3.4 Competitive experiment
In a competitive experiment, the standard solution was prepared by mixing 5.0 mL of CA (2.0 × 10⁻⁴mol/L), 1.0 mL of the solution of AlCl3(1.0 × 10⁻³mol/L), and 1.0 mL of the solution of other metal ions (Na+, K+, Ca2+, Zn2+, Cd2+, Co2+, Ag+, Cr3+, Ba2+, Mn2+, Ni2+, Cu2+, Pb2+, Hg2+, Al3+and Fe3+). Then the mixtures were detected.
1.3.5 Reversibility of CA
CA solution at a concentration of 2.0 × 10⁻⁴mol/L, AlCl3solution at a concentration of 1.0 × 10⁻²mol/L, and EDTA solution at a concentration of 4.0 × 10⁻⁴mol/L were prepared, respectively. The detected solution A was prepared by mixing 5.0 mL of CA and 1.0 mL AlCl3; detected solution B was prepared by mixing detected solution A and 2.0 mL of ethylenediaminetetraacetic acid (EDTA); detected solution C was prepared by mixing detected solution B and 1.0 mL of AlCl3.
1.3.6 Stability test
The mixed solution of CA-Al3+was prepared by mixing 5.0 mL of CA (2.0 × 10⁻⁴mol/L) with 1.0 mL of the solution of AlCl3(2.0 × 10⁻³mol/L). Then, CA solution at a concentration of 2.0 × 10⁻⁴mol/L and the mixed solution of CA-Al3+were detected on the Echcomp F-4600, respectively.
1.3.7 Working curve
Standard solution of AlCl3(2.0 × 10⁻³mol/L) and standard stock solutions of CA (4.0 × 10⁻³mol/L) were prepared and then further diluted to 1.0 × 10⁻⁵–8.0 × 10⁻⁵mol/L. Detection of CA was performed by mixing 5.0 ml of CA and 5.0 mL of Al3+. The working curve was drawn with the CA concentration as the horizontal coordinate and the fluorescence intensity of the mixed solution as the vertical coordinate. The limit of detection (LOD) was tested by taking the standard deviation of the blank value by 3 times.
1.3.8 Experiment of application
A certain amount of CA was added to different yogurts and lactobacillus beverages, and then they were all diluted with a buffer solution (pH 4) to a suitable concentration for use as samples to be tested. The detection of samples was performed by mixing 5.0 mL of the sample and 5.0 mL of Al3+.
1.4 Statistical analyses
All the experimental data were processed in parallel for 3 times, and the results were expressed as ± s. The data were analyzed by SPSS statistical software (SPSS Statistics 17.0) for one-way ANOVA.
2 Results and Analysis
2.1 Effect of solvents
CA was insoluble in solvents, such as n-alkanes, cycloalkanes, chloroform, carbon tetrachloride, etc., however, it was soluble in water and some of organic polar solvents. The effects of eight solvents were examined at ambient temperature and photomultiplier voltage was 700 V. As shown in Fig. 2A and Table 1, the fluorescent intensity for CA in different solvents followed this order: water < dimethylformamide (DMF) < dimethyl sulfoxide (DMSO) < methanol < ethanol ≈ 1-butanol < acetone ≈ butanone and CA emitted orange fluorescence in these solvents. This finding leads to a conclusion that the chemical nature and dielectric constant of the solvent may play an important role in the spectral behavior of CA molecule[22-24]. The structure of solvents is divided into protic (water, methanol, ethanol, and 1-butanol) and aprotic (acetone, butanone, DMF, and DMSO). There is an O-H bond that can be used as a hydrogen bond in the molecule of a protic solvent, while there is no hydrogen bond in the molecule of an aprotic solvent.

Fig. 2 Fluorescence (A) and absorption spectra of CA (2.0 × 10⁻⁴ mol/L) (B) in different solvents
In water, the fluorescence of CA was weak, the emission was broad and structure was weak (the maximum emission wavelength (λem) was at 595 nm), and had little spectral overlap with the absorption (the maximum absorption wavelength (λabs) was at 492 nm). In alcohol, the fluorescence of CA was significantly increased and the λemwas shifted to shorter wavelengths (about 583 nm and with a shoulder at about 620 nm) (Fig. 2A). Besides, the absorption spectrum showed two peaks at about 497 nm and 530 nm in alcohol (Fig. 2B). It has been suggested that dimerization or polymerization should be considered as hydrophobic interaction between CA molecule and the solvent[19,23]. It was expected that the -OH group available in water or alcohol could promote CA aggregation, while the process of polymerization (formation of H-aggregates) can be hindered with the decrease of dielectric constant of solvent. After the aggregation, the changes of energy difference between the ground state and the excited state led to the changes in fluorescence intensity and the λem. Water was the most polar solvent among the eight solvents used in this study, hydrophilic interaction of CA molecules was strong enough to promote CA deeper aggregation[24], thus the fluorescence intensity of CA was minimum in water.

Table 1 Effect of solvents on fluorescence intensity of CA (25 ℃)
Furthermore, in an aprotic solvent, there was only one peak in the fluorescence spectra (Fig. 2A), while two peaks were found in the absorption spectra (Fig. 2B), indicating that there were at least two different substances in the solvent system[25]. The possible explanation was that π→π*transition occurred when CA was excited, and the double bond (C=O or S=O) of molecules of solvent had a greater stabilizing effect on the excited-state than on the ground-state[26-27]. However, this stabilizing effect was weakened by the lone pair of the N atoms of DMF and the S atoms of DMSO as electron donor, which led to shifting the λemand λabsto higher levels. Therefore, comparison to DMF or DMSO, the CA showed stronger fluorescence intensity in ketone solvents.
The above results suggested that the CA can emit different intensities of fluorescence in different solvents, and the specific solvent can be selected according to the needs.
2.2 Effect of concentrations
Fluorescent intensity of CA increased and the λemwas shifted to lower levels (from 602 to 595 nm) with the increase in its concentration from 2.0 × 10⁻⁶to 2.0 × 10⁻⁴mol/L (Fig. 3A). However, the fluorescent intensity reduced and the λemwas shifted to higher levels (from 595 to 620 nm) as the concentration continued to increase (from 2.0 × 10⁻⁴mol/L to 4.0 × 10⁻³mol/L)(Fig. 3B). Optical images showed that the color of the solution of CA changed from yellow to orange, and to red with the increase of concentration of CA under natural light (inset in Fig. 3A). The fluorescent image showed that CA emitted mauve fluorescence in low concentration, and it turned to orange when CA concentration was 2.0 × 10⁻⁴mol/L, and then turned red (1.0 × 10⁻³mol/L) and finally disappeared as the CA concentration was 4.0 × 10⁻³mol/L (inset in Fig. 3B). This might be due to the molecular stacking of CA at the low concentration, in which the anthraquinone moieties were held by hydrophobic interaction, and gathered to form dimers or polymer that may contribute to enhance fluorescence. However, when the concentration of CA increased to a certain degree, the probability of deactivation of excited molecule was increased by a collision between excited-state molecule and ground-state molecule, causing the self-absorption of energy of fluorescent molecules. Consequently, the fluorescence was reduced or even quenched[19-20].
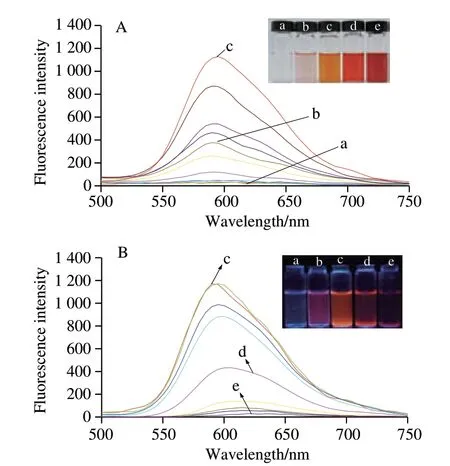
Fig. 3 Fluorescence spectra. Optical images of different concentrations of CA under natural light (inset in A) and UV light (inset in B) with wave length of 365 nm
2.3 Effect of pH values
As shown in Fig. 4, the fluorescence intensity of CA increased with increasing value of pH when pH ≤ 4, with the strongest fluorescence in solutions with pH 4. Whereas the fluorescence intensity was declined when pH > 4 and was almost completely quenched as PH ranged from 8 to 10. Surprisingly, the fluorescence intensity of CA was significantly increased as the pH > 10 with sodium hydroxide adding.

Fig. 4 Effect of pH on fluorescence intensity
The fluorescence spectrum showed that the λemof CA was at about 590 nm (red fluorescence) when pH ≤ 4, but it was shifted to about 630 nm (violet fluorescence) in condition of pH ≥ 7 (Fig. 5). The change of the emission indicated that the charge transfer of the fluorescent chromophore in the CA molecule may have shifted.
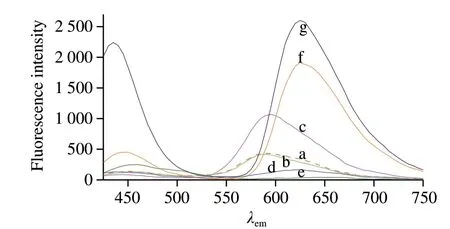
Fig. 5 Fluorescence spectra of CA in a solution at different pH
In order to explore why pH affected the fluorescence intensity of CA, the UV-vis spectrum was measured. There was an absorption at about 492 nm in solutions with pH ≤ 4, but the λabsshifted to 530 nm with a shoulder at about 580 nm as the solutions of 7 ≤ pH ≤ 10 and there was only a peak at 580 nm as CA with 1.0 mol/L sodium hydroxide (Fig. 6).
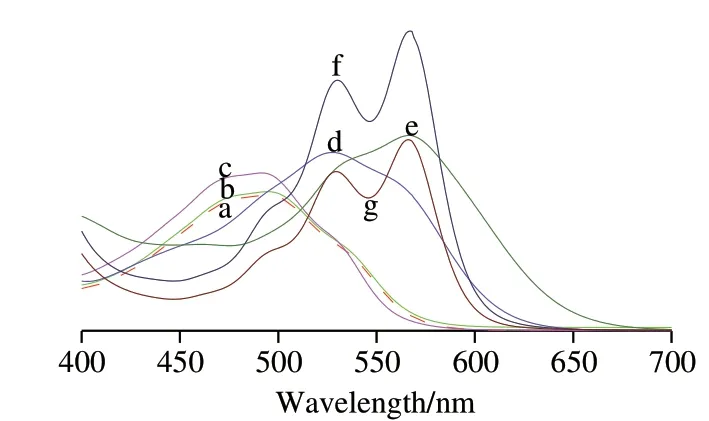
Fig. 6 Absorption spectra of CA in a solution at different pH
This change in optical performance of CA with pH may be related to the form of CA in solution with different pH values (Fig. 7). Furthermore, the energy of the ground state and the excited state of CA in different forms was different, so their photoluminescence properties were changed. CA was a tribasic acid[19,21]in water and its pH value was about 3.9 as its concentration was 2 × 10⁻⁴mol/L. There were more free H+ions in an acidic solution (pH < 4), the ionization of the carboxyl group of CA was inhibited, and we speculated that the ion CA-1 was generated in a solution with pH ≤ 1[28]. Moreover, it was corresponding to a maximum concentration of the H2L-form of CA with the carboxyl group deprotonated and with the phenols non-dissociated CA-2 in a solution with pH 4[19]. Then, the hydroxyl group which was attached to anthraquinone gradually disassociated as the pH of the solution continued to increase, and carboxyl group and hydroxyl group were fully ionized CA-3 in a solution with pH 10[19,29]. However, the negative ion form of CA could be oxidized to an excited-state CA-4 by the dissolved oxygen as an oxidant in the solution of NaOH with high concentration, thereby emitting the chemical luminescence with the λemat 425 nm[29-30].

Fig. 7 Possible forms of CA in solutions at different pH
2.4 Selectivity of CA to metal ions
The selectivity of CA to metal ions was investigated in different solvents. The results showed that CA had a particular choice of Al3+(fluorescence intensity of CA increased dramatically) in any solvent examined. Furthermore, these metal ions (Na+, K+, Ca2+, Zn2+, Cd2+, Co2+, Ag+, Cr3+, Ba2+, Mn2+, Ni2+, and Hg2+) had a little effect on the fluorescence of CA in any solvents, in which that influence was decreased by adding Pb2+in organic solvents, while Cu2+and Fe3+showed fluorescence quenching. In order to minimize the interference of other ions, water was more suitable as a solvent for CA (Fig. 8).
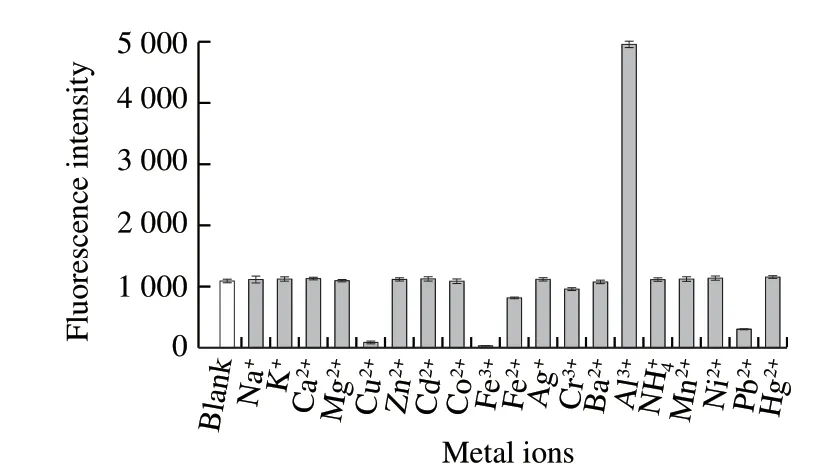
Fig. 8 Fluorescence intensity responses of CA to metal ions in aqueous solution
In general, Cu2+, Fe3+and Al3+have high affinity for phenols, and they formed a complex with CA, respectively. However, due to their different features regarding atomic radius, charge and electron configuration of Cu2+, Fe3+and Al3+, the effects of their complexes on fluorescence and visible absorption were different[31-34]. There were a number of insoluble substances in the solution after adding Cu2+or Fe3+, it indicated that CA was precipitated so the fluorescence of the solution disappeared. However, different from Cu2+or Fe3+, when the same amount of Pb2+was added to the solution, the fluorescence was weaker due to the electron transfer that may occur during the process of forming complexes between CA and Pb2+.
The Al3+was the only ion that significantly enhanced the fluorescence of CA in all ions examined, thus the relationship between Al3+and fluorescence intensity of CA was further studied in water. As shown in Fig. 9A, fluorescence intensity of CA was increased and the λemwas shifted to a higher level (from 595 nm to 614 nm) as the concentration of Al3+increased. This might be attributed to a fact that the free ligand and the complex both contributed to the fluorescence of solution. In addition, the binding of Al3+to CA may realize the identification of the hydroxyl groups attached to anthraquinone, which was important for non-radioactive deactivation of excited-states of CA[33,35].
To rationalize the above-mentioned observations, the absorption spectra were resolved using the principal component analysis. It was different from the monotonic change of fluorescence intensity with concentration, and there were two changes in the absorption spectrum (Fig. 9B). There was one peak on the absorption spectra when the concentration of Al3+in the solution ranged from 0 to 1.0 × 10⁻³mol/L, and the maximum absorption wave length shifted from 492 to 514 nm. However, it could be fitted to a sum of two Gaussians with peaks at 517 and 546 nm for concentration of Al3+to be greater than 2.0 × 10⁻³mol/L, suggesting that the complexes formed by both of them exist in addition to 1:1 complexes.
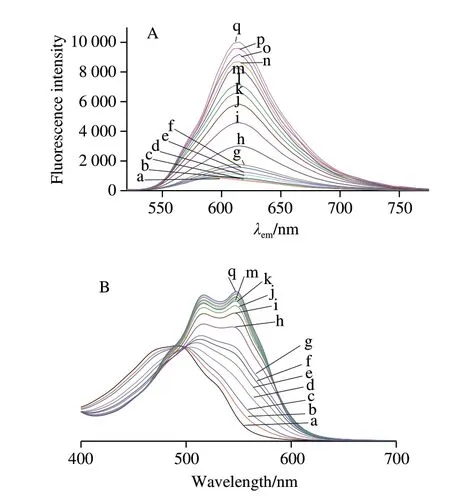
Fig. 9 Fluorescence (A) and absorption spectra (B) of CA in the presence of Al3+
It was widely accepted that the stoichiometry of Al (CA) complex was 1:1, as measured by the method of continuous variations (Job’s method)[17,19]. This method only investigated a possibility that Al and CA formed complexes at low concentration. However, there were multiple binding sites on the structure of CA (*mark in Fig. 1), which could form Al-CA ligands[33,36]. Therefore, according to the changes of fluorescence spectra and absorption spectra, it was speculated that there might be other kinds of complexes except for the 1:1 formed between CA and Al when the molar ratio (nAl: nCA) continuously increased[33,35-36]. The most likely complexes are shown in Fig. 10.
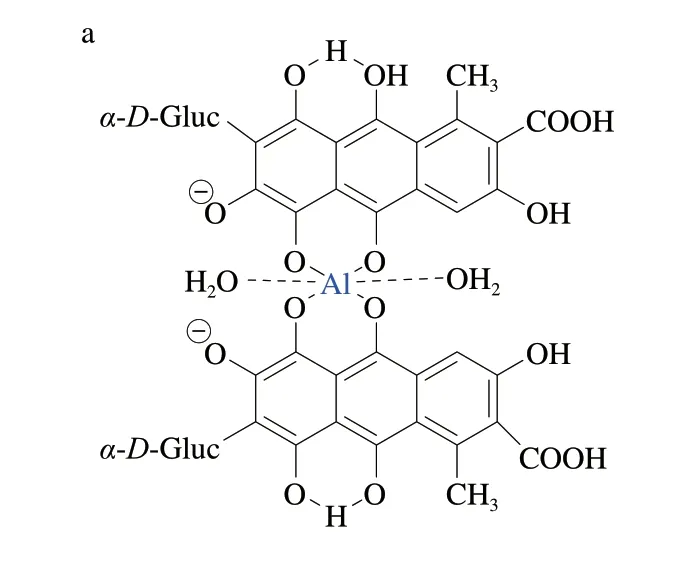

Fig. 10 Possible structural formulas of aluminum complex of CA
2.5 Competition of Al3+ and other metal ions
In order to further investigate the potential of competing species coexisting in the sample, the influence of other metal ions on fluorescence intensity of CA with Al3+was tested. The results demonstrated that only Fe3+showed fluorescence quenching and Cu2+and Pb2+had a little interfering effect on Al3+(Fig. 11). It can be clearly indicated that CA exhibits high selectivity to Al3+over other competing metal ions. Therefore, CA can be used as a fluorescent probe to detect Al3+.

Fig. 11 Fluorescence intensity response of CA-Al3+ to mixture of other metal ions
2.6 Reversibility of CA
In order to verify the coordination of CA and Al3+, the experiment of reusability of CA was measured. As illustrated in Fig. 12, the fluorescence intensity of a solution containing CA and Al3+was decreased with the introduction of EDTA, and when more Al3+was added to the system, the fluorescence intensities were recovered. The experimental results indicated that CA could be easily regenerated for repeated applications[36].

a. CA; b. CA + Al3+; c. CA+ Al3+ + EDTA; d. CA + Al3++ EDTA + Al3+.
2.7 Stability
The test results of fluorescence intensity change with time showed that the fluorescence intensity of CA and the mixed solution of CA-Al3+were almost constant for 9 000 s (Fig. 13). This revealed that CA and CA-Al3+could maintain appropriate fluorescent stability under certain wave length as the result of long-time exposure.

Fig. 13 Stability of CA (a) and CA-Al3+ (b)
2.8 Results of application
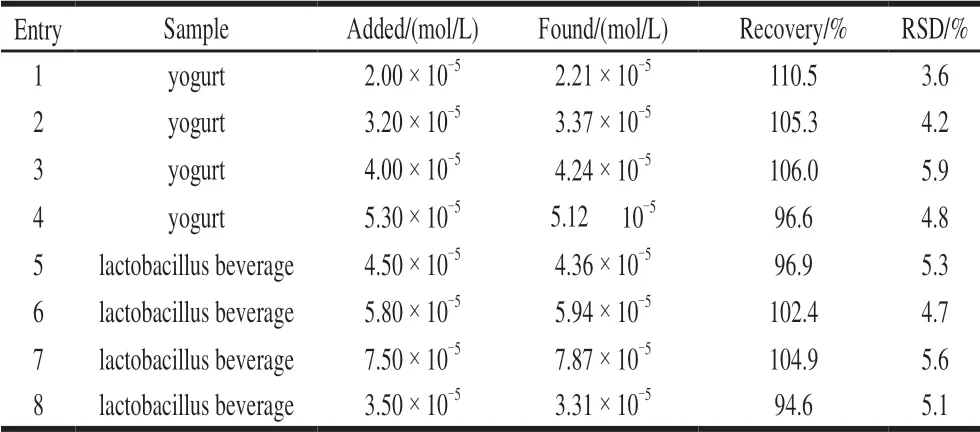
Table 2 Results of preliminary application (n= 3)
Since the fluorescence intensity of CA combined with Al3+was significantly enhanced to improve the sensitivity of detection, it is possible to detect the CA content in samples by using Al3+as a standard solution. Al3+(2.0 × 10⁻³mol/L) was used as the standard solution, the calibration graphs showed that there was a linear relationship between the fluorescence intensity of CA at 595 nm and its concentrations in the range of 1.0 × 10⁻⁵–8.0 × 10⁻⁵mol/L, the regression equation was y = 504.9x - 262.6, the coefficient of determination R2= 0.997 5, and the limit of detection (LOD) was 5.0 × 10⁻⁶mol/L.
As shown in Table 2, the results indicated that the concentration of CA in the samples were satisfactory with appropriate recovery ranged from 96.6% to 110.5%, and the relative standard deviation (RSD) ≤ 5.9%. The findings suggested that CA in yogurt and lactobacillus beverages could be quantitatively detected by fluorescence method.
At present, the common detection methods of CA are HPLC and UV-Vis. It is high precision and low detection limit, but the sample preparation is cumbersome, timeconsuming, and requires professional technicians to operate, and high cost by the HPLC method[37-39]. The UV-Vis method is inexpensive and easy to operate but highly interfered by impurities, low accuracy, and high detection limit. Compared with these two methods, the fluorescence method developed in this study has the characteristics of simple and rapid operation, low detection limit, and simple sample preparation. The method has practical application value.
3 Conclusion
In summary, the fluorescence of CA was the weakest in water and the strongest in butanone. Meanwhile, CA exhibited pH-sensitive and the CA fluorescence was the strongest in an aqueous solution with pH 4 and its concentration was 2.0 × 10⁻⁴mol/L. The results of selectivity of CA to metal ions indicated that the addition of Al3+could significantly enhance the fluorescence intensity of CA so that AlCl3(2.0 × 10⁻³mol/L) could be used as a standard solution to detect CA in the range of 1.0 × 10⁻⁵–8.0 × 10⁻⁵mol/L, the LOD was 5.0 × 10⁻⁶mol/L. The results of practical application suggested that CA in yogurt and lactobacillus beverages could be quantitatively detected with appropriate recovery ranged from 96.6% to 110.5%, and the relative standard RSD ≤ 5.9% by fluorescence spectroscopy method. This study provided an effective approach to rapidly and effectively detect CA.
猜你喜欢
中国机械工程(2022年18期)2022-10-08 03:33:40
云南画报(2022年3期)2022-04-19 11:16:00
古今农业(2021年3期)2021-11-20 06:03:58
民族音乐(2019年2期)2019-12-10 13:14:55
绿色中国(2019年17期)2019-11-26 07:04:42
中国机械工程(2019年19期)2019-10-28 02:35:28
中国机械工程(2019年11期)2019-06-13 13:07:22
中国机械工程(2019年4期)2019-03-06 05:21:06
中国(韩文)(2018年6期)2018-06-25 07:10:44
中国林业经济(2017年3期)2017-07-18 12:03:33