Effect of El Niño Southern Oscillations on the incidence of enteric fever in Ahmedabad, India from 1985 to 2017
Veena Iyer, Susanna Abraham Cottagiri, Ayushi Sharma, Divya Nair, Mehul S. Raval,Bhavin Solanki, Dileep Mavalankar
1Indian Institute of Public Health Gandhinagar, Opposite Air Force HQ, Near Lekavada Bus Stop, CRPF P.O., Gandhinagar 382042, Gujarat, India
2ICT Department, School of Technology, Pandit Deendayal Petroleum University, Gandhinagar, India
3Medical Officer of Health, Ahmedabad Municipal Corporation, Ahmedabad, Gujarat, India
Keywords:Enteric fever and climate El Niño, La Niña and Enteric fever El Niño Southern Oscillations Typhoid Indian Ocean Dipole Salmonella and climate
ABSTRACT Objective: To explore the relationship between climate variables and enteric fever in the city of Ahmedabad and report preliminary findings regarding the influence of El Niño Southern Oscillations and Indian Ocean Dipole over enteric fever incidence.Method: A total of 29 808 Widal positive enteric fever cases reported by the Ahmedabad Municipal Corporation and local climate data in 1985-2017 from Ahmedabad Meteorology Department were analysed. El Niño, La Niña, neutral and Indian Ocean Dipole years as reported by the National Oceanic and Atmospheric Administration for the same period were compared for the incidence of enteric fever.Results: Population-normalized average monthly enteric fever case rates were the highest for El Niño years (25.5), lower for La Niña years (20.5) and lowest for neutral years (17.6). A repeated measures ANOVA analysis showed no significant difference in case rates during the three yearly El Niño Southern Oscillations categories. However, visual profile plot of estimated marginal monthly means showed two distinct characteristics: an early rise and peaking of cases in the El Niño and La Niña years, and a much more restrained rise without conspicuous peaks in neutral years. Further analysis based on monthly El Niño Southern Oscillations categories was conducted to detect differences in median monthly case rates. Median case rates in strong and moderate El Niño months and strong La Niña months were significantly dissimilar from that during neutral months (P<0.001).Conclusions: El Niño Southern Oscillations events influence the incidence of enteric fever cases in Ahmedabad, and further investigation from more cities and towns is required.
1. Introduction
Enteric fever (EF) is a systemic infection, exclusive to humans,caused by a Gram-negative bacterium, Salmonella enterica, serovars Typhi and Paratyphi. Environmental factors like rainfall and temperature are known to affect the transmission of Salmonellae.Rapid urbanization with attendant over-crowded living conditions,poor management of sanitation, poverty, and poor hygiene have also been known to foster the incidence of EF[1]. In fact, improved hygiene in the first half of the 20th century led to a dramatic drop in cases of EF in the Western world[2].
The effect of El Niño Southern Oscillations (ENSO), a sea surface temperature and atmospheric pressure phenomenon of the Pacific Ocean on the Indian monsoon is well established[3]. Its warm (El Niño) and cold (La Niña) phases are known to be associated with deficient and abundant monsoons respectively[4]. The Indian Ocean Dipole (IOD), a similar phenomenon in the Indian Ocean, is known to modify the effect of El Niño on the Indian monsoon-a positive IOD event reduces the impact of El Niño and increases rainfall[5].The central or eastern location of warming in the large Pacific Ocean during an El Niño event and the extent of snow cover over the Himalayan Eurasian landmass are also believed to influence the Indian monsoon[6]. The Western Indian state of Gujarat, with Ahmedabad at its center, is known to be tele-connected to El Niño[4,7].
Numerous infectious diseases, particularly vector-borne and enteric, have been associated with ENSO effects in tele-connected regions in the world[7]. The incidence rate of cholera in Bengal over the last century has shown a definite, though weak correlation with ENSO cycles between 1893 to 1920, but a very strong correlation from 1980 to 2001[8]. Recent publications have reported that in Africa, during El Niño years, cholera incidence shifts to the eastern part of the continent, and in the United States, the incidence of enteric diseases increases markedly in the Northeastern region which is less tele-connected to El Niño than the western parts[9,10].
A few studies from Asia have examined the effect of climate variables on EF. Studies from Bangladesh, Vietnam, and China have reported that EF incidence rates increase with rainfall[11-13].In Vietnam, the extremely hot conditions in 1997-1998 due to El Niño may have enhanced the transmission and incidence of EF[12].However, the relationship of EF with ENSO cycles has not been explored much.
The largest population burden of EF in the world is in India[14].However, there have not been any published studies on the effect of climate on EF from India yet. This study explores the relationship between climate variables and EF in the city of Ahmedabad and report preliminary findings regarding the influence of ENSO and IOD over EF incidence.
2. Materials and method
2.1. Study area
Ahmedabad city, with a population of 5.7 million, is the seventh largest city of India and was the former capital of the state of Gujarat[15]. (Figure 1) It is located on the banks of the seasonal Sabarmati River and experiences a hot, semi-arid climate. The city had experienced a 22%, 26% and 50% increase of its population in the past three decadal census counts. In 2006, its population had increased by 1.1 million (50% increase) due to expansion of the city limits to include 159 km2of neighbouring peri-urban areas.
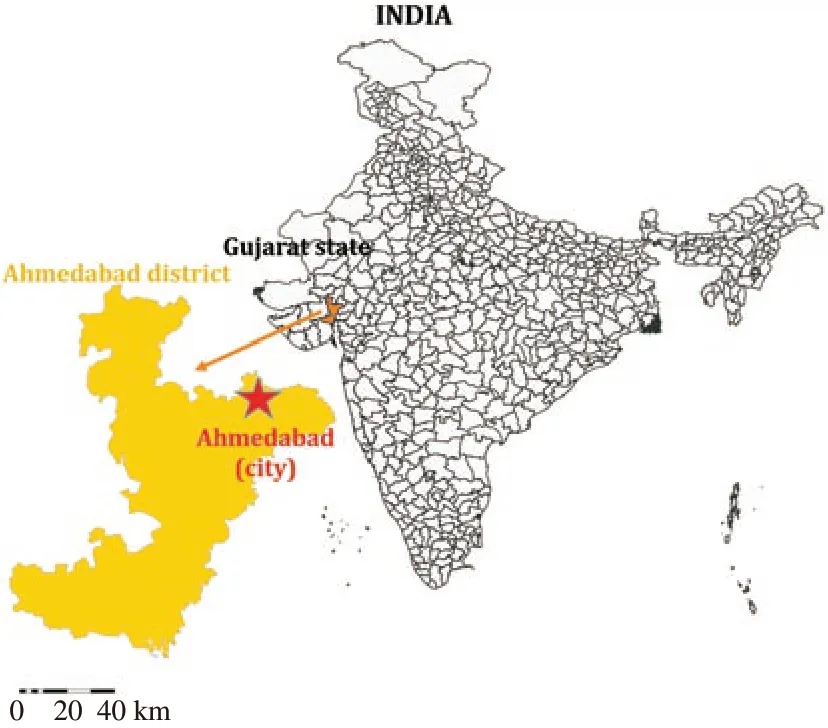
Figure 1. Ahmedabad city located in Ahmedabad district in the western Indian state of Gujarat.
2.2. Disease data
The Health Department of the Ahmedabad Municipal Corporation provided us with aggregated monthly numbers of Widal positive EF cases of past 32 years (January 1986 to December 2017), totalling up to 29 808 cases. These had been reported to the Epidemic Control Cell of the Health Department and verified by sanitary inspectors at every Urban Health Centre.
2.3. City population data
The census department provided us both the decadal census population, and the recasted population of the expanded city limits from 1961 to 2011. Mid-year populations were interpolated from a fitted line of the recasted population numbers, and used to normalise our monthly EF case incidence for every 100 000 population.
2.4. Climate data
Local climate data for the past 32 years (1985-2017), was obtained from the Ahmedabad Meteorological Centre of the Indian Meteorological Department. El Niño, La Niña, neutral and IOD years during our study period were identified from the National Oceanic and Atmospheric Administration website[16].
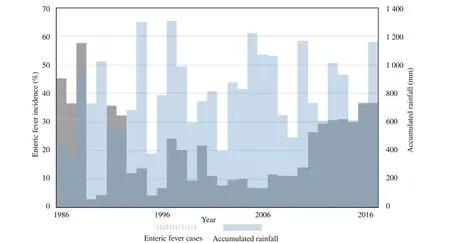
Figure 2. The annual trend of enteric fever incidence and accumulated rainfall over the study period (1986-2017).
The disease and climate data was examined in three and five categories of ENSO events as classified by National Oceanic and Atmospheric Administration. In three categories, there were 11 El Niño, 10 neutral and 11 La Niña years. In order to delineate finer differences, the data was examined in five categories by separating out weak and moderate El Niño and La Niña years from the strong,which showed there were 4 strong El Niño years, 7 weak+moderate El Niño years, 10 neutral years, 6 weak+moderate La Niña years and 5 strong La Niña years.
Furthermore, monthly ENSO categories were also created based on monthly Oceanic Nino Indices. The data of 384 months was classified into five categories-strong El Niño [>+1.5 sea surface temperature (SST) anomaly, 27 months], weak+moderate El Niño(0.5 to 1.4 SST anomaly, 69 months), neutral (-0.5 to +0.5, 195 months) weak+moderate La Niña (-0.5 to -1.4 SST anomaly, 76 months), and strong La Niña (>-1.5, 17 months).
2.5. Statistical analysis
Annual population-normalized EF case rates and accumulated rainfall during El Niño, Neutral and La Niña years were plotted using Microsoft Excel (version 2016). These were further compared through a repeated measure ANOVA using IBM SPSS Statistics(version 20). The differences in monthly population-normalized EF incidence by monthly ENSO categories were analysed using STATA(version 12).
2.6. Ethical statement
Ethical approval for this study was obtained from the Institutional Ethics Committee of Indian Institute of Public Health, Gandhinagar(TRC-IEC No: 5/2015).
3. Results
3.1. Trend of enteric fever and rainfall
The annual EF incidence and accumulated rainfall trends over three decades showed a repeated, but divergent pattern (Figure 2).While case rates were higher at both ends and relatively lower in the middle years, the rainfall trend showed considerable variability.From 1986 to 1994, there appeared to be an opposing trend of cases and rainfall repeating every 3 years; from 1995 to 2000, they seemed to rise and ebb together; from 2001 to 2010 there again appeared an opposing trend; while after 2010 there has been a strong and steady rise in cases with an indiscriminate rainfall trend. EF cases ranged from 2.8 to 57.7 per 100 000 population per year, while the annual accumulated rainfall varied from 369.6 mm to 1 306.0 mm.
3.2. Effect of ENSO events over the city of Ahmedabad
Over the study period of 32 years (1985-2017), except for 1994,1997 and 2006, which coincided with positive IOD events, the remaining eight El Niño years experienced a subdued rainfall(Figure 3). Five out of eleven La Niña years clearly experienced higher rainfall. The early El Niño events of 1986, 1987, 1991 and the most recent one of 2015 exhibited a trend of low rainfall and high cases. This trend was diluted in the middle El Niño years 1994,1997, 2002, 2004, 2006 and 2009 showing variability in rainfall and relatively lesser annual case rates. Although the highest case rate was recorded in a La Niña year (59/100 000, 1988), average case rates were highest for El Niño years (22.1), lower for La Niña years (20.9)and lowest for neutral years (17.5).
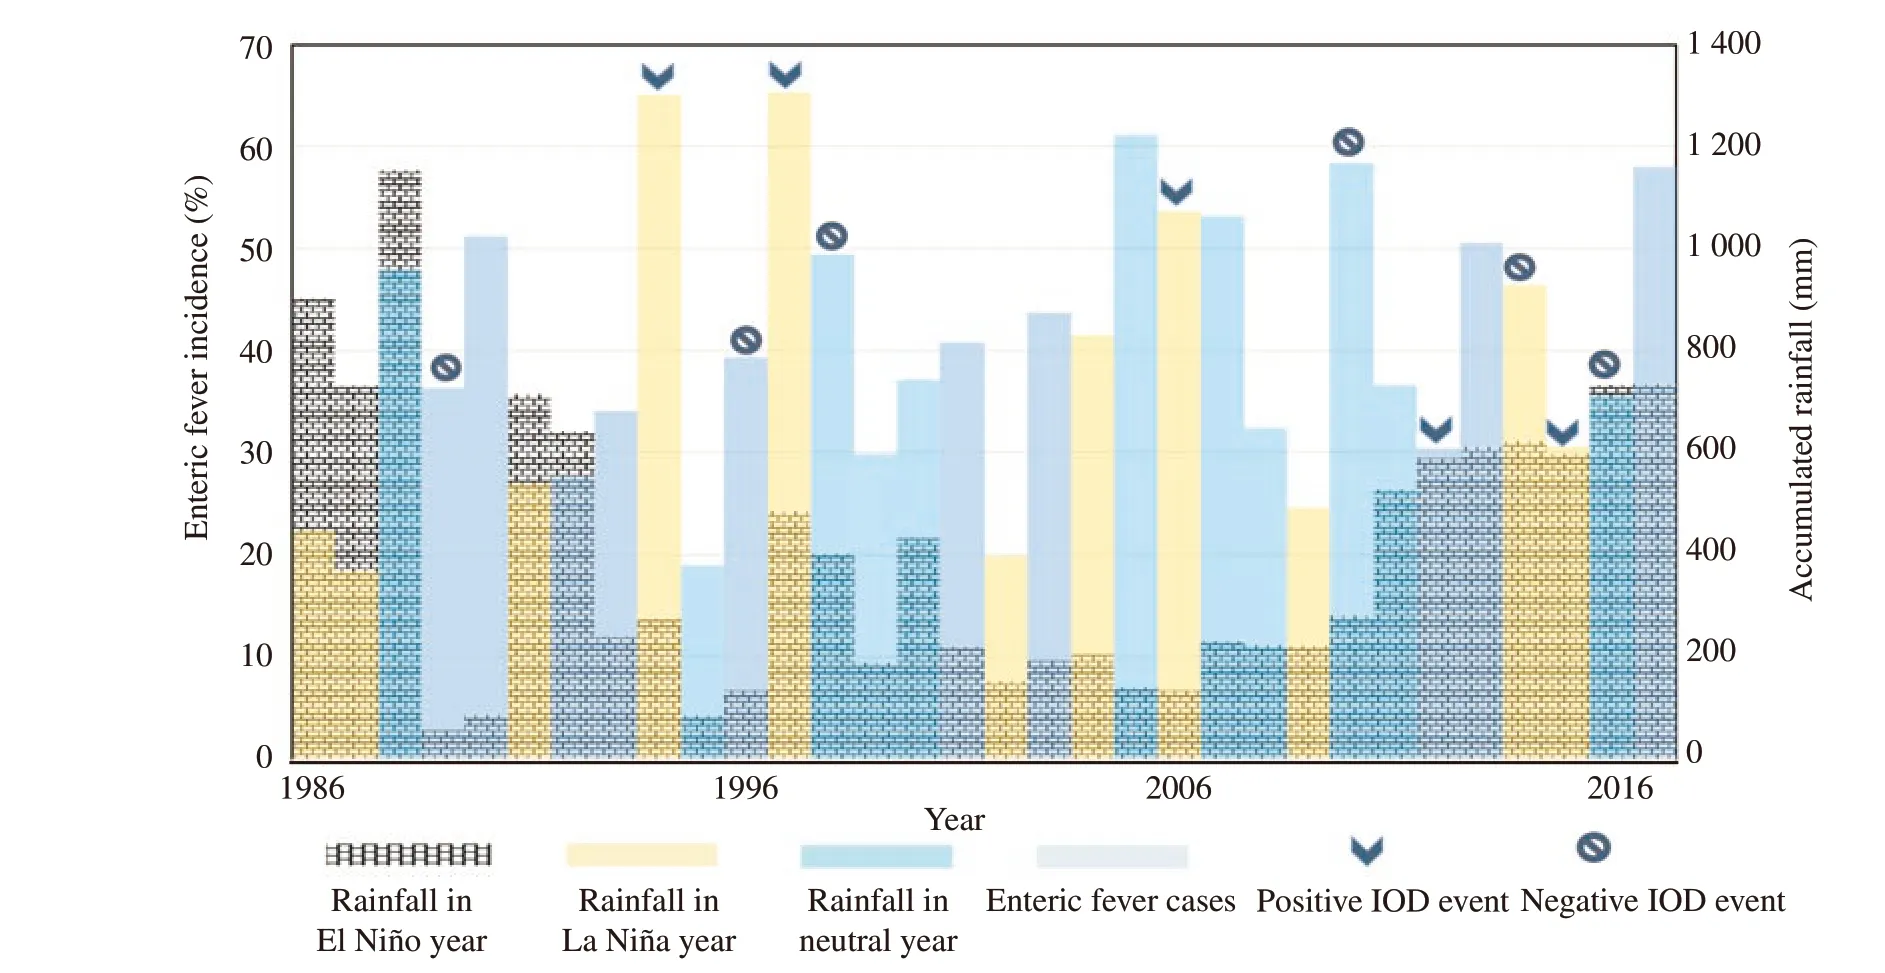
Figure 3. Trend of enteric fever incidence by El Niño, neutral and La Niña years with accumulated annual rainfall over the study period (1986-2017). IOD:Indian Ocean Dipole.
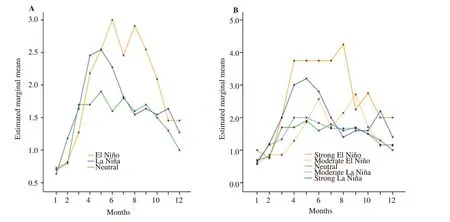
Figure 4. Profile plot of estimated marginal means of (A) monthly EF incidence across 3 ENSO categories and (B) monthly EF incidence across 5 ENSO categories.
3.3. Repeated measures analysis of variance
A repeated measures ANOVA was used to compare EF case rates within the three yearly ENSO categories of El Niño, La Niña and neutral; and the five yearly ENSO categories of strong El Niño,moderate El Niño, neutral, moderate La Niña and strong La Niña years. Since the assumption of sphericity was not met, greenhouse Geisser correction was used for adjusting the degree of freedom in both the analyses. There was no significant difference between mean case rates in the three [F (8.535, 123.760)=0.991, P=0.449]and five categories [F (17.61, 115.835)=1.057, P=0.404]
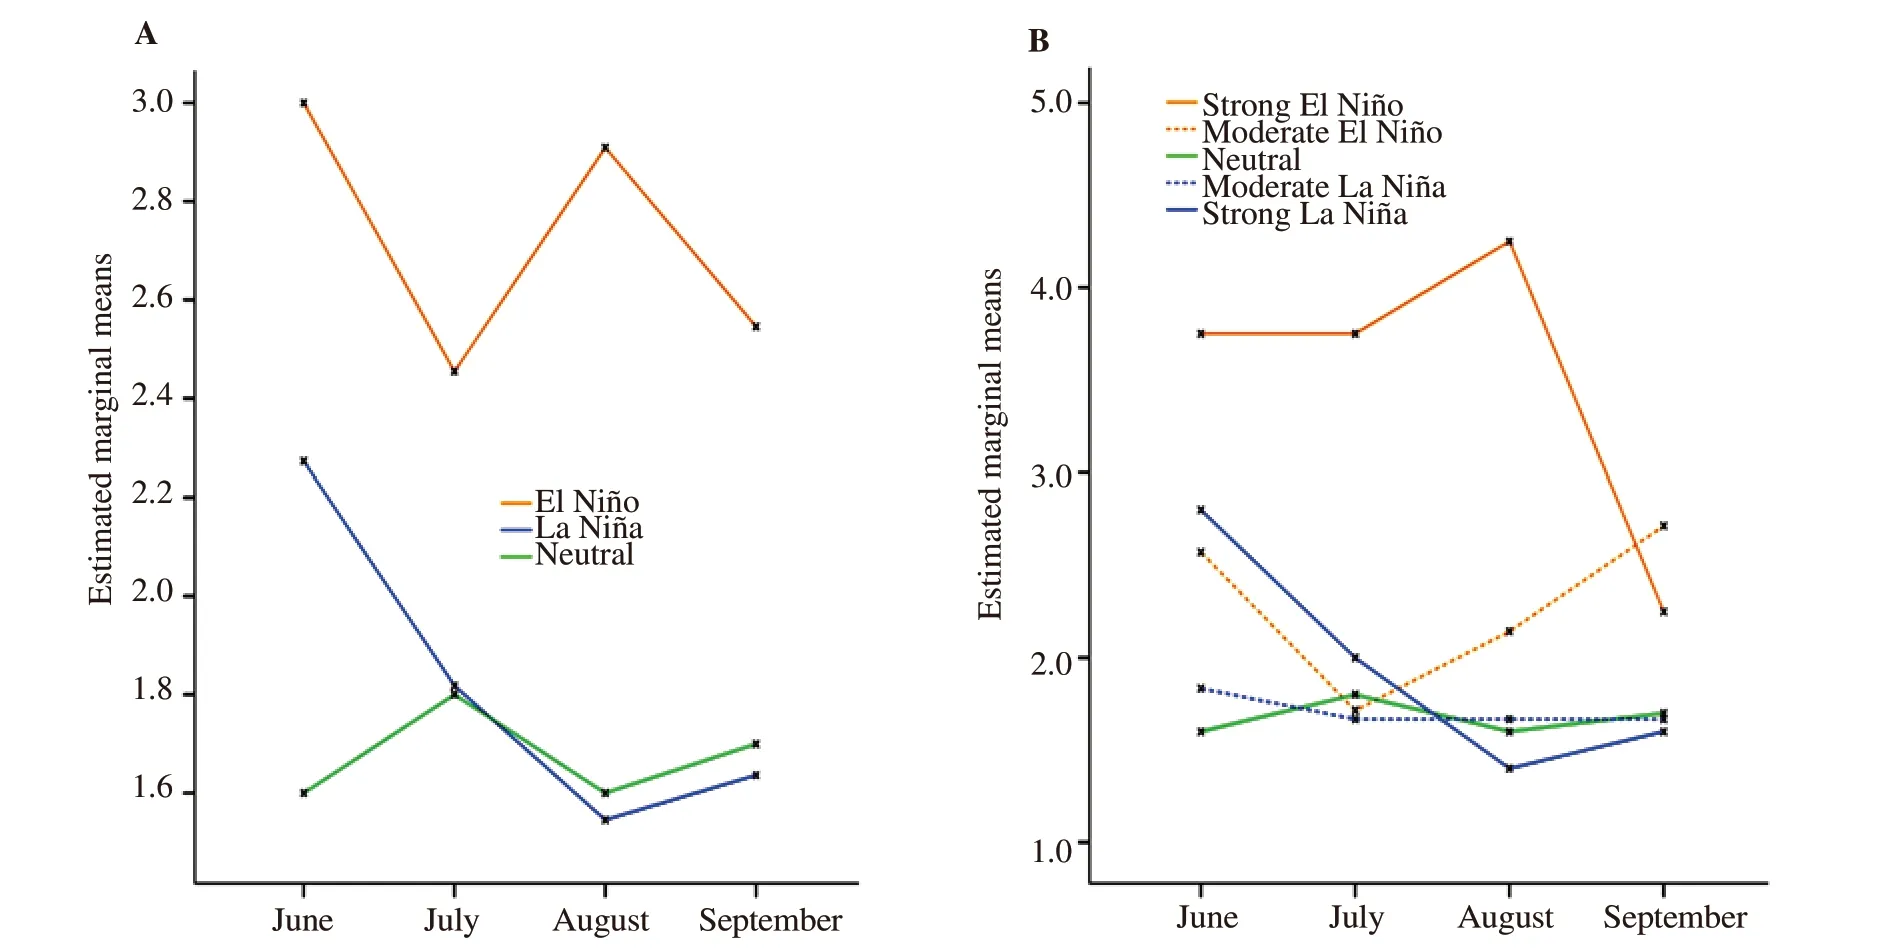
Figure 5. Profile plot of estimated marginal means of (A) EF incidence across 3 ENSO categories in June, July, August, and September (B) EF incidence across 5 ENSO categories in June, July, August, and September.
However, visual profile plot showed distinct differences in the trends of case rates in the three and five-yearly categories (Figure 4). When examined by three categories, cases showed a bimodal distribution with peaks in June and August months during El Niño years, both peaks being well above that in La Niña and neutral years.EF cases rise earlier during La Niña years and are highest in the months of April and May. Conversely, neutral years showed a rise in March which plateaued till September and then dropped. Similarly,in five categories too, the visual profile plot showed distinct EF trend lines. Strong El Niño years showed a steep rise in cases from February to April and then a spike in August; Strong La Niña years also showed an upsurge in EF case rates starting from February till May which then subsided and rose again in November. Cases during neutral years showed a rise in March which plateaued till September and then dropped. Cases during moderate El Niño years showed a bimodal distribution with spikes in June and September, whereas during moderate La Niña years, the trend was very similar to that in the neutral years.
A closer examination of the average incidence in monsoon months also showed that the case rate during El Niño years (10.81) was considerably higher than La Niña (7.27) and neutral (6.69) years, but this difference was not statistically significant (Figure 5).
However, when examined by monthly categories, the case rates were significantly different only for strong El Niño months. Kruskal-Wallis test showed that median incidences of normalized monthly cases was significantly dissimilar in at least one of the five categories(χ2=15.97, P<0.01). Further, Dunn’s Kruskal-Wallis test showed a significant difference between case rates in neutral months compared to strong El Niño months (Z=3.49, P<0.01), but not compared to moderate El Niño and strong and moderate La Niña months.
4. Discussion
Our data showed a noticeably higher number of average EF cases during El Niño and La Niña years than neutral years. Although cases peaked in the monsoon season, there was an earlier and steep rise of cases in March, April and May, well before the onset of the monsoons, during El Niño and La Niña years. This was peculiarly distinct from the more sedate rise in the neutral years. However,comparison of incidence by ENSO months established that the case rate was significantly higher only for El Niño months.
The three positive IOD events that occurred along with the strong El Niño years in 1994, 1997 and 2006 may have lowered the annual case rates during these years by causing excess rainfall, and thus the lack of significance in the higher EF incidence in the El Niño years.However, we found significantly higher median monthly EF case rates during strong El Nino months.
The increase in case rates at both extremes of the ENSO phenomenon may have been mediated through deficient rainfall in El Niño years and excess rainfall in La Niña years[17]. Previous studies have shown that incidence of EF cases rises, both during years of deficient rainfall due to water shortages, and during years of abundant rainfall due to contamination of water supplies[18,19].Warm temperatures also lead to increased levels of temperaturesensitive Salmonella in food and water[20]. Uneven development of urban infrastructure would also influence rates of illness[21,22].Ageing water supply infrastructure could have also contributed to the variation of cases in our study[23]. It is remarkable that despite the presence of numerous natural and man-made influences, our data shows a significantly higher incidence of cases during El Niño months.
There is limited evidence of climatic influences on the incidence of salmonellosis in the literature. In New Zealand, incidence of nontyphoidal salmonellosis between 1997 to 2008 was shown to be positively associated with temperature in the current month and with ENSO indices in the current and previous months[24]. In Maryland,USA, extreme heat and extreme precipitation led to significantly increased incidence of non-typhoidal salmonellosis between 2002 to 2012, particularly in coastal area compared to non-coastal[25].
Furthermore, there is moderately strong historical evidence of El Niño being associated with other water-borne diseases[26]. El Niño events in Peru in 1997-1998 resulted in a 2-fold increase in diarrhea cases in winter when compared to the previous 4 years; an additional 6 225 cases were attributed to that particular El Niño event[27].ENSO events have also shown a strong correlation with cholera prevalence in the last two decades (1980-2001) in Bangladesh[8].The past two decades of investigation into the last century’s ENSOcholera associations in Bengal through varied statistical lenses has yielded a bouquet of analytical techniques and evolving prediction models[7,28]. Unlike the association of cholera outbreaks with El Niño-triggered phytoplankton blooms[29], an association of EF(and Salmonellae) with phytoplankton would seem very remote.Reservoirs and transmission cycles of typhoidal Salmonellae are a more intractable, locally influenced and contained phenomena than that of vibrio[30]. Although studies do show that non-typhoidal Salmonellae are maintained in the environment in inland, coastal,and estuarine waters like vibrio[31], and could hypothetically be subject to a similar transmission mechanism through phytoplankton blooms, typhoidal Salmonellae are well-known to be obligate human pathogens[1]and unlikely to be affected by climate. For these very reasons, if a longer and larger, spatially distributed dataset of EF incidences were to show an association with climate phenomena,it would compel us to search for answers that would result in a deeper and more meaningful expansion of our understanding of the relationship between climate and Salmonella typhi in particular, and enteric pathogens in general.
The EF cases reported to the city’s epidemic cell were based on Slide and/or Tube Widal positive tests. Each of the case addresses had been visited, and the patient confirmed to be ill by public health inspectors of the municipality. Thus, although the Widal is a very poor diagnostic test, ours is a long and large data set that has been systematically collected and has undergone a partial,but uniform curative process over the years. Such data would be consistent enough to indicate the trend of EF incidence in the city over the years. These are preliminary findings, and further statistical investigation of the sensitivity of temperature and rainfall in our city to ENSO events, and of the lead-time association between ENSO events, climate variations, and EF case rates need to be conducted.Also, the analysis has not accounted for autocorrelation and seasonality of cases in the data.
Climatic factors, such as temperature and rainfall, are only one among the many factors that influence EF incidence. Others factors like sanitation, urbanization, socio-economic condition, proximity to coastal and non-coastal locations probably have a stronger influence on this disease. Despite this, our preliminary analysis showed that both extremes of ENSO conditions have an effect on EF incidence in the city of Ahmedabad. The earlier upswing in case incidence in the El Niño and La Niña years, when the weather is still pleasant and water shortages haven’t yet begun in the city, is surprising and merits deeper investigation. Our results suggest that the city health department must be mindful of both El Niño and La Niña years and treat the coming of these months as an early warning signal. It would be valuable to explore EF and climate trends in relation to ENSO events from more towns and cities across the Indian sub-continent to confirm whether such an effect is present in other sites, and if so, the mechanism through which this effect is mediated.
Conflict of interest statement
We declare that we have no conflict of interest.
Funding
The research reported in this manuscript has been funded by Public Health Research Initiative (PHRI) Research grant awarded by PHFI with the financial support of Department of Science and Technology(No. PHRI LN0019).
Authors’ contribution
V.I. conceived and designed the study, B.S. collected data and maintained quality, S.A.C., A.S., D.N., M.S.R. and V.I. did the analysis, V.I., B.S., D.N., M.S.R and D.M. interpreted the data, V.I.S.A.C, A.S drafted the article, V.I., B.S., D.N., M.S.R and D.M.critically revised the article, A.S. re-drafted and gave final shape, all authors approved the final version to be published. V.I. supervised the project.
 Asian Pacific Journal of Tropical Medicine2019年12期
- Asian Pacific Journal of Tropical Medicine的其它文章
- Multi-targeting cytotoxic drug leads from mushrooms
- Spectrum of thalassemia mutations in fetuses of Han and Li ethinicities in Hainan province, China
- Seroprevalence of brucellosis among exposed agro-pastoral communities in southern Saudi Arabia
- Prevalence and risk factors of avian influenza H9N2 among backyard birds in Iran in 2015
- Alpinia officinarum Hance extract alleviates particulate matter-induced lung injury in mice
- Cutaneous leishmaniasis in an indigenous infant with Down's syndrome:A case report
