Maple Demonstration Example of Spatial Graphic
Xia Chuanwu
(School of Mathematics and Physics,Xuzhou Institute of Technology,Xuzhou 221018)
Abstract:In this paper,the application of Maple in spatial graphics processing is demonstrated by combining with the example of rotating paraboloid.
Key words:Maple;rotating paraboloid;spatial Graphic
In the process of learning spatial analytic geometry,a headache problem for beginners is the shape of spatial graphics,do not know the shape,everything feels like a cloud in the fog.Maple mathematical software has a strong graphics processing ability,with the help of Maple,many complex spatial graphics can be intuitive.Through an example,this article presents the main approach of spatial graphics processing by Maple.
I.Rectangular Coordinates Plot
Taking a space graph in rectangular coordinates whose equation isas an example and observe what Maple can do to get the graph of that equation out in front of you.
The simplest way is to use plot3d to draw directly with the rectangular coordinate equation,and type the following command statement in the Maple 11 command window:

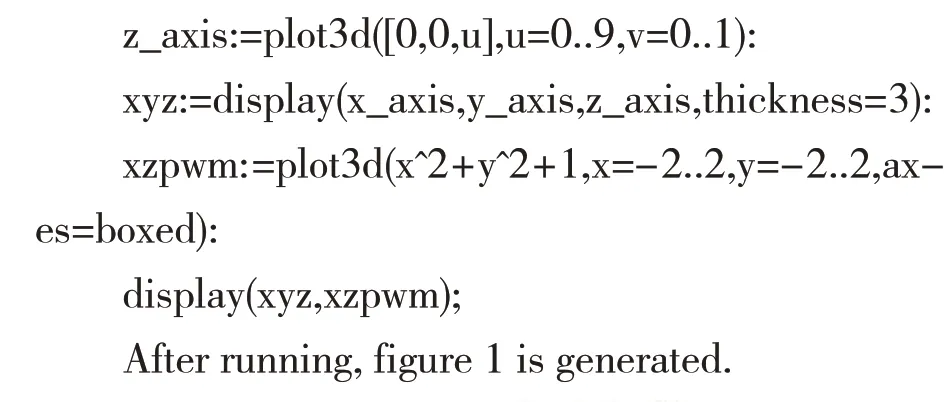

Figure 1 Rectangular Coordinates Plot
This is what happens when you shift the rotation paraboloidthat you're most familiar with in the analytic geometry of space up by 1.However,the graph drawn by rectangular coordinates is not consistent with the intuitive image of rotating paraboloid due to its rectangular domain.But it also has the advantage of knowing that the intersection of a rotating parabola with a plane perpendicular to thex-axis(ory-axis)is also a parabola.
II.Parametric Equation Plot
The figure in figure 1 is different from our image of rotating paraboloid.In fact,if we choose the circle domain defined in rectangular coordinate system,the figure will be consistent with our image.Therefore,we need to resort to the parametric equation of the rotating paraboloid.We can take the parametric equation of the rotating paraboloid as:
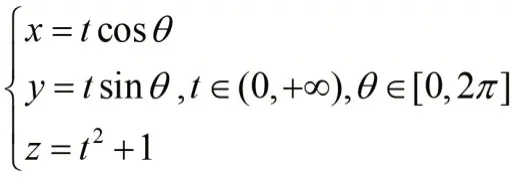
Type the following command in the Maple command window:
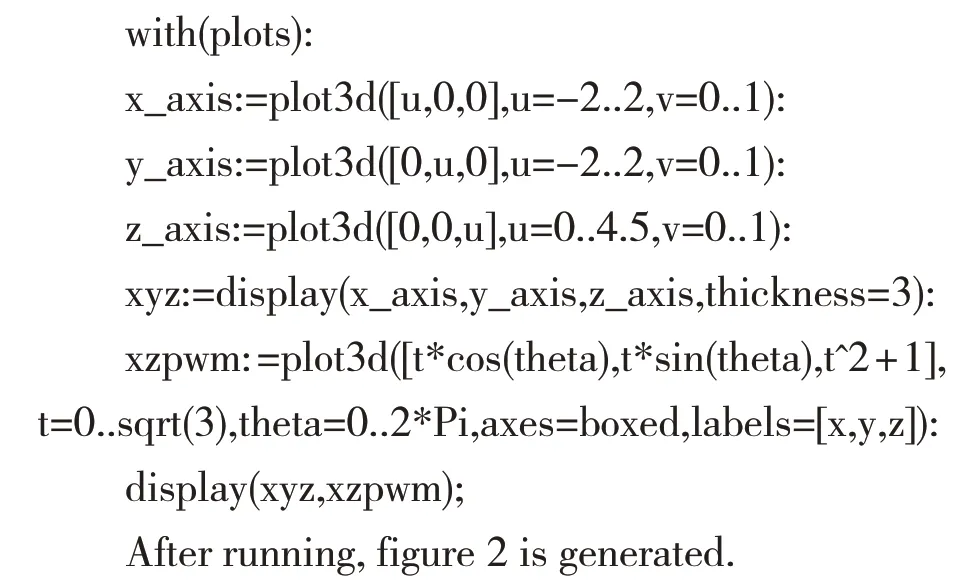
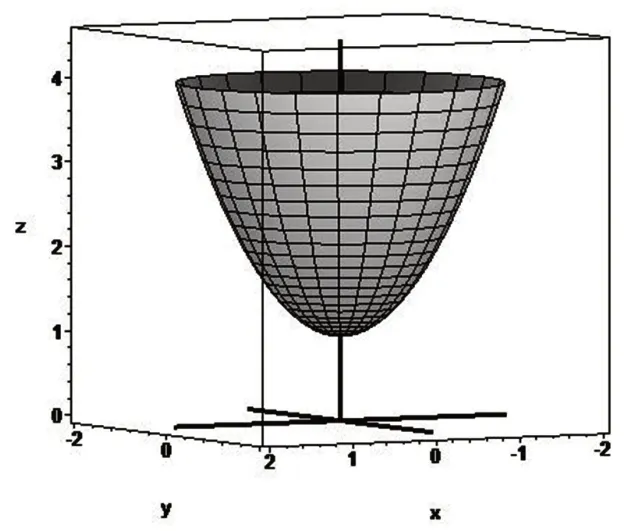
Figure 2 Rotating Parabolic Parametric Equation Plot
III.Projections onto Different Coordinate Plane[1]
We can further deepen our understanding of the figure by investigating the projection shape of figure 2 on each coordinate surface.Type the following command in the Maple command window.


Figure 3 the Projections of Rotating Paraboloid onto Different Coordinate Surfaces
IV.Animated Show[2]
In teaching,if the generation process of rotating paraboloid can be shown to students in the form of animation,it will be very helpful to the teaching effect.
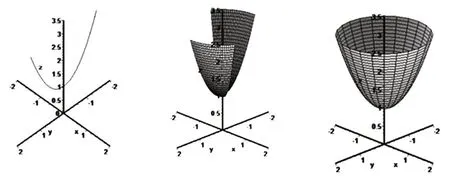
Figure 4 Rotating Paraboloid Animation Implementation
In fact,this is easily done with the animate command of Maple.Still,using the rotating paraboloid as an example,simply type the following command in the Maple window:
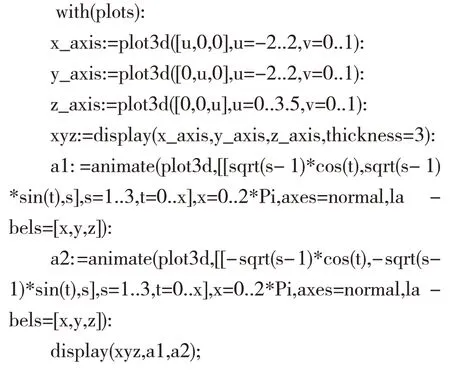
After running,figure 4 is generated.From left to right are the initial positions of the bus respectively.In the animation process,a part of the rotating paraboloid is formed.After the bus is rotated once,the whole rotating paraboloid is obtained.
V.Conclusion
This paper introduces the auxiliary function of Maple software in teaching through a simple example.Maple software is an excellent symbol calculation software,it also has a strong graphics processing ability,in higher mathematics,if Maple can be flexibly used,the learning difficulty can be reduced and students'interest in learning can be improved.
- 中阿科技论坛(中英文)的其它文章
- Study on the Casas-Alvero Conjecture of Univariate Polynomials
- Application of Computer Lingo Software in Production Efficiency
- Design of Tractor Traction Resistance Monitoring System for Potato Harvest Equipment
- Study on Gemological Characteristics of Changbai Jade
- Innovation and Application of Key Technologies of Arc Spring Damping Flywheel Assembly
- Research on Medical Image Segmentation Based on Morphology

