Research on Nonlinear Frequency Compression Method of Hearing Aid with Adaptive Compression Ratio
Xia Wang,Hongming Shen,Huawei Tao,Ruiyu Liang,Xing Deng,Haijian Shao,Li Zhao and Cairong Zou
1School of Information Science and Technology,Nantong University,Nantong,226019,China.
2School of Information Science and Engineering,Henan University of Technology,Zhengzhou,450001,China.
3School of Communication Engineering,Nanjing Institute of Technology,Nanjing,211167,China.
4School of Automation,Key Laboratory of Measurement and Control for CSE,Ministry of Education,Southeast University,Nanjing,210096,China.
5School of Computer Science,Jiangsu University of Science and Technology,Zhenjiang,212003,China.
6School of Information Science and Engineering,Southeast University,Nanjing,210096,China.
Abstract: To make full use of the residual audible frequency band of hearing-loss patients and improve the intelligibility of speech,an adaptive nonlinear frequency compression (NFC) algorithm is proposed,which amplifies signals below the cutoff frequency while compresses signals above the cutoff frequency.Firstly,high-frequency signals are decomposed to critical band signals according to the BARK scale.Secondly,the global compression ratio is determined according to the patient's cutoff frequency and maximum audible frequency.Thirdly,the sub-band compression ratio is adaptively determined based on the global compression ratio and normalized average energy of subband signals.Finally,the high frequency signals are transposed to low frequency bands by compression mapping,and the phases are adjusted to the same as the original low frequency signals.Experimental results of speech intelligibility with nine subjects demonstrate that compared to conventional amplitude amplification and nonlinear frequency compression algorithms the proposed algorithm significantly improves the intelligibility of initials and sentences,while not affects the intelligibility of finals and tones significantly.
Keywords:Frequency compression,sensorineural hearing loss,hearing aids.
1 Introduction
Aging,noise,and ototoxic drugs (among other phenomena) cause hearing loss.The audiograms of approximately 90% of adults and 75% of children exhibit a sloping hearing loss pattern among patients with hearing loss.Therefore,in high-frequency regions,such groups may not hear any sound due to hearing loss.However,most of the key information in speech is concentrated in the high-frequency area,such as the fricative consonants (/s/,/sh/,/f/) and africative consonants (/zh/,/ch/) in Chinese.Some patients with heavy hearing loss regarding high-frequency signals are unable to benefit from sound amplification even with a hearing aid.There are several reasons such as (1) acoustic feedback from the hearing aid limits the gain of the device [Puhan and Panda (2018)];(2) limited by their power,hearing aids are unable to provide sufficient gain in the high-frequency region [Moore and Popelka (2016)];(3) cochlear dead regions,which are caused by the damaged hair cells in cochlea,may be present in the patient [Souza and Hoover (2018)].In patients with cochlear dead regions,even if a hearing aid could provide sufficient high-frequency gain,the issue remains that high-frequency signals are incomprehensible to the patient.The first two problems mentioned above can be resolved by improving the performance of the acoustic feedback suppression system of the hearing aid and increasing its power.The third problem is associated with patients with deficiency in inner ear hair cells in the high-frequency region.So,the dynamic range compression technology of hearing aids is difficult to bring benefits to patients.Improving the speech intelligibility of patients with severe hearing loss has always been a challenge.Cochlear implant and the use of frequency-lowered hearing aids are two common coping strategies.However,an electronic cochlear implant requires surgery and can cause various side effects such as numbness on the scalp or facial nerve injury.And it takes time for the patient to adapt to the synthetic electronic signal,requiring training with a special system [Almaraz,Een,Grafelman et al.(2018)].In this case,a frequencylowering hearing aid is a beneficial choice.Despite the great achievements associated with hearing aid technology,it is still very challenging for existing hearing aids to enable patients with high-frequency hearing loss to detect high-frequency signals [Dillon (2012)].Studies on frequency-lowering technology were initiated half a century ago,aiming to help severe sensorineural high-frequency hearing loss patients who cannot benefit from the dynamic range compression (DRC) technology.Recent investigations on frequencylowering techniques have shown that the benefits of this technique to speech recognition are mainly reflected in the recognition of fricative consonants,e.g.,/s/,/sh/,and /f/ [Alexander (2013)].The formant frequency of women or children when making the consonant of /s/ is between 6,300 and 8,300 Hz,with a sound pressure level of 57-68 dB.The hearing loss patients with a steeply sloping hearing loss in the high-frequency region cannot hear these consonants using DRC hearing aids.However,accessing to the acoustic-phonetic properties in the input is essential for patients who are still in the stage of language learning [Moeller and Tomblin (2015)].Wen-HsuanTseng et al.studied fourteen adults with sloping sensorineural hearing loss who were using nonlinear frequency compression (NFC) hearing aids with extended bandwidth and found that the subjects may benefit more for word and consonant recognition [Tseng,Hsieh,Shih et al.(2018)].Various frequency-lowering algorithms have enabled remarkable achievements,and more than half of the world’s mainstream hearing aid manufacturers are producing frequency-lowering hearing aids.However,there are still disputes over the benefits of these frequency-lowering hearing aids.The reasons are as follows:First,uniform standards for verifying the performance of various frequency-lowering algorithms are lacking;some are focused on the recognition accuracy of fricative and affricative consonants,some on the recognition accuracy of consonants,and some on making distinctions between singulars and plurals.Second,the subjects in the studies are varied;some included hearing loss patients with an audiogram assuming a steeply sloping hearing loss pattern,while others included those with an audiogram assuming a moderately sloping hearing loss pattern;some included patients with middle to severe hearing loss,while others included those with severe to extremely severe hearing loss;some included adult patients,while others included children.Third,during the fitting process,different studies employed different parameters for the same compression algorithm;some set uniform parameters,while others set parameters that varied with the subjects.Consequently,different studies have drawn inconsistent conclusions.In addition,the existing results are essentially all based on tests on English-speaking patients;however,differences exist in auditory perception between Chinese and English [Chen,Wong and Wong (2013);Keating and Kuo (2012)].in the Chinese language,vowels last longer than consonants,which differs from the English language.English is an intonation language,while Chinese is a tonal language.The Chinese language contains more clear consonants,which plays an important role in meaning discrimination,and incomprehensibility regarding clear consonants leads to greatly reduced speech recognition capability.
NFC algorithms have the following drawbacks:on the one hand,high-frequency signals are compressed to low-frequency region,and the spectral resolution of the signals is reduced,which trades off the benefit from signals becoming audible;on the other hand,for some low-frequency bands with a low average energy,compressed signals may still lie outside the patient’s hearing threshold.Therefore,it is necessary to further investigate NFC algorithms to help hearing loss patients gain the greatest possible benefit.McCreery maximized the audibility of signals by compressing them to the estimated audible bandwidths to improve the accuracy of non-verbal recognition [Picou,Marcrum and Ricketts (2015)].Based on this research and the above analysis,an adaptive NFC algorithm is proposed.Signals with frequencies above the cutoff frequency are decomposed into sub-band by BARK scale.In addition,the normalized average energy of the sub-band is used to allocate the breadth of each sub-band after compression,and a larger bandwidth is assigned to the bands with a high average energy to avoid the reduction in spectral resolution of the signal caused by the compression,while a smaller bandwidth is assigned to the bands with a low average energy to make full use of the patient’s residual audible band.
The rest of the paper is organized as follows:The proposed adaptive frequency compression algorithm is illustrated in Section 2.Extensive experiments have been carried out in Section 3 to demonstrate the efficiency of the proposed algorithm using various input signals.Finally,the conclusions of the paper are drawn in Section 4.
2 Method
2.1 Algorithm flow
The flow of the proposed adaptive NFC algorithm is shown in Fig.1.At first,the cut-off frequency and the maximum audible frequency is determined by the input signal with 65 dB sound pressure.Then the global compression ratio is determined.Secondly,the fast Fourier transform (FFT) is then performed after signal pre-processing,the BARK subband division is performed on spectra with an above-the-cutoff frequency [Healy,Yoho,
Wang et al.(2013)],the average energy of each sub-band is computed and then normalized,and the sub-band compression ratio is adaptively changed according to the sub-band average energy,which is jointly determined by global compression ratio and sub-band average energy.Finally,the signals undergo compression,amplification,and processed signals is generated by inverse Fourier transformation.
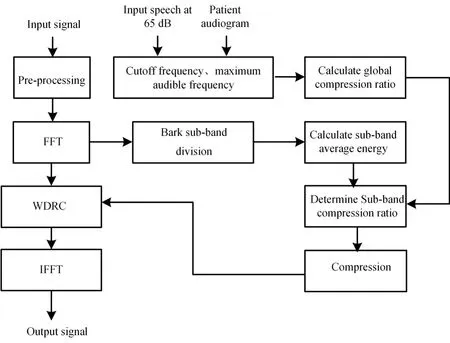
Figure 1:Adaptive NFC algorithm flow
One frame of signals withNsample points is denoted byx(n),in whichn= 0,1,...,N- 1.It is expressed byX(k) after Fourier transformation.The spectral band division is performed in the frequency domain using the BARK critical band division method according to the sampling theorem,and the average energy of each frequency band with a frequency above the cutoff is calculated.

wherei=is,is+1,...,M,isis the first sub-band that requires compression,Mis the number of sub-bands,andNiis the number of lines included in thei thsub-band.The energy of each sub-band is normalized using the following normalization formula:

In Formula (2),Ris the number of sub-bands to be compressed.The calculation of bandwidthDiof thei thcompressed sub-band is as follows:

whereBis the total bandwidth to be compressed,Biis the sub-band width before compression,cis the global compression ratio,andhis the band-retention rate,which is set to avoid the expansion of some bands caused by excessive compression on bands with a small average power.In the process of compression,some bands will be compressed to a greater extent because of the small energy,which will cause the bandwidth expansion of the larger energy band,thus the signal distortion.Therefore,the band-retention rate is set as a parameter.It refers to the ratio of the compressed bandwidth to the precompression bandwidth when the average energy of the signal in the band is 0 in extreme cases.the frequency range of thei thband signal before compression is expressed as [Li,Hi] and the corresponding frequency range of thei thband signal after compression asthen,the relationship between the frequencies is as follows:

The sub-band compression ratiocican be determined based on the ratios of the bandwidth before and after compression:

2.2 Frequency mapping method
The auditory filter of the hearing loss patient is widened,and the spectral masking effect is enhanced.To mitigate the spectral masking effect,Kulkarni et al.proposed to perform the compression mapping of signals within the critical band onto the center frequency of the critical band using different compression ratios and different mapping methods [Kulkarni,Pandey and Jangamashetti (2012)].In the present study,in reference to the three spectral mapping methods,the signals in the high-frequency critical band is mapped to the low-frequency audible frequency range through (1) sample-to-sample mapping,(2) overlay mapping,and (3) mapping by spectral segment.Before mapping,the frequency is first converted to the spectral index of the spectral line after Fourier transformation.

wherefinandfsare the input frequency and sampling frequency,respectively.The spectral line number expressed askiccorresponding to the center frequency before compression is

wherekisandkieare the spectral line number corresponding to the starting and stopping frequency of the original band,respectively.The spectral line number corresponding to the center frequency after compression is

whereandare the starting and stopping spectral index of the compressed frequency band,respectively.
(1) Sample-to-sample mapping:The spectral value before mapping is expressed at a certain frequency.If the spectral index of the spectral line before compression isk,then the spectral index of the spectral line after compressionk'is

whereround(•) represents the rounding operation.The compressed spectrum can be obtained through the following formula:

The schematic diagram of sample-to-sample mapping is shown in Fig.2(a).If several points are simultaneously mapped to one point,then the largest spectral value is taken as the mapped spectral value.The solid line indicates the retained spectrum,and the dotted line represents the abandoned spectrum.
(2) Spectral sample superimposition mapping:The mapped spectral value at a certain frequency is the sum of spectral values of all the spectral lines mapped,as shown in the schematic diagram in Fig.2(b).Because the frequency band is compressed,several spectral lines may be mapped to the same point.
(3) Spectral segment mapping:A spectral segment is mapped to a frequency point.As shown in Fig.2(c),the spectral segment spectrum of [a,b] to be compressed is mapped tok' using the following mapping formula:

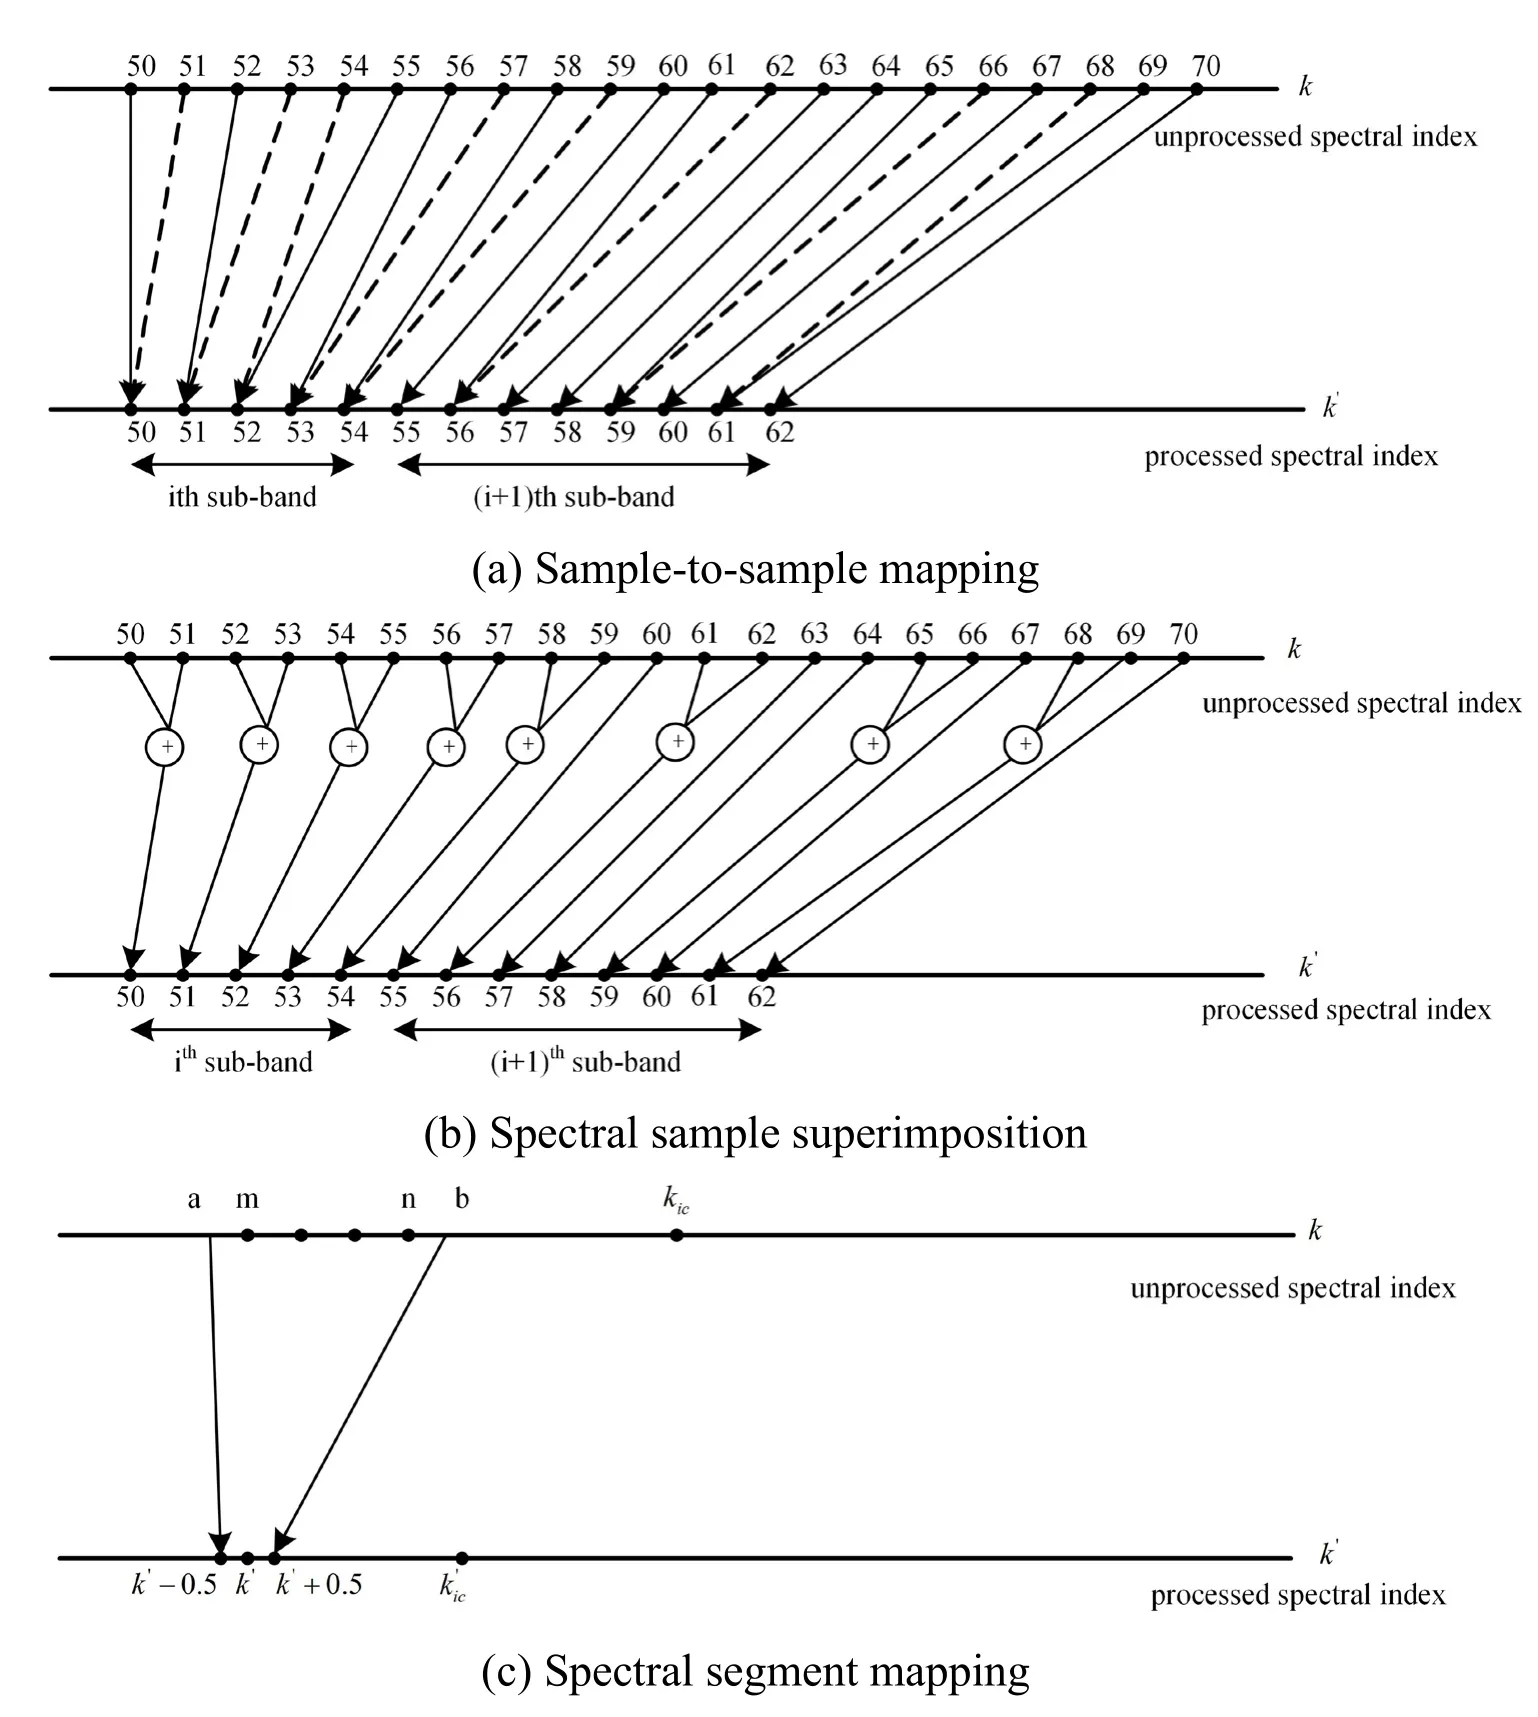
Figure 2:Spectrum mapping method
3 Experiments
3.1 Simulation results and analysis
The spectra of a frame with the original speech signal processed by the NFC [Simpson,Hersbach and McDermott (2005)] and the adaptive NFC algorisms are shown in Fig.3,in which the adaptive NFC is performed with the sample-to-sample mapping method to compare the spectra before and after compression.The signal is a frame of the Chinese fricative consonant of /s/ with a sampling frequency of 16 kHz,and in the two algorithms,signals of 2.5-8 kHz were compressed to 2.5-6 kHz.As shown in Fig.3(a),the energy of the /s/ consonant is mainly concentrated in the high-frequency band,and the patient’s hearing loss also occurs in this frequency band.It is thus very important to render the high-frequency signal audible and comprehensible.It is shown in Fig.3(b) that the spectral resolution is reduced in the nonlinear spectral compression process and some peaks disappear.for example,the highest two peaks become one peak,and four peaks to the right of the maximum peak are reduced to three after compression,indicating that in the compression process,loss of information of the spectral peak of the signal occurs.Moreover,the spectral value information of large peaks lost in Fig.3(b) is retained in Fig.3(c) because the adaptive NFC method assigns a wider frequency band for bands with a high average energy,which enables the signal to be audible and the distortion of signal spectrum to be reduced.It is because that the bands with a higher average energy are assigned with a wider bandwidth to ensure the audibility of the signal while the bands with a lower average energy are assigned with a narrower bandwidth to maximize the use of the audible band.
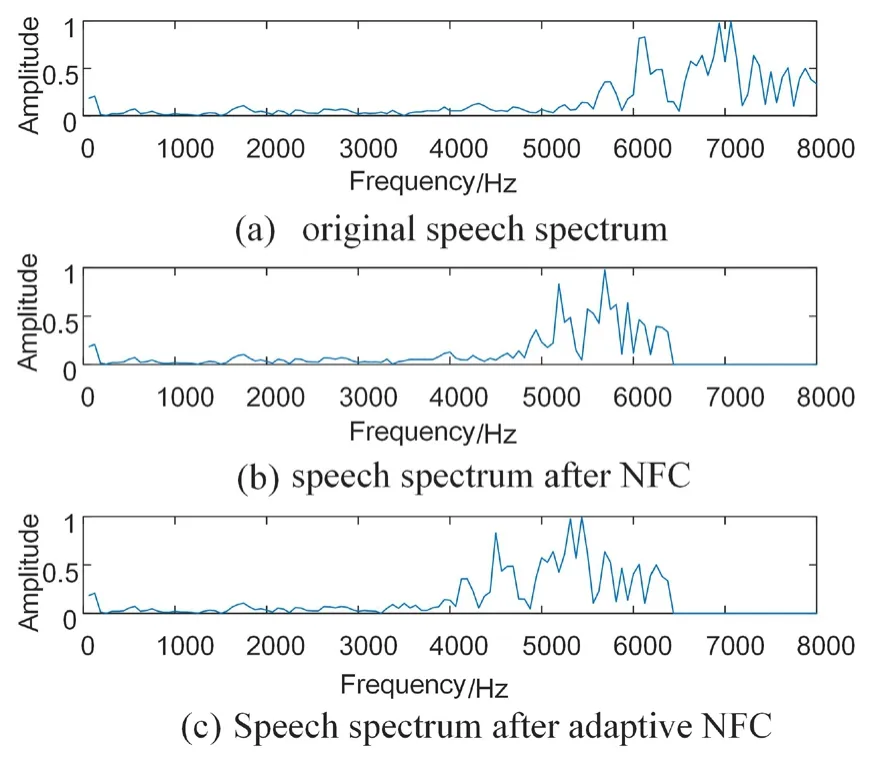
Figure 3:Spectrum comparison of the original signal and the compressed signal
3.2 Subjective test
3.2.1 Subjects
Nine patients (five females and four males) with middle to severe hearing loss participated in this experiment.All were hearing-aid wearers having a sensorineural hearing loss.The ages of the patients ranged from 56 to 71 years with an average age of 64 years.Prior to testing,the hearing of each patient was assessed with air and bone conduction.In all cases,the air-bone gap was ≤10 dB,which suggesting a sensorineural hearing loss.Each patient’s hearing loss was symmetrical,i.e.,the binaural hearing threshold difference was lower than 10 dB.The ear with the higher pure tone average (PTA) value was chosen as the test ear.In the case that the binaural PTA values were the same,then the high-frequency hearing thresholds were compared,and the ear with the lower high-frequency hearing threshold was chosen as the test ear.The hearing performances of the test ear of the patients are shown in Tab.1.
3.2.2 Test procedure
The test procedure was divided into three processes:fitting,training,and testing.The test was performed using the speech samples in the speech corpus for hearing aid fitting and their noise-containing forms.The noise-containing signals were generated through superimposing a noise signal atop a pure speech signal.At the beginning of the test,the subject was informed as to the purpose of the test and the requirements of the subject for the test and asked to sign an informed consent form.The pure-tone hearing threshold of each subject was determined,and the parameters of the three algorithms,i.e.,the DRC algorithm,NFC algorithm and adaptive NFC algorithm proposed in this study,were determined for each subject based on the subject’s audiogram.The parameters for the first algorithm adopted the default parameters of the fitting software.The amplification adopted the NAN-NL1 prescription formula,and no training was required before testing the algorithm.The parameters of the adaptive NFC algorithm were determined as described in Simpson et al.[Simpson,Hersbach and McDermott (2005)],and training was required before testing the algorithm.After the successful fitting of the subject,the speech corresponding to items 1-15 of the “Outline of Mandarin Proficiency Test” were processed offline using a MATLAB program based on the parameters obtained in the fitting.If training was needed,the processed speech was stored on a CD,which was taken home by the subject to train at home.To ensure training effectiveness,the subject was asked to listen to the speech on the CD for at least two hours a day without wearing a hearing aid;the subject took the test in the laboratory once every two weeks.To avoid the effect on the test results of the subject’s memorizing the training speech,speech from the hearing aid fitting database was used in the test.The corpus of the test library included six monosyllabic word tables (50 words per table),eight di-syllabic word tables (25 words per table),and five sentence tables (25 sentences per table).All the tables were read once by a male voice and female voice,and the signal sampling frequency was 44.1 kHz in double channels.In this study,the signals from the first channel were used,and the sampling frequency of the signals was resampled to 16 kHz before further processing.
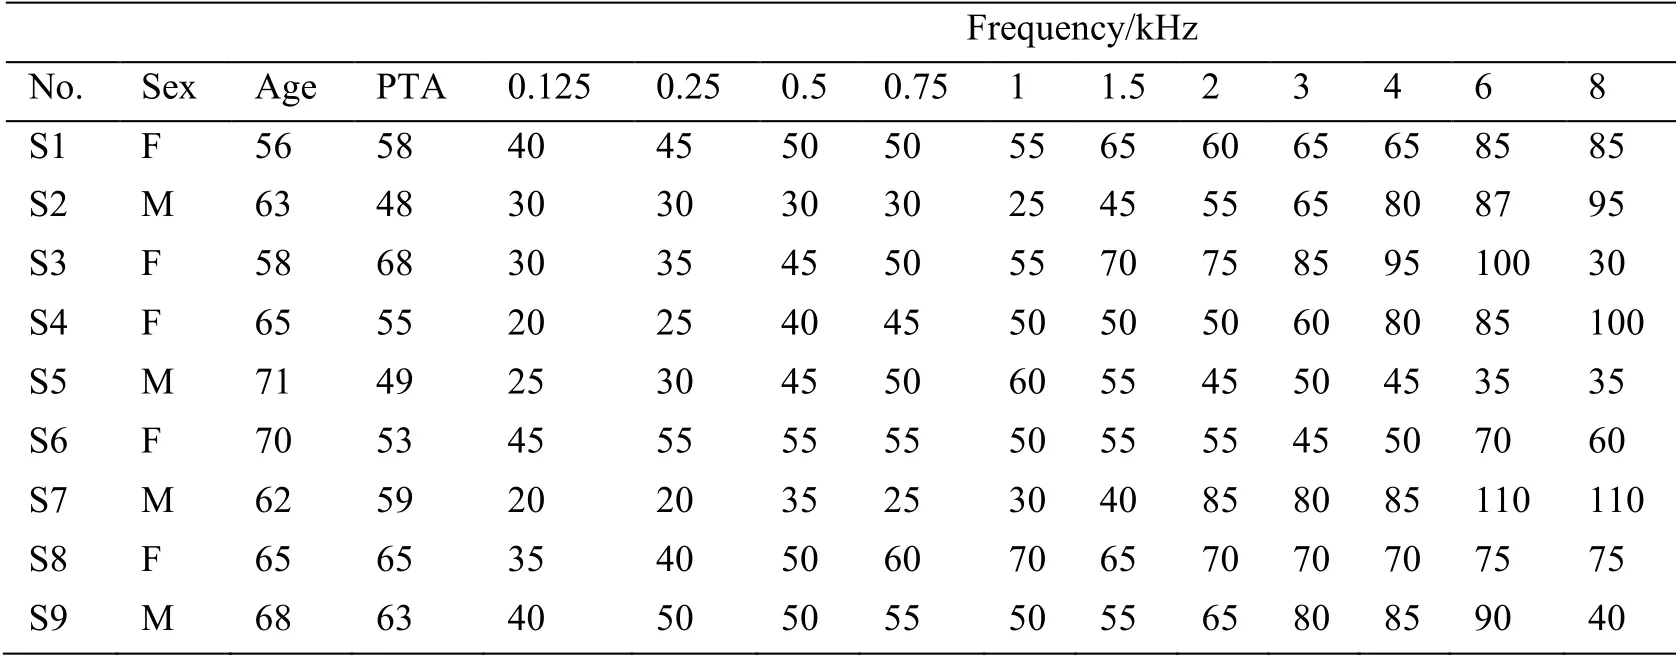
Table 1:Subject’s pure tone hearing threshold/dB
3.2.3 Fitting process
The fitting of the adaptive NFC hearing aid was performed in four steps:(1) determining the maximum audible frequency,(2) determining the cutoff frequency,(3) determining the optimal frequency band retention rate,and (4) determining the optimal mapping method.Although the NFC hearing aid compressed high-frequency signals to lowfrequency ones,some signals of certain frequencies were still inaudible due to severe hearing loss.Therefore,the subject’s maximum audible frequency was determined first,in which signals with a sound pressure level of 65 dB were amplified using the DRC method,and then,the long-term average spectrum of the amplified speech was calculated.The long-term average spectrum and the audiogram intersected,and the intersection point was deemed the subject’s maximum audible frequency [McCreery,Brennan,Hoover et al.(2013)].The cut-off frequency is initially set and then further adjusted according to the subject’s response.The point-to-point mapping method was used for spectrum mapping.Signals below the cutoff frequency were amplified using wide dynamic range compression (WDRC),and signals above the cutoff frequency was first processed with the adaptive NFC algorithm and then amplified with WDRC.The changing of the speech intelligibility was observed with the changing value ofh.Speech intelligibility is expressed by the correct rate of recognized words.In this test,the speech corresponding to the corpus in the monosyllabic word tables were used as the test signal.Tab.2 shows the changes if the average intelligibility of all subjects with varyinghvalues.The test signals were pure speech and noisy speech with signal-to-noise ratios (SNRs) of 15 dB and 5 dB,respectively.The noise signals were babble noise.In Tab.2,the SNR of ∞ represents that the speech was recorded in a quiet environment without artificially added noise.As can be seen in Tab.2,with the increase ofhthe speech intelligibility first increased first and then decreased.It is indicated that on one hand when thevaluehwas too low,some bands were excessively compressed,which led to other bands to expand,giving rise to spectral distortion;on the other hand when thevaluehwas too high,each band was compressed at approximately the same ratio,with the consequence that the audible band could not be effectively used.The experimental results show thath=0.4 was an optimal value.After the noise was added to the speech,the speech intelligibility decreased.In addition,the other two spectral mapping methods were also used to determine the band retention rate.The experimental results were the same as those obtained by the point-to-point mapping method.

Table 2:Average speech intelligibility (%) of subjects under different band retention conditions
The band retention ratehwas set to 0.4,and the speech corresponding to the monosyllabic word table corpus was used as the test signal.The average intelligibility of speech obtained by adaptive NFC using different mapping methods under different conditions is shown in Tab.3.It can be seen from the table that the speech intelligibility obtained by point-to-point mapping method is the highest,followed by superposition mapping method,and the speech intelligibility obtained by spectral segment mapping method is the lowest.These results are inconsistent with previous reports that the spectral segment mapping method performed the best and the sample-to-sample mapping method performed the poorest,with the spectral sample superimposition mapping method in the middle.The reasons are likely as follows:(1) The purposes of the spectral mapping are different.The purpose of spectrum mapping in the reference mentioned above is to reduce the spectral masking effect by mapping the samples in critical band toward the band center.The mapping in this paper is from one band to another band to lower the frequency.2) Different subjects,the average age of the subjects in the reference is 47 years old.The average pure tone hearing threshold at 500,1000,2000 and 4000 Hz was 67 dB.While the average age of the subjects in this study was 64 years old and the PTA was 57 dB.In the reference the spectral mapping was performed from the critical band to the center frequency point,aiming to reduce the spectral masking effect.while in this study,the mapping was performed from one band to another,aiming to lower the frequency.In frequency-lowering algorithms,the benefits gained by the subject were the tradeoff between the obtained audibility and the signal distortion caused by the lowered frequency [Souza,Arehart,Kates et al.(2013)].In the process of sample-to-sample mapping,the relative relationship between the spectral lines does not change.Those with mild hearing loss are more sensitive to signal distortion,which is likely another reason why the sample-to-sample mapping method had the best performance in this study.Thus,in the subsequent experiments,the sample-to-sample mapping method was adopted in spectral mapping.

Table 3:Speech intelligibility (%) under different mapping conditions
3.2.4 Subjective hearing test
The processed speech provides new perceptual clues,and the patient’s speech intelligibility can be improved through training [Ellis and Munro (2015);Habicht,Finke and Neher (2018)].In the experiments,three algorithms were tested separately.First,the CHA algorithm was tested,then the FCHA algorithm was tested,and finally the PFCHA was tested.Before test,the subjects need to listen to the output of the experimental algorithm as much as possible every day.Listening time was no less than 2 hours every day.After 8 weeks,test was conducted in the laboratory.In the subjective hearing test,one di-syllabic word table was chosen randomly for each test,and different subjects were subjected to the same test content in the same test.Fig.4 shows the speech intelligibility results of different subjects.The results show that as the training time increased,the subject’s speech intelligibility improved.Although in some cases the speech intelligibility of some individual patients decreased during training,the patient’s speech intelligibility generally assumed a rising trend.Overall,the average intelligibility of the nine subjects increased from 66.8% to 83.2% with an improvement of 16.3 percentage points.In terms of individual subjects,Subject 1 showed the most improvement in speech intelligibility with an improvement of 21.5 percentage points.And Subject 2 showed the least improvement in speech intelligibility,with an improvement of 11.7 percentage points.The pair-wiset-test results show that after six weeks of training the speech intelligibility on the speech processed with the algorithm proposed in this paper was significantly higher (p<0.001).
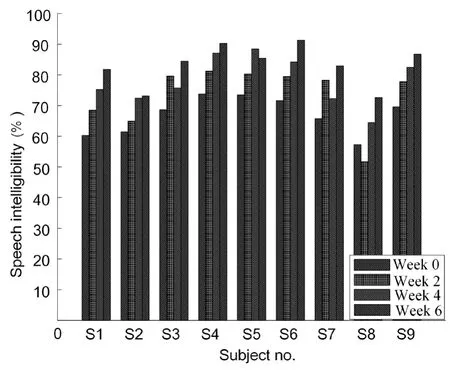
Figure 4:Speech intelligibility under different training time conditions
The intelligibility results on the initials,finals and tones of Chinese using different algorithms are shown in Fig.5,in which intelligibility was represented by the recognition accuracy.The conventional DRC method was designated CHA [Dillon (2012)],the NFC algorithm [Simpson,Hersbach and McDermott (2005)] was designated FCHA,and the adaptive NFC algorithm was designated PFCHA.In DRC method,The NAL-NL2 formula was used in the algorithm to amplify the signal [Keidser,Dillon,Flax et al.(2011)].A pairwise t-test was used to analyze the data,and the statistical significance of difference is indicated with ‘*’ at the lower part of the figure.The test material was derived from the monosyllabic word table,and the recognition results on initials,finals,and tones were statistically analyzed.Relative to the conventional DRC method,among the nine subjects eight showed significantly improved initial recognition accuracy with the algorithm proposed in this paper.Comparing to the conventional NFC method,five of the nine subjects showed significantly improved initial recognition accuracy with the proposed algorithm.In terms of the average of the group,the initial recognition accuracy on the signal processed with the proposed algorithm was significantly improved.Relative to the DRC method,the initial recognition accuracy after processing with the proposed algorithm was significantly improved by 11.5 percentage points (p<0.001).Relative to the NFC algorithm,the initial recognition accuracy improved by 6.4 percentage points (p=0.035).Fig.5(b) shows that relative to the conventional DRC method,after using the NFC algorithm,the final recognition accuracy of Subject 2 significantly decreased,and that of Subject 4 also decreased.Relative to the DRC method,three out of the nine subjects significantly improved their final recognition accuracies,and the remaining subjects also showed improved final recognition accuracies,but the improvement was not statistically significant.Relative to the NFC algorithm,the proposed algorithm showed no statistically significant difference,and the recognition accuracies of the three algorithms were not significantly different between the groups (p=0.297),mainly because the energy of the finals is mainly concentrated in the low-frequency band,while the frequency compression algorithm only processes the signals in the high-frequency band.Fig.5(c) shows the recognition accuracies on the tone of signals processed by the three algorithms.Statistically,the tone recognition accuracies on signals processed by three algorithms showed no significant difference (p=0.643).Theoretically,the frequency compression algorithms keep the low-frequency portion of the signal unchanged and only process the high-frequency portion;tones associated with low-frequency information are therefore not affected by the frequency compression algorithm,which is confirmed by the above experimental results.
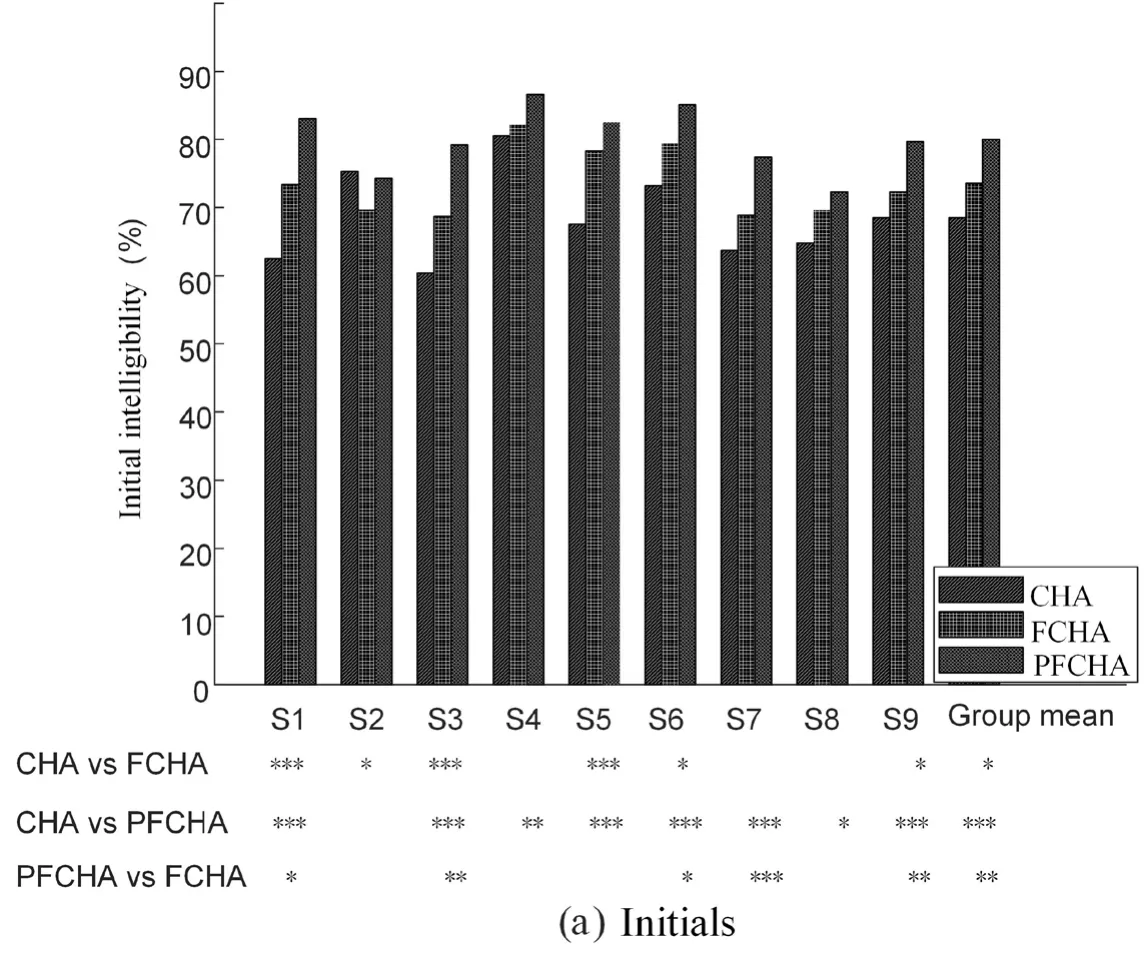
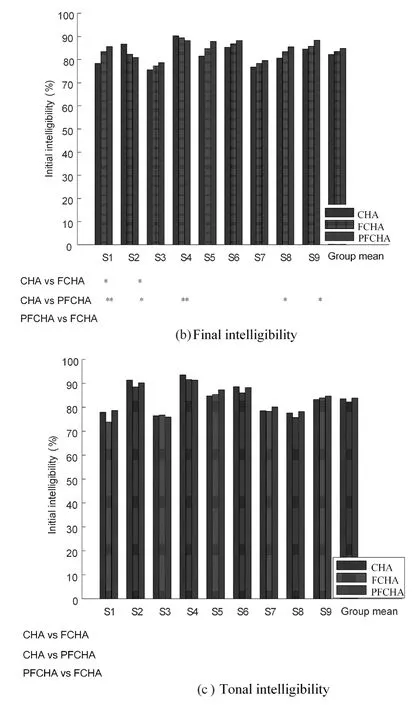
Figure 5:Initial,final and tonal intelligibilities
Statistical significance is indicated by '*':*0.01<p<0.05,**0.001<p<0.01,***p<0.001
Because the speech heard by the hearing aid users in typical communication mostly consists of sentences,to further compare the performances of the different algorithms,each subject was tested on speech intelligibility using sentences.The test material was taken from the sentence table.shows the test results are shown in Fig.6.The pairwisettest was used to analyze the data,and the statistical significance of difference is indicated with ‘*’ at the lower part of the figure.As can be seen from Fig.6,among the nine subjects,Subject 2 did not benefit from the NFC algorithm,the intelligibility on the speech processed by the NFC algorithm was significantly lower than that processed by the DRC algorithm.Subject 8 showed significantly improved intelligibility on the speech processed by the adaptive NFC algorithm.After using the adaptive NFC algorithm,the other subjects showed significantly improved speech intelligibility.In terms of the average of the group,the adaptive NFC algorithm outperformed the DRC algorithm and the NFC algorithm (p<0.05).The NFC algorithm proposed in this study adaptively determines the sub-band compression ratio according to the average energy of the subband,in which a higher average energy of the sub-band corresponds to a lower compression ratio,and vice versa.
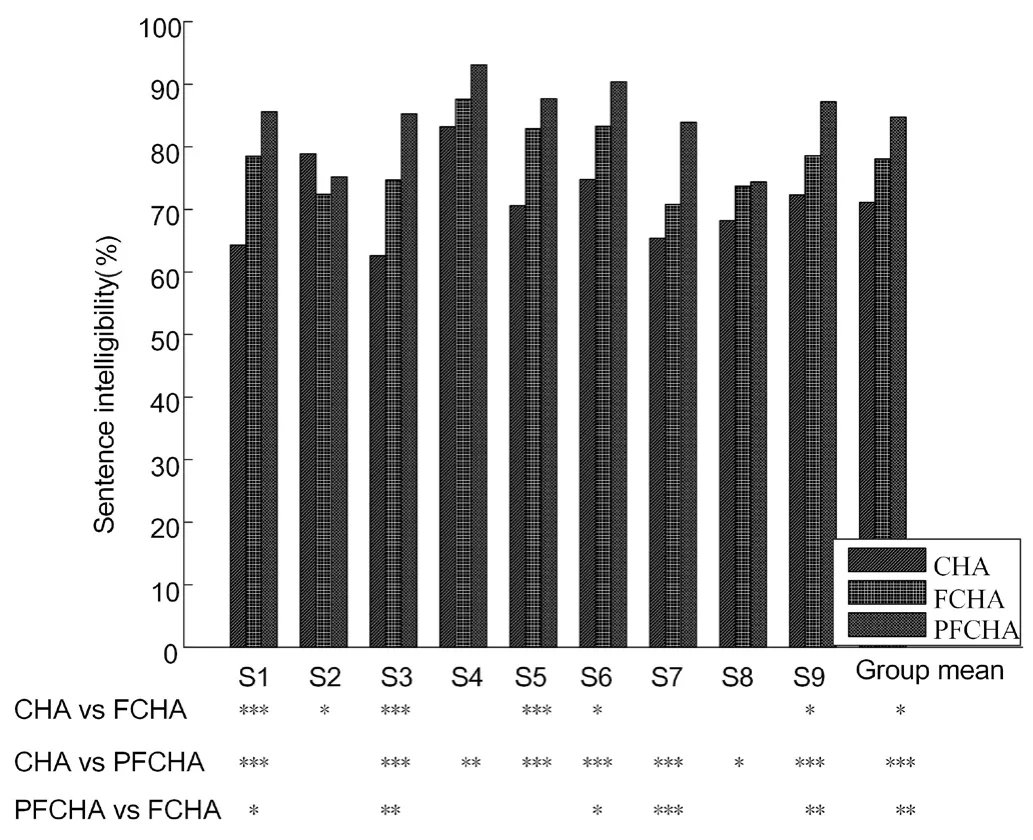
Figure 6:Intelligibility of speech processed by different algorithms.Statistical significance is indicated by '*':*0.01<p<0.05,**0.001<p<0.01,***p<0.001
4 Conclusion
To improve the speech intelligibility of patients with high-frequency hearing loss,an adaptive NFC algorithm based on human auditory characteristics is proposed.To make full use of the residual audible frequency band of the hearing loss patient,the proposed algorithm adaptively determines the sub-band compression ratio according to the average energy of the signals within each critical band to be compressed.The simulation results show that the high-frequency components of the speech signal processed using the proposed algorithm were moved to the low-frequency band while retaining the spectral detail of the bands with a high average signal energy.The results of the speech intelligibility experiment indicate that relative to the conventional WDRC and NFC algorithms,the proposed adaptive NFC algorithm improves the intelligibility on initials and sentence but shows little improvement on the intelligibility of finals or tones.In future,the number of subjects will be increased and further optimized parameters of the frequency compression algorithm will be developed for each patient so that a personalized frequency-lowering hearing aid can be designed.
Acknowledgement:The work was supported by the National Natural Science Foundation of China under Grant Nos.61673108,61871213,61806087,Jiangsu Province Natural Science Research Projects (No.17KJB470002),and Jiangsu University of Science and Technology Youth Science and Technology Polytechnic Innovation Project (No.1132931804)
References
Alexander,J.M.(2013):Individual variability in recognition of frequency-lowered speech.Seminars in Hearing,vol.34,no.2,pp.86-109.
Almaraz,D.;Een,E.;Grafelman,E.;Pacholec,J.;Quintanilla,Y.et al.(2013):Assessing the perceptual contributions of vowels and consonants to Mandarin sentence intelligibility.Journal of the Acoustical Society of America,vol.134,no.2,pp.EL178-EL184.
Dillon,H.(2012):Hearing Aids.Turramurra.New South Wales,Austrailia:Boomerang Press.
Ellis,R.J.;Munro,K.J.(2015):Benefit from,and acclimatization to,frequency compression hearing aids in experienced adult hearing-aid users.International Journal of Audiology,vol.54,no.1,pp.37-47.
Habicht,J.;Finke,M.;Neher,T.(2018):Auditory acclimatization to bilateral hearing aids:effects on sentence-in-noise processing times and speech-evoked potentials.Ear and Hearing,vol.39,no.1,pp.161-171.
Healy,E.W.;Yoho,S.E.;Wang,Y.;Wang,D.(2013):An algorithm to improve speech recognition in noise for hearing-impaired listeners.Journal of the Acoustical Society of America,vol.134,no.4,pp.3029-3038.
Keating,P.;Kuo,G.(2012):Comparison of speaking fundamental frequency in English and Mandarin.Journal of the Acoustical Society of America,vol.132,no.2,pp.1050-1060.
Keidser,G.;Dillon,H.;Flax,M.;Ching,T.;Brewer,S.(2011):The NAL-NL2 prescription procedure.Audiology Research,vol.1,no.1,pp.88-90.
Kulkarni,P.N.;Pandey,P.C.;Jangamashetti,D.S.(2012):Multi-band frequency compression for improving speech perception by listeners with moderate sensorineural hearing loss.Speech Communication,vol.54,no.3,pp.341-350.
Loebach,J.(2018):Online training for perceptual rehabilitation in cochlear implant users.Journal of the Acoustical Society of America,vol.143,no.3,pp.1941.
McCreery,R.W.;Brennan,M.A.;Hoover,B.;Kopun,J.;Stelmachowicz,P.G.(2013):Maximizing audibility and speech recognition with non-linear frequency compression by estimating audible bandwidth.Ear and Hearing,vol.34,no.2,pp.e24-e27.
Moeller,M.P.;Tomblin,J.B.(2015):An introduction to the outcomes of children with hearing loss study.Ear and Hearing,vol.36,no.1,pp.4S-13S.
Moore,B.C.;Popelka,G.R.(2016):Introduction to Hearing Aids.Springer.
Picou,E.M.;Marcrum,S.C.;Ricketts,T.A.(2015):Evaluation of the effects of nonlinear frequency compression on speech recognition and sound quality for adults with mild to moderate hearing loss.International Journal of Audiology,vol.54,no.3,pp.162-169.
Puhan,N.B.;Panda,G.(2018):De-correlated improved adaptive exponential FLAFbased nonlinear adaptive feedback cancellation for hearing aids.IEEE Transactions on Circuits and Systems I:Regular Papers,vol.65,no.2,pp.650-662.
Simpson,A.;Hersbach,A.A.;McDermott,H.J.(2005):Improvements in speech perception with an experimental nonlinear frequency compression hearing device.International Journal of Audiology,vol.45,no.5,pp.281-292.
Souza,P.E.;Arehart,K.H.;Kates,J.M.;Croghan,N.B.;Gehani,N.(2013):Exploring the limits of frequency lowering.Journal of Speech,Language,and Hearing Research,vol.56,no.5,pp.1349-1363.
Souza,P.;Hoover,E.(2018):The physiologic and psychophysical consequences of severe-to-profound hearing loss.Seminars in Hearing,vol.39,no.4,pp.349-363.
Tseng,W.H.;Hsieh,D.L.;Shih,W.T.;Liu,T.C.(2018):Extended bandwidth nonlinear frequency compression in Mandarin-speaking hearing-aid users.Journal of the Formosan Medical Association,vol.117,no.2,pp.109-116.
 Computer Modeling In Engineering&Sciences2019年11期
- Computer Modeling In Engineering&Sciences的其它文章
- Synchronization of Robot Manipulators Actuated By Induction Motors with Velocity Estimator
- Numerical Simulations of the Ice Load of a Ship Navigating in Level Ice Using Peridynamics
- Feature Selection with a Local Search Strategy Based on theForest Optimization Algorithm
- IDSH:An Improved Deep Su pervised Hashing Method for Image Retrieval
- Some Remarks on the Method of Fundamental Solutions for Two-Dimensional Elasticity
- A Parametric Study of Mesh Free Interpolation Based Recovery Techniques in Finite Element Elastic Analysis
