
3-乙基-2-乙酰吡嗪缩4-甲基氨基硫脲Cuギ配合物的合成、结构和DNA结合性质
2019-08-08 06:53:16吕目轩卞琳艳李梦茹吴伟娜
无机化学学报 2019年8期
吕目轩 卞琳艳*, 李梦茹 杨 怡 吴伟娜*, 王 元 陈 忠
(1河南理工大学化学化工学院,河南省煤炭绿色转化重点实验室,焦作 454000)(2江西科技师范大学材料与机电学院,南昌 330013)
Pyrazine-containing thiosemicarbazones (TSCs)have received considerable attention in chemistry and biology,primarily due to their marked and various biological properties[1-6].Currently the most famous drug candidate of this class of compounds is Triapine(3-aminopyridine-2-carboxaldehyde thiosemicarbazone),which entered several phaseⅠandⅡclinical trials as an antitumor chemotherapeutic agent[5-6].In addition,earlier studies revealed that the biological properties of TSCs are often modulated by metal ion coordination[7-10].In this regard,the complexes of TSCs bearing pyrazine unit usually displayed higher biological activity than the parent ligands due to the so-called metal-ligand synergism effect.Our previous work also shows that the interactions of the Ni(Ⅱ) and Zn(Ⅱ) complexes with DNA are stronger than that of the thiosemicarbazone ligand,namely 1-(3-ethylpyrazin-2-yl)ethylidene)-4-methylthiosemicarbazide (HL)[11].
On the other hand,Cu(Ⅱ)containing anticancer agents are promising leads for next generation of metal-based anticancer agents because Cu(Ⅱ)plays a significant role in biological systems[8-9].Furthermore,diverse structures of Cu(Ⅱ)complexes with TSCs could be obtained by varying the corresponding anions.As part of our continuous work on searching for bioactive compounds,three Cu(Ⅱ)complexes with HL were synthesized and characterized by X-ray diffraction methods.In addition,their DNA-binding properties have been investigated in detail.

Scheme 1 Synthetic route of the TSC ligand HL[11]
1 Experimental
1.1 M aterials and measurements
Solvents and starting materials for syntheses were purchased commercially and used as received.Ligand HL was synthesized by the method reported by us[11].Elemental analyses were carried out on an Elemental Vario ELanalyzer.The IR spectra (ν=4 000~400 cm-1)were determined by the KBr pressed disc method on a Bruker V70 FT-IR spectrophotometer.The UV spectra were recorded on a Purkinje General TU-1800 spectrophotometer.DNA-binding properties of the ligand and three complexes were measured using literature method via emission spectra[12].
1.2 Syntheses of com p lexes 1~3
Complex 1 was synthesized by reacting HL(0.5 mmol)with equimolar amount of CuBr2,CuCl2or CuSO4in methanol/DMF (10 mL,1∶1,V/V)solution at room temperature,respectively.The crystals suitable for X-ray diffraction analysis were obtained by evaporating the reaction solutions at room temperature.
1:Black blocks.Yield:77%.Anal.Calcd.for C13H21N6OSBrCu(%):C,34.48;H,4.67;N,18.56;S,7.08.Found(%):C,34.25;H,4.86;N,18.28;S,6.89.FT-IR (cm-1):ν(N=C)1 523,ν(N=C,pyrazine)1 456,ν(S=C)858.
2:Black plates.Yield 65%.Anal.Calcd.for C10H18N5O2SClCu(%):C,32.35;H,4.89;N,18.86;S,8.63.Found(%):C,32.15;H,4.99;N,19.01;S,8.53.FT-IR (cm-1):ν(N=C)1 541,ν(N=C,pyrazine)1 498,ν(S=C)856.
3:Black rods.Yield 53%.Anal.Calcd.for C21H34N10O6S3Cu2(%):C,33.82;H,4.59;N,18.78;S,12.90.Found(%):C,33.45;H,4.39;N,18.75;S,12.79.FT-IR (cm-1): ν(N=C)1 541, ν(N=C,pyrazine)1 500,ν(S=C)860.
1.3 X-ray crystallography
The X-ray diffraction measurement for complexes 1 (crystal size:0.16 nm×0.12 nm×0.10 mm),2 (crystal size:0.25 nm×0.12 nm×0.04 mm),and 3 (crystal size:0.40 nm ×0.20 nm ×0.20 mm)was performed on a Bruker SMARTAPEXⅡCCD diffractometer equipped with a graphite monochromatized Mo Kα radiation (λ=0.071 073 nm)by usingφ-ω scan mode.Semi-empirical absorption correction was applied to the intensity data using the SADABS program[13].The structures were solved by direct methods and refined by full matrix least-square on F2using the SHELXTL-97 program[14].All non-hydrogen atoms were refined anisotropically.The H atoms for the O1 and O2 atoms of complex 2 were not added due to the special symmetric positions of these atoms.All the other H atoms were positioned geometrically and refined using a riding model.Details of the crystal parameters,data collection and refinements for complexes 1~3 are summarized in Table 1.
CCDC:1884254,1;1884255,2;1884256,3.

Table 1 Crystal data and structure refinement for com plexes 1~3
2 Results and discussion
2.1 Crystal structures description
A diamond drawing of complexes 1~3 is shown in Fig.1.Selected bond distances and angles are listed in Table 2.The TSC ligand is anionic with C-S bond length in a range of 0.168 4(4)~0.173 2(4)nm in all three complexes.As shown in Fig.1a and 1b,the structures of complexes 1 and 2 are similar,and the center Cuギion in each complex is coordinated by one thiosemicarbazone ligand with N2S donor set and one halide ion (bromide for 1 and chloride for 2),thus possessing a distorted planar square coordination geometry.The intermolecular N-H…O hydrogen bond between the complex and free DMF molecule is found in the crystal of 1.It should be noted that the O1 and O2 atoms occupy in special symmetric position in complex 2 and the H atoms for them are not added,while both of crystal water molecules are involved in a ladder-like supramolecular network,including intermolecular N-H…O,O-H…N,O-H…Cl and O-H…O hydrogen bonds.
In the asymmetric unit of complex 3,there exist one dimeric Cuギcomplex,one free water and one methanol molecules.Two Cuギions were doubly bridged by two S atoms of two TSC ligands to form a Cu2S2core with Cu…Cu distance of 0.318 0 nm.Each of the Cuギions is also coordinated by two N atoms from one TSC ligand and one O atom from theη2-SO42-anion at the outer axial site.According to the Addison rule[15],the geometric indexτis 0.136 and 0.161 for Cu1 and Cu2,respectively,indicating that the coordination geometry of each Cuギion is best described as a distorted tetragonal pyramid rather than trigonal biyramid.In addition,in the solid state,intermolecular N-H…O,O-H…N,and O-H…O hydrogen bonds are helpful to construct a three dimensional supramolecular network.

Fig.1 ORTEP drawing of 1 (a),2 (b),and 3 (d)with 30%thermal ellipsoids;(c)Ladder-like structure formed via N-H…O hydrogen bonds in complex 2
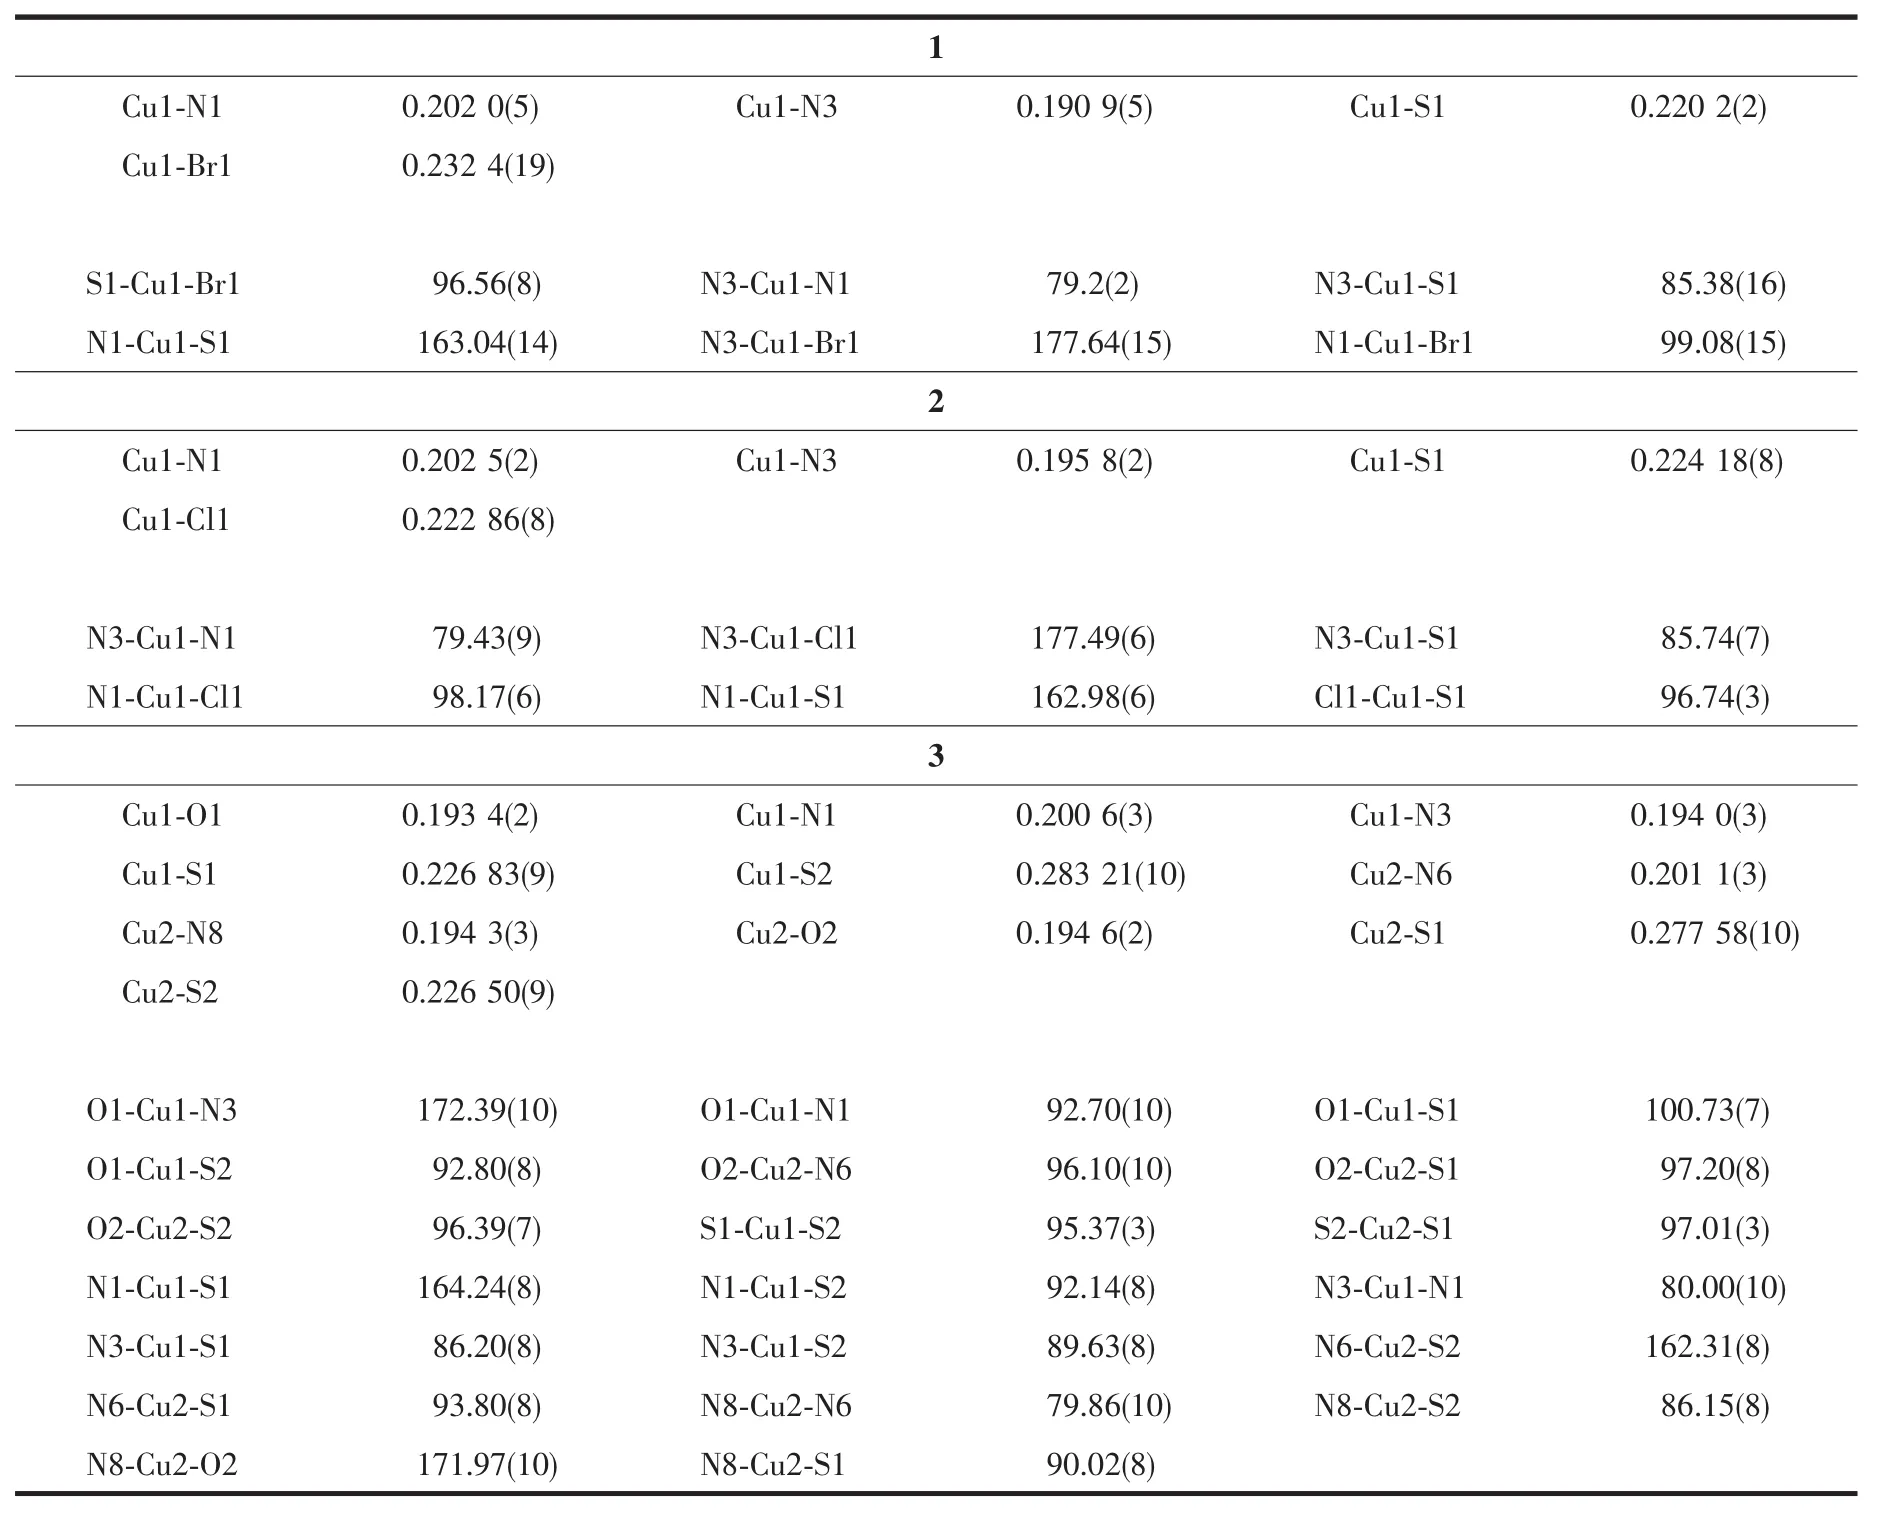
Table 2 Selected bond lengths(nm)and angles(°)in complexes 1~3
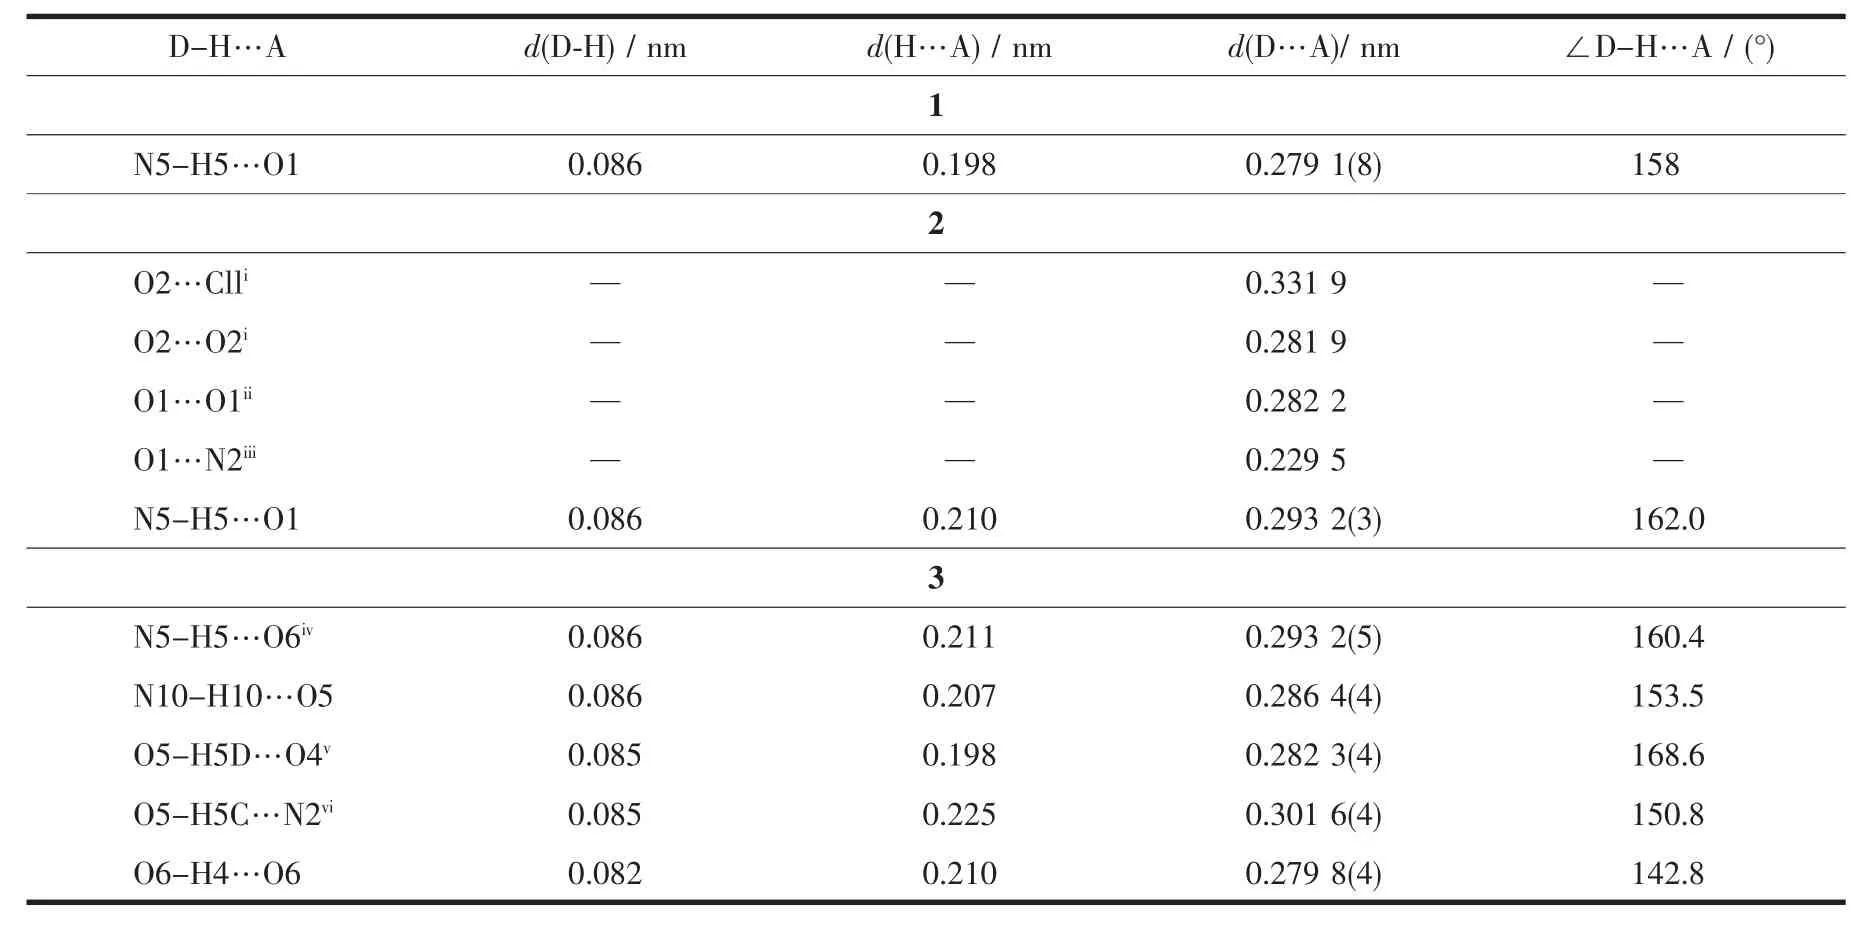
Table 3 Hydrogen bond parameters for complexes 1~3
2.2 IR spectra
The infrared spectral bands most useful for determining the coordination mode of the ligand are the ν(N=C),ν(N=C,pyrazine)and ν(S=C)vibrations.Such three bonds of the free TSC ligand were found at 1 544,1 502 and 863 cm-1[11],respectively,while they shifted to lower frequency in complexes 1~3,clearly indicating the coordination of imine N,pyrazine N and S atoms[1-2,16-17].It is in accordance with the X-ray diffraction analysis result.
2.3 UV spectra
The UV spectra of HL[11]and complexes 1~3 in DMSO solution (concentration:10 μmol·L-1)were measured at room temperature (Fig.2).The spectrum of HL featured only one main band located around 299 nm (ε=34 026 L·mol-1·cm-1)[11],which could be assigned to characteristic π-π*transition of pyrazine unit[12].Similar bands were observed at 324 nm (ε=39 263 L·mol-1·cm-1),327 nm (ε=18 260 L·mol-1·cm-1)and 317 nm (ε=139 830 L·mol-1·cm-1)in complexes 1~3,respectively.However,the new bonds at 437 nm(ε=27 771 L·mol-1·cm-1),432 nm (ε=16 202 L·mol-1·cm-1)and 433 nm (ε=87 930 L·mol-1·cm-1)could be observed in spectra of 1~3,respectively,probably due to the ligand-to-metal charge transfer (LMCT)[16].This indicates that an extended conjugation is formed in anionic ligand after complexation in the complexes.
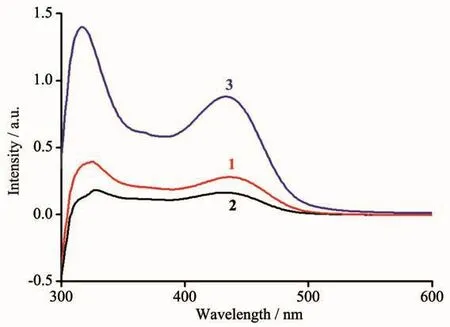
Fig.2 UV spectra of complexes 1~3 in DMSO solution at room temperature
2.3 EB-DNA binding study by fluorescence spectrum

Fig.3 Emission spectra of EB-DNA system in the presence of complexes 1~3 (a~c,respectively)
It is well known that EB can intercalate into DNA to induce strong fluorescence emission.Competitive binding of other drugs to DNA and EB will result in displacement of bounding EB and a decrease in the fluorescence intensity[15].Fig.3 shows the effects of the ligand and complexes 1 ~3 (10 μmol·L-1)on the fluorescence spectra of EB-DNA system.The fluorescence intensities of EB bound to ct-DNA at about 600 nm showed remarkable decreasing trend with the increasing concentration of each tested compound,indicating that some EB molecules are released into solution after the exchange with the compound.The quenching of EB bound to DNA by the compound is in agreement with the linear Stern-Volmer equation:I0/I=1+Ksqr[16],where I0and I represent the fluorescence intensities in the absence and presence of quencher,respectively;Ksqis the linear Stern-Volmer quenching constant;r is the ratio of the concentration of quencher and DNA.In the quenching plots of I0/I versus r,Ksqvalues are given by the slopes.The Ksqvalues were 0.484,1.465,1.133 and 1.827 for HL[11]and complexes 1~3,respectively,indicating that interaction of the complexes with DNA is much stronger than HL[11].This is probably due to the structure rigidity and metal-ligand synergism effect of the complexes[13].Complex 3 exhibits the highest activity among the three complexes,which is consistent with the demonstration that the activity of polynuclear complex is stronger than that of mononuclear one[18].
3 Conclusions
Three complexes with a pyrazine-containing thiosemicarbazone ligand were prepared and characterized by single-crystal X-ray crystallography.In addition,the fluorescence spectra indicated that the interaction of the complexes to DNA is stronger than that of the ligand HL.Particularly,complex 3 exhibits the highest activity among the three complexes,which is consistent with the demonstration that the activity of polynuclear complex is stronger than that of mononuclear one.Further research is needed to better determine the relationship between structures and activities.
猜你喜欢
无机化学学报(2024年1期)2024-01-20 03:55:50
化工职业技术教育(2021年5期)2021-11-09 03:10:40
化工职业技术教育(2021年1期)2021-03-15 06:57:44
化工学报(2016年3期)2016-03-14 08:37:00
中国资源综合利用(2016年7期)2016-02-03 03:00:19
浙江理工大学学报(自然科学版)(2015年7期)2015-03-01 02:54:14
中国酿造(2015年4期)2015-01-26 22:50:40
火炸药学报(2014年5期)2014-03-20 13:17:51
火炸药学报(2014年1期)2014-03-20 13:17:22
无机化学学报(2014年9期)2014-02-28 17:33:07
