New shakedown criterion and permanent deformation properties of unbound granular materials
Ali Alnedawi·Kali Prasad Nepal·Riyadh Al-Ameri
Abstract Unbound granular material specifications for road pavements in Australia are primarily based on physical material specification rather than mechanical characterisation.This simplified approach does not reflect the actual material performance under repeated dynamic traffic loads.There is a little information available on the influence of the local crushed rock properties and compacted layer properties on permanent deformation(PD).This study aims to characterise the local unbound granular materials in Victoria according to their PD behaviour under repeated loads and to develop a suitable shakedown criterion that could describe the PD of the tested materials to simplify the flexible pavement design.Repeated-load triaxial tests were conducted over several samples with a range of moisture contents,gradations,densities,and stress conditions.The laboratory test results showed that PD behaviour was influenced by several factors.In addition,the tested subbase-specified unbound granular materials reflect high PD resistance that is almost equivalent to basequality unbound granular materials.This may indicate that current requirements for the subbase-quality unbound granular materials are over-prescribe.Moreover,as the existing shakedown criterion was not applicable for the multi-stage repeated-load triaxial test and the local tested materials,a new shakedown criterion and new boundaries are proposed based on the PD behaviour.In the proposed criterion,the shakedown ranges are identified based on the curve angle of the PD vs.logarithm of the number of loading cycles,and this new criterion was validated using several materials from existing literature.The local tested base and subbase materials can be assigned as Range A when PD<1%,Range B when 1%<PD<3%,and Range C when PD>3%.The proposed criterion could provide a useful and quick approach to assess the PD of the unbound granular materials with both single and multistages of stresses.
Keywords Flexible pavement·Unbound granular materials·Repeated load triaxial test·Permanent deformation·Shakedown theory
1 Introduction
Unbound granular materials(UGMs)play a fundamental role as base and subbase layers in flexible road pavements by distributing traffic loads from the surface layer into the subgrade[1].The strength of UGMs under repeated loads is commonly characterised by the permanent deformation(PD),which is the accumulated plastic strain[2,3].Several studies have been conducted to understand the PD behaviour of UGMs,the main factors that affect the PD response of UGMs under repeated traffic loads.These factors can be grouped into two broad categories:Stressrelated factors include,among others,applied stresses,number of cycles,load duration,and loading frequency.Material-related factors include,among others,density,gradation,aggregate type,particle shape,and moisture content[4–7].Some of these factors are found to have a distinct effect on the PD of UGMs,while some other factors are found to have an insignificant influence.
In Australia,as well as other countries,UGM specifications for road pavement are primarily based on the basic material specification(i.e.some fundamental properties)rather than engineering material characterisation (i.e.mechanical behaviour)[8].The UGMs are generally specified according to the physical properties(e.g.gradation,plasticity index,liquid limit,dry density,and moisture content),stiffness and strength,including the Los Angeles(LA)abrasion value and California bearing ratio(CBR)[9].However,the LA test is used to evaluate the durability of the coarse particles only,while the CBR is a static load test,which does not reflect the dynamic field traffic loads.The guide to pavement technology in Australia by Austroads[9]has explicitly reported that no study has quanti fi ed the influence of the crushed rock properties on PD.Nevertheless,limited studies from overseas were highlighted in this guide.The selection of the UGMs for pavement layers could be more practical when indicated by the strength and stiffness behaviours under repeated loads.In addition,an increase in pavement service life,an improvement in construction quality,and a reduction in asphalt thickness could be achieved by a proper selection of UGMs in the base layer[10].
The PD under repeated loads has been described using the shakedown theory in many studies[11–23].The shakedown theory has been applied on base and subbase materials by adopting a specific visual criterion and boundaries as proposed by Werkmeister et al.[24].Chen et al.[25]tested several specimens with the presence of geogrids.They updated the boundaries of Werkmeister et al.[24]to be suitable for the reinforced samples.Gu et al.[20]questioned the existing Werkmeister’s shakedown criterion since it was developed merely based on a limited number of repeated-load triaxial tests(RLTTs).Eventually,they concluded that the criterion is not suitable to the tested UGMs in Texas.Moreover,Qian et al.[26]claimed that the existing shakedown criterion is based on aggregate or sand,which might be not applicable for soft clay under repeated loads.Therefore,a new method has been proposed to define the shakedown boundaries based on the effective cyclic stress ratio.
It has been noticed that the existing criteria are based on a limited number of RLTTs.It is not known whether these criteria are applicable for the UGMs in Victoria or for multi-stages of stresses.Therefore,the shakedown boundaries of Werkmeister et al.’s[24]and Gu et al.’s[20]criteria need to be reassessed based on local UGMs and RLTT data of multi-stages of stresses.
To characterise the PD behaviour of the local base/subbase materials,the present paper reports the results of laboratory experiments of four main local UGMs used in Victoria,Australia,for pavement design purposes.The existing shakedown concepts were reassessed using the RLTT data.A new shakedown concept with new boundaries was proposed to refine the existing shakedown criteria.Subsequently,the new shakedown criterion was validated using several results from the existing literature.In the next section,a review of the shakedown theory was provided.

Fig.1 Limits of shakedown theory
2 Shakedown theory
Shakedown is a concept from the plasticity theory that considers the irreversible responses of materials[27].The shakedown theory was first developed to depict the behaviour of conventional structures under repeated loads;then,it was applied to analyse the behaviour of metal surfaces under rolling and sliding repeated loads[28].Sharp and Booker[29]were the first to introduce the application of shakedown concept in pavement design.The same theory with a new concept was used to characterise the PD of UGMs[24,30].According to the shakedown theory,three different ranges of PD have been categorised:plastic shakedown(Range A),creep shakedown(Range B),and incremental collapse(Range C),as shown in Fig.1.When the exerted repeated loads are sufficiently low,the accumulation of PD under a certain number of repeated loads almost ceases at a constant level,and the response then is purely elastic and called as Range A.If moderate repeated loads are applied and exceed the elastic limit,the increase in the accumulated PD will be directly proportional to the number of repeated loads,and then,the strain decreases to a constant level(Range B).At higher repeated loads,the accumulated PD increases dramatically leading to a failure by shear deformation or overstressing of the UGMs[12,24].In the flexible pavement design,Range A and Range B are permitted and Range C should be avoided[31,32].
Dawson and Wellner[30]proposed a method to observe the shakedown ranges by plotting the PD rate(per load cycle)versus PD.The ranges were identified visually byshapes and slopes.Similarly,Werkmeister[18]presented the shakedown ranges by visual inspection of the PD curves by plotting the PD rate(per load cycle)versus number of load cycles.A convex downwards line in PD described Ranges A,whereas a concave outwards increment depicted Range C,and Range B showed an intermediate response.Werkmeister[18]concluded that Range C could be observed in pavements as a result of the shear failure of the UGMs.However,Lekarp et al.[5]indicated the lack of support for this concept since PD of pavements is an incremental and not a sudden failure.

Table 1 Shakedown range boundaries
Subsequently,Werkmeister et al.[32]proposed boundaries for the shakedown ranges.These boundaries describe the shakedown ranges with respect to the number of loading cycles as shown in Table 1.Despite this,the same study stated that the PD behaviour depends on the applied stress levels.Therefore,several tests on multiple specimens are required in order to cover different stress levels,which makes this approach cost prohibitive and time-consuming.Rahman and Erlingsson[33]applied the same boundaries on multi-stages RLTT data.The results showed that some materials started with Range B then Range C followed by Range A,which makes the characterisation according to the shakedown theory confusing,particularly when the same tested specimen reflects the three ranges inversely from Range C to Range A in the same test.Gu et al.[20]tried to employ the same boundaries on a single stage of RLTT and found that theses boundaries were not appropriate for the local UGMs in Texas.Thus,new boundaries were proposed as tabulated in Table 1.
The aforementioned literature review highlights that the previous studies focused on the shakedown limits.However,the approach to identify the shakedown ranges that the boundaries are based on is still not clear since the shakedown ranges need to be assigned before establishing any boundaries.Moreover,the previous studies clearly found that the boundaries are usually not suitable for different materials or multi-stages of stresses.Therefore,reassessment of the existing criteria according to the local UGMs and the applied stresses is required.
3 Experimental investigation
This section presents the descriptions and properties of the tested base/subbase materials,specimen preparation,and the RLTT procedure.
3.1 Materials
The current specification of VicRoads[34]in Victoria classifies high-quality crushed rocks into four classes with the main test requirements as tabulated in Table 2.There are no local standards or guides assigning the UGMs according to their mechanical properties.
The UGMs used in this study were collected from different quarries in Victoria.Four types of crushed rocks were selected for the experimental investigation:Class 2 basalt(CL2B),Class 2 granite(CL2G),Class 3 basalt(CL3B),and Class 4 basalt(CL4B),as shown in Fig.2.The tested materials passed all the VicRoads test requirements specified in Table 2.In addition,this study performed additional tests and characterisation as shown in Table 3.It should be noted that the final number following the sample’s name(e.g.CL2B1)refers to different gradations as shown in Fig.3.
In order to investigate the effect of moisture content,dry density,and gradation on PD,and to have a reasonable testing matrix,an experimental design was developed by altering these variables to prepare different samples as shown in Table 4.Two replicates were prepared for each case.
3.2 Laboratory experiments
The materials were sampled in accordance with AS1289.1.1[35].A sieve analysis was performed according to AS1289.3.6.1[36].Maximum dry density(MDD)and optimum moisture content(OMC)were determined according to AS1289.5.2.1[37].
RLTT was the main test used in this study to investigate the PD of the UGMs.This test has been acknowledged as one of the most reliable simulations to the field trafficloading configurations[38].As shown in Fig.4,the main components of the system were a pneumatic controller(to control the confining pressure),digital control system(to collect and store data),load frame,linear variable differential transformer(LVDT),actuator motor(to apply repeated loads),and triaxial chamber(to maintain the confining pressure).The testing procedure includes applying repeated deviator stress(σd)with a constant confining pressure(σ3)as tabulated in Table 5.According to Austroads,AG-PT/T053[39],the stress levels in Table 5 cover typical ranges of repeated deviator stress and static confining stress for the purpose of examining the stressdependent strain characteristics of base materials.Vertical trapezoidal pulse with 0.5 Hz loading frequency was applied.The resting time was twice as long as the loading period[40,41].The test programme was in accordance with AG-PT/T053[39].The specimens were all cylindrical measuring 100 mm in diameter and 200 mm in length.The preparation process was in accordance with AG-PT/T053[39].It is worth mentioning that AG-PT/T053[39]considers a single confining pressure(50 kPa)to reduce the factor that could affect the incremental PD.

Table 2 Crushed rocks and test requirements[34]

Fig.2 Local delivered UGMs
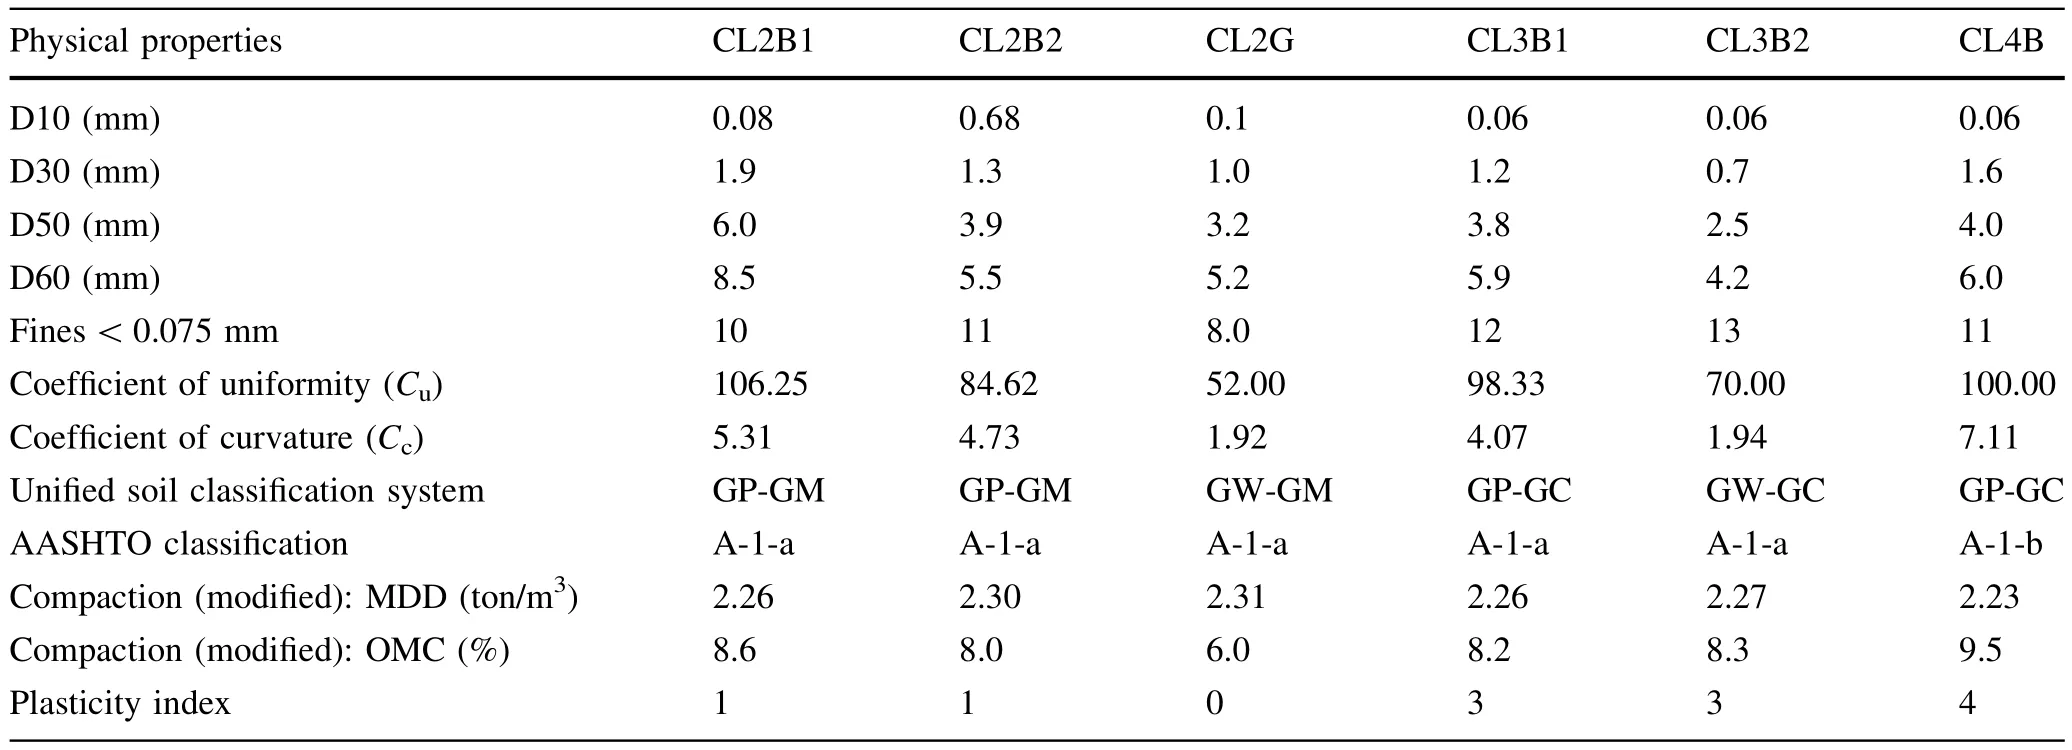
Table 3 Physical and geotechnical properties of the tested materials

Fig.3 Particle size distribution of the tested materials
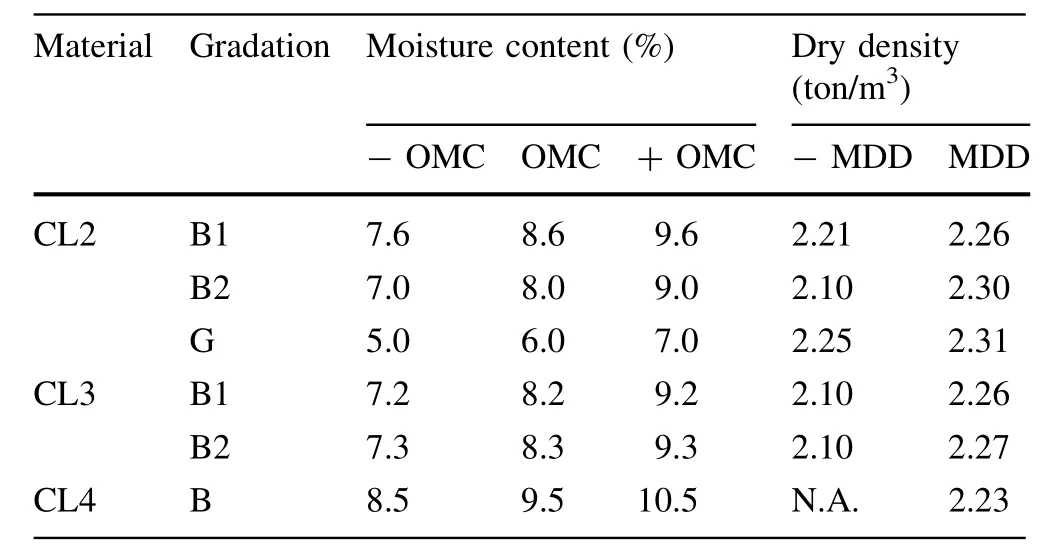
Table 4 PD testing matrix
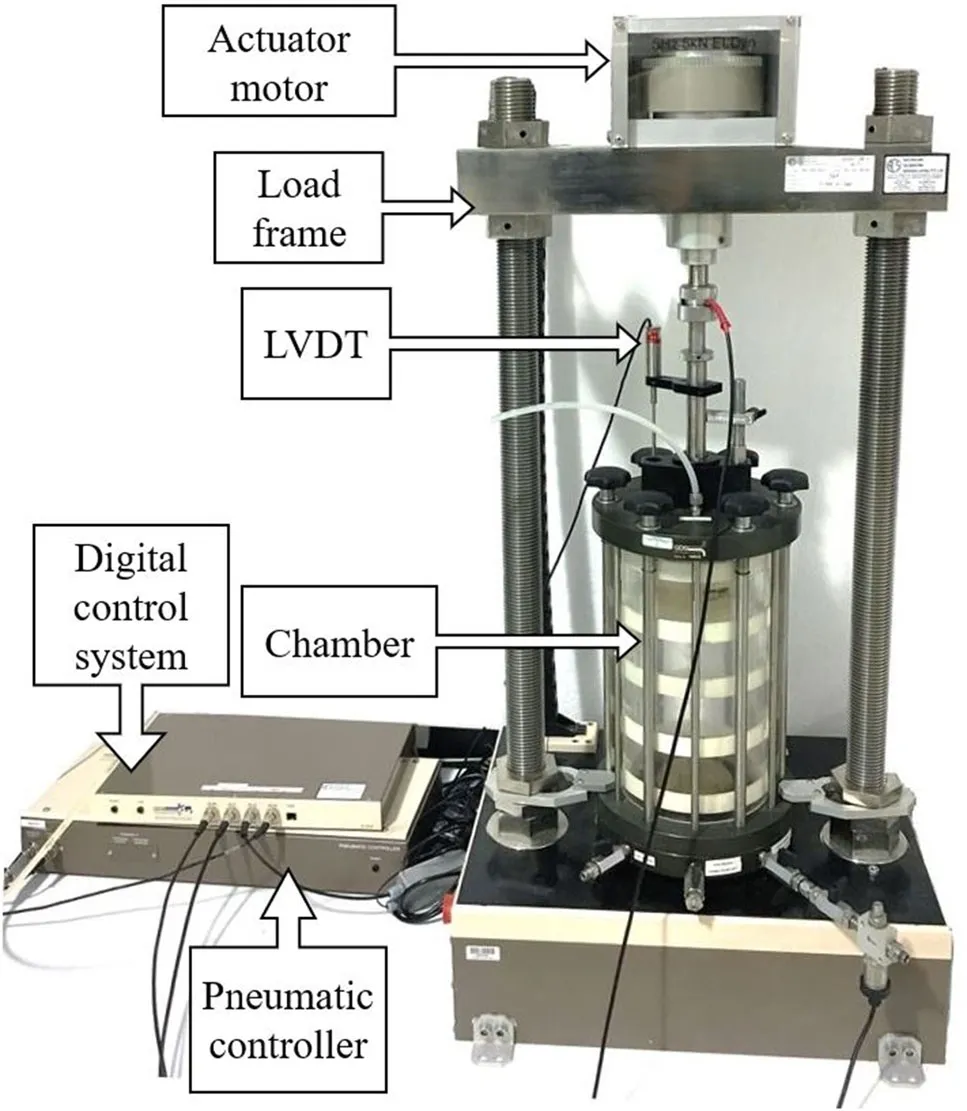
Fig.4 Repeated-load triaxial machine

Table 5 Stress sequences for PD test
Figure 5a–f depicts specimen preparation for the RLTT in sequence.Each specimen was compacted into a threesplit cylindrical mould considering the desired moisture content and dry density using modified compactive effort.The final specimen size was 200 mm in height and 100 mm in diameter.The cylindrical specimen was encased by the rubber membrane.Two O rings were used to con fi ne the top and the bottom of the membrane to prevent the water media from in filtrating into the specimen.The preparation process was applied in accordance with AG-PT/T053[39].
4 Experimental results
In this section,the RLTT results are discussed to characterise the PD behaviour of the local base/subbase materials for pavement design purpose.
A certain amount of moisture in UGMs is essential for better compaction and pavement performance.In flexible pavements,base and subbase layers are generally compacted to achieve MDD.The presence of water facilitates the lubrication of the unbound granular particles,which allows them to slide and roll during the compaction process to reach the desirable dry density.Figure 6a–c shows the effect of moisture content on the PD of the tested materials under the three stress stages tabulated in Table 5.The results are presented in three separate graphs to represent each stress stage separately and show the exclusive effect of moisture content during each stage.Figure 6c shows that CL2B1 has a PD of 1.2%,2.0%,and 2.8%when the specimen is prepared at a moisture content of 7.6%,8.6%,and 9.6%,respectively.Similarly,the PD of CL4B prepared at a moisture content of 8.5%,9.5%,and 10.5%was 1.0%,1.5%,and 2.9%,respectively.When the moisture content increases,the PD of UGMs also increases.This observation is consistent with the previous studies conducted by Azam et al.[42],Barksdale[43],Dawson et al.[44],Rahman and Erlingsson[45],and Saevarsdottir and Erlingsson[46].Generally,it has been found that the moisture is sensitive to the fines content.When the fines content increases,the impact of the moisture content on the PD also increases as found for samples CL2B1,CL2B2,and CL2G.It is worth mentioning that the pore water pressure is not considered in this investigation as the specimens were tested under drained conditions.The specimens that were tested at a moisture content below the optimum resulted in a smaller PD than at OMC and above OMC.However,UGMs compacted at a moisture content below OMC were difficult to control in the field.Low moisture content affects the workability of the compaction process which requires more effort to achieve the MDD.Excessive compaction makes the UGMs more susceptible to an early disintegration into smaller particles.
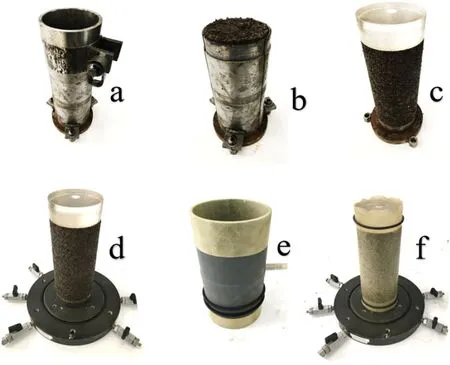
Fig.5 Specimen preparation
Figure 7a–c shows the PDs at different densities(at OMC)under the three stress stages.Density is inversely proportional to PD,and thus,as the density increases and MDD is approached,the resistance to deterioration increases.This observation is in line with previous studies such as Barksdale[43],Thom and Brown[47],Dodds et al.[48],and Alnedawi et al.[49].Table 6 shows that when the level of compaction(i.e.dry density)is 91%MDD and 93%MDD,a dramatic collapse is noticed in the PD resistance of CL2B2,CL3B1,and CL3B2,respectively.For instance,at the end of the PD test,the reduction in PD resistance of CL2B2 was 51.5%when the specimen was prepared with 91%from the MDD.The base materials CL2B1 showed an acceptable decrease in PD resistance when the dry density was 98%MDD.Surprisingly,the other base material CL2G showed a massive reduction in the PD resistance when 98%MDD was used.The reason behind that could be the non-plastic fines which result in loose samples when densities less than the MDD are used.
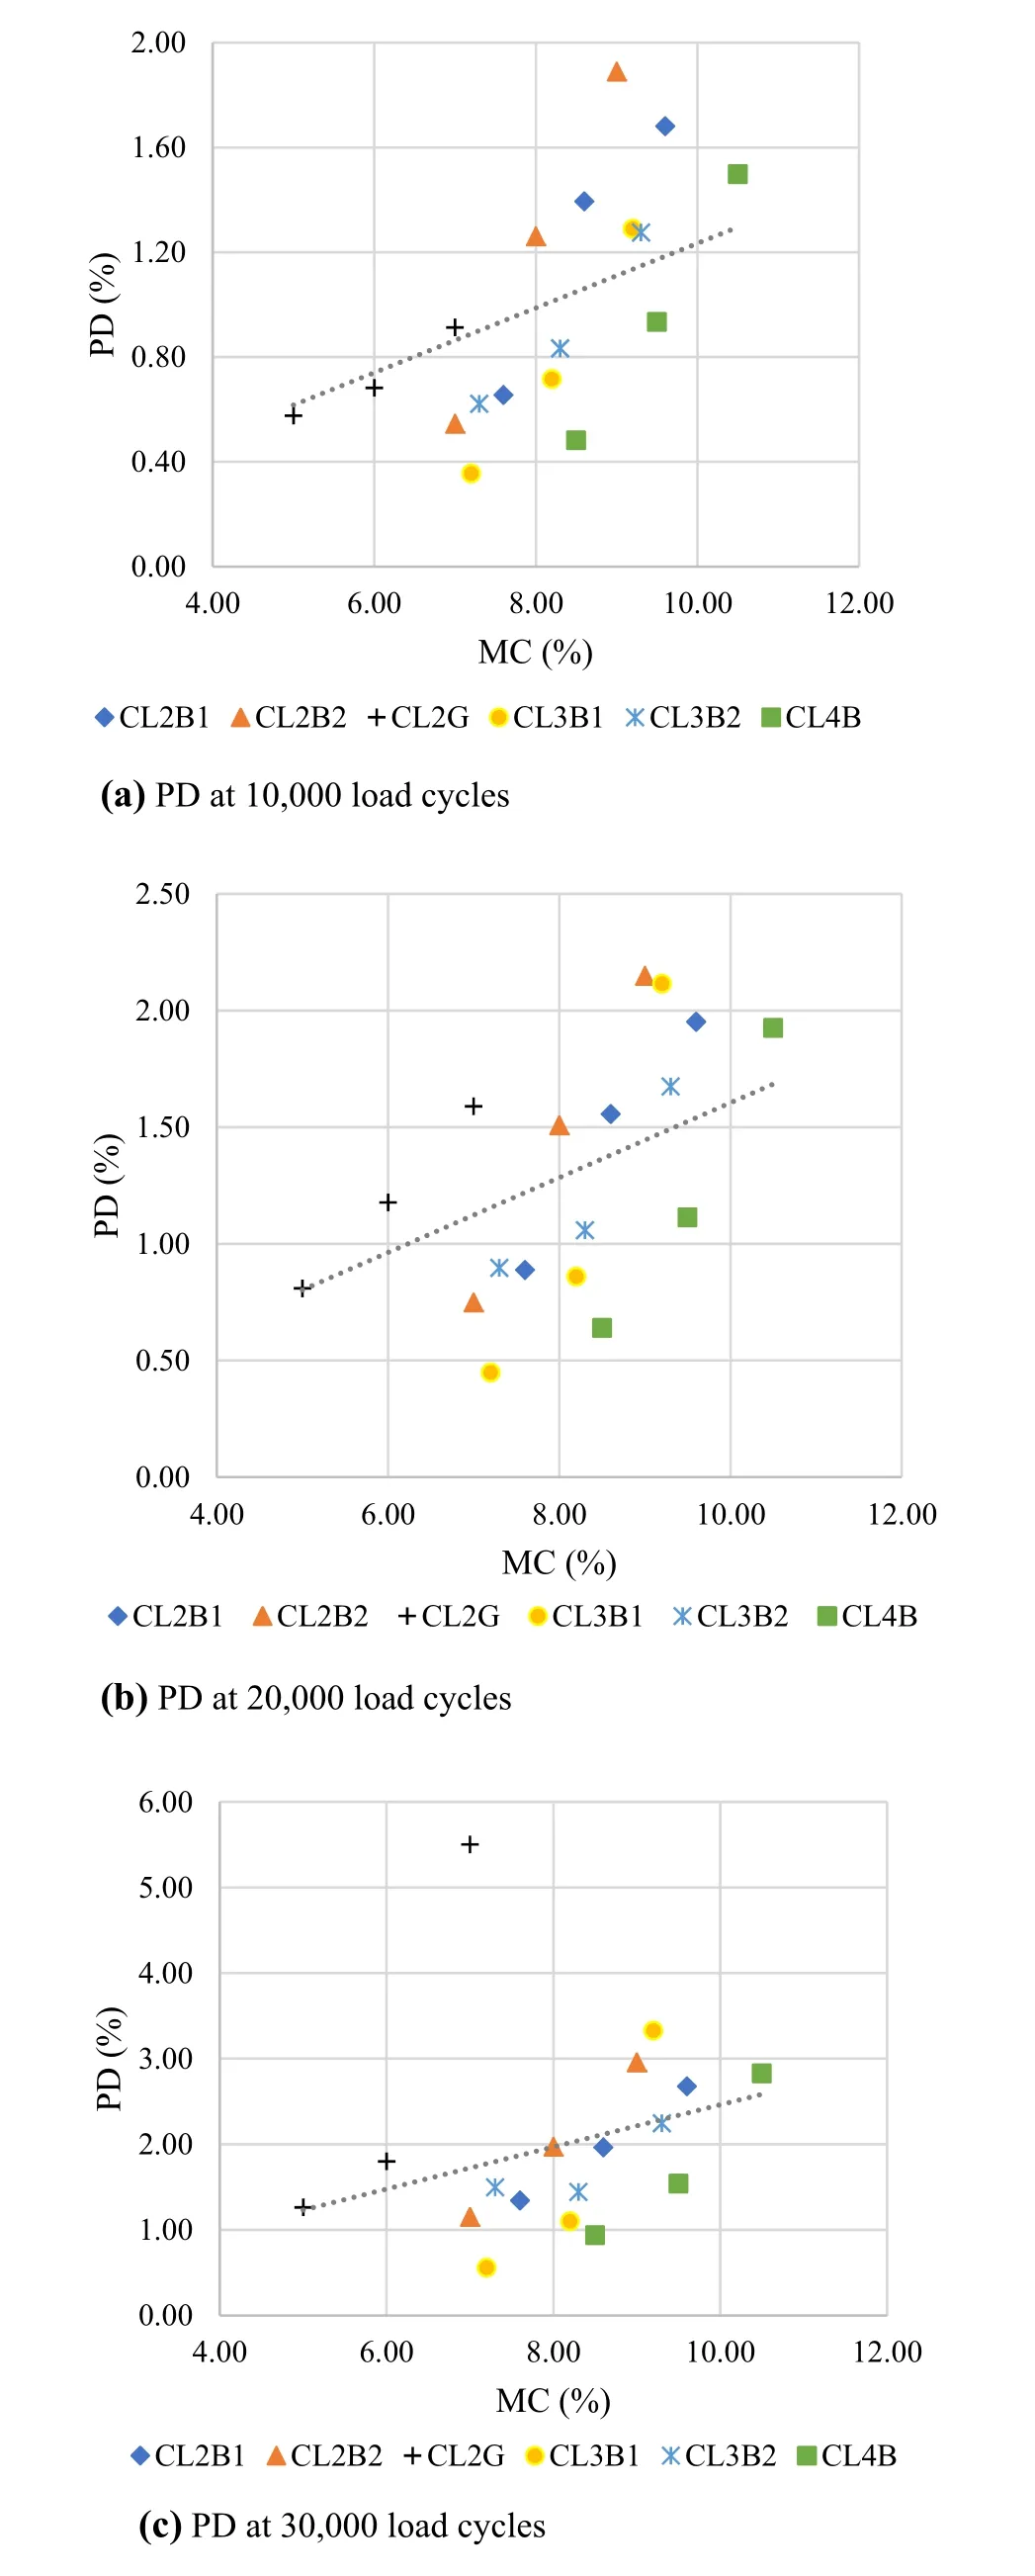
Fig.6 Effect of moisture content on PD of UGMs
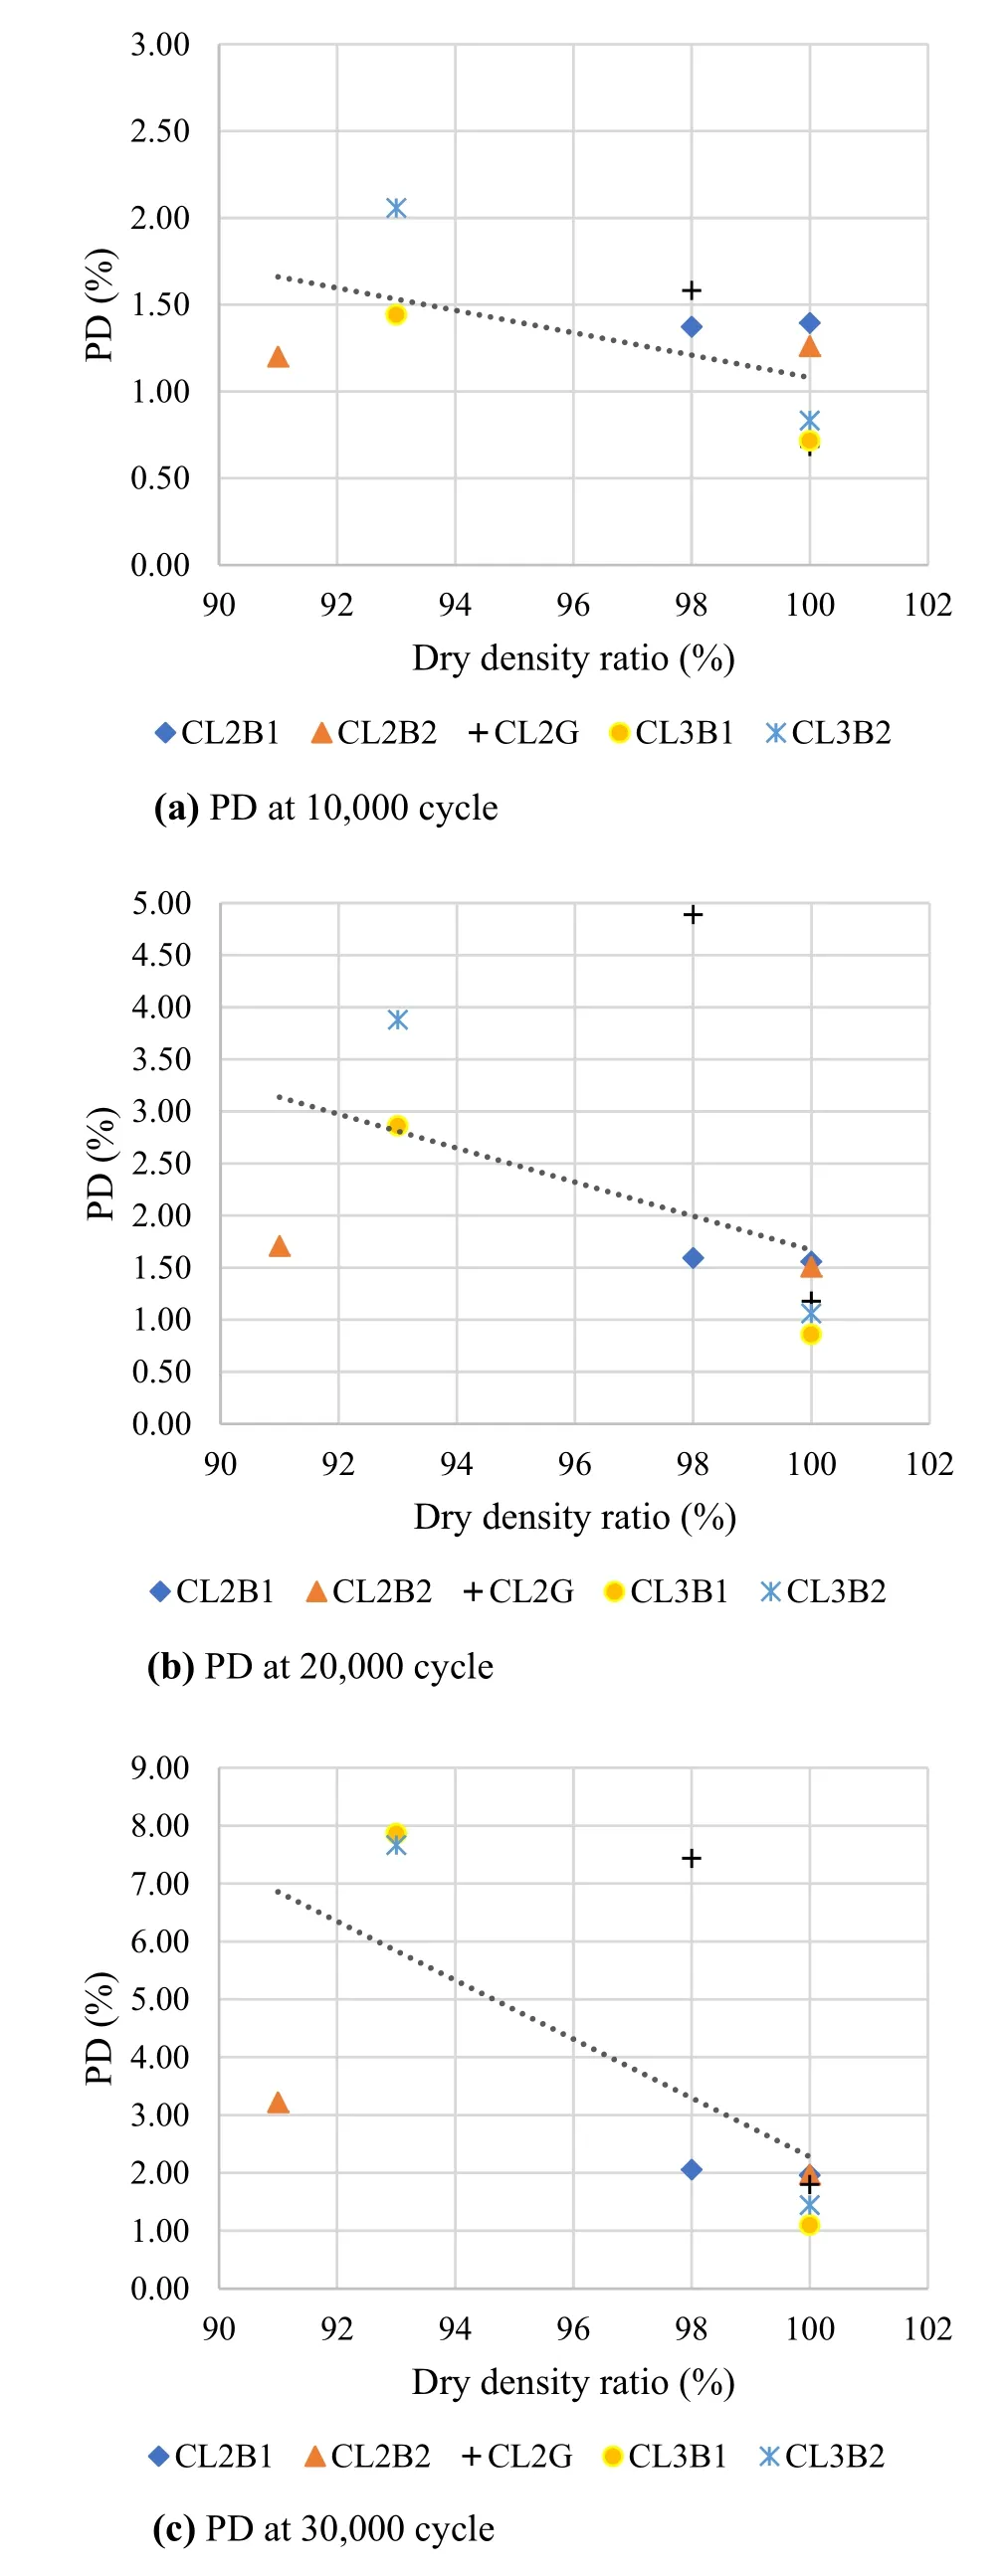
Fig.7 Effect of dry density on PD of UGMs
No significant relationship was found between the PD and the gradation of the tested materials.This might be because only close gradations were investigated for CL2B and CL3B as shown in Fig.3.However,density might have a dominant effect over the gradation,considering the dry density is directly related to the gradation of the materials[18,47,50].
Stress level is one of the most important factors influencing the PD of UGMs[5].In this study,the stress stage sequences in Table 5,as suggested by Austroads[39],were applied.Therefore,the variation was only in the magnitudes of the deviator stress(350,450,and 550 kPa)since the confining stress was fixed for the entire test(50 kPa).It can be seen from Fig.8 that the effect of deviator stress on PD is significant.As the deviator stress increases,the accumulated PD increases.For example,CL2B1 had PD values of 1.39%,1.55%,and 1.96%under deviator stresses of 350,450,and 550 kPa,respectively,and is a behaviour that has been shown in numerous previous studies[51–54].It is worth mentioning that the effect of stress history is not considered in this study.
In general,each applied load cycle adds a small increment to the accumulation of PD[5].It has been concluded from previous research that a continuous increase in the PD occurs under repeated application of load cycles[43,55–57].For instance,Fig.9 shows that the PD of CL4B at stress stage 3(σd=550 kPa)was 1.11%at cycle number 20,000.After an additional 10,000 cycles,the PD reached 1.53%.
UGMs of the base layer must have higher stiffness and strength than the subbase materials as higher stresses are exerted at the top of the pavement structure[9].Surprisingly,it has been found in this study that CL3B1,CL3B2,and CL4B(subbase materials)show high PD resistance,which is almost equivalent to CL2B1 CL2B2,and CL2G(base materials).Thus,the current specification of the base/subbase materials in Victoria should be reassessed based on the mechanical properties of the materials since the current subbase UGMs have been shown to be overspecified.
This finding highlights the importance of characterising the UGMs according to their mechanical properties(i.e.PD under repeated-load cycles)and to develop a constitutive model for the flexible pavement design method in Australia to predict the PD(i.e.rut)of UGMs.Moreover,the stiffness of the materials(i.e.Mr)also needs to be investigated in order to characterise the full mechanical behaviour of the UGMs.

Table 6 Influence of compaction level on PD of the tested materials
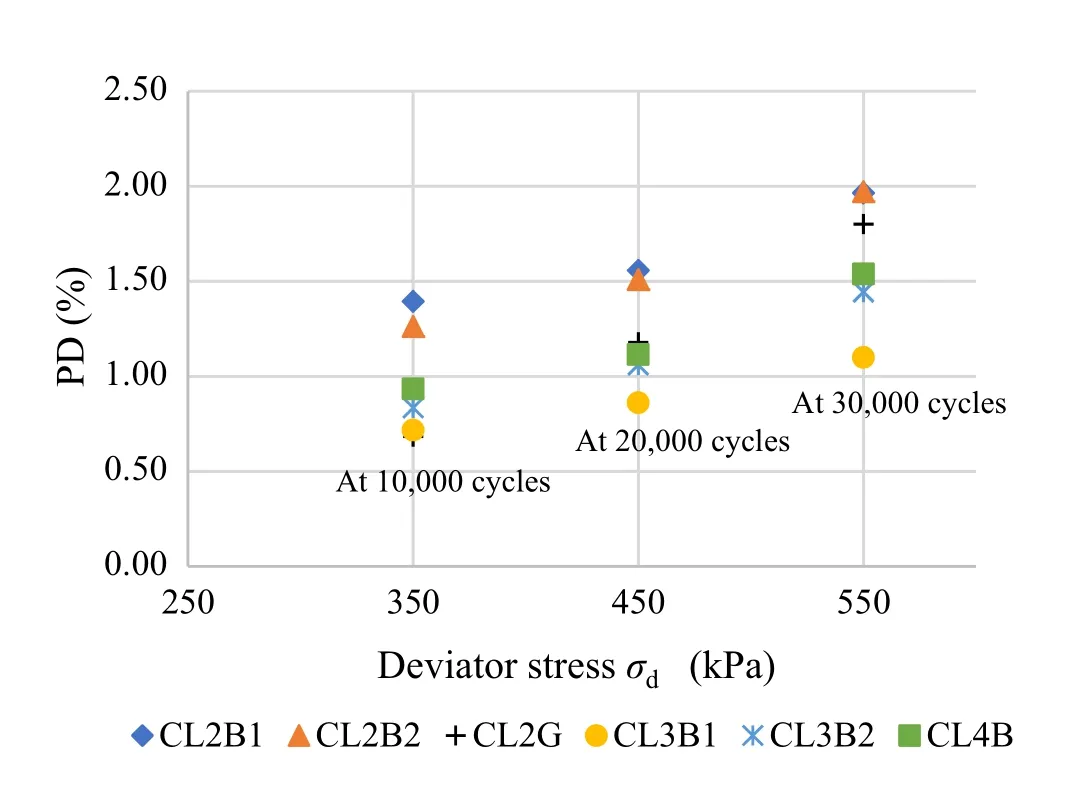
Fig.8 Effect of deviator stress on PD of UGMs(at OMC and MDD)
5 Proposed shakedown criteria
5.1 Development of criteria
In this study,the tested materials ranked as Range C(i.e.incremental collapse)as shown in Table 7 according to the existing shakedown limits in Table 1 that were established by Werkmeister et al.[24]and Gu et al.[20];therefore,these materials should be excluded in the pavement design.However,according to VicRoads[34],these materials are high-quality UGMs for pavement.There can be two reasons for misspecification of these materials according to the existing boundaries.Firstly,the RLTT protocol that was used in this study was based on multiple stages of stresses,while the available shakedown boundaries were based on a single stage of stress.Secondly,the tested UGMs could be different in their properties compared to the local UGMs in other countries.Therefore,new criteria were needed to define the shakedown ranges for the local UGMs.
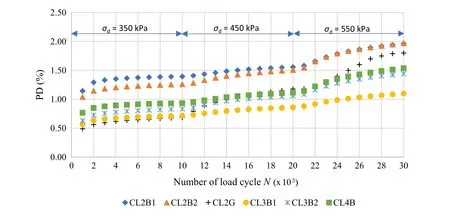
Fig.9 Effect of number of load cycles
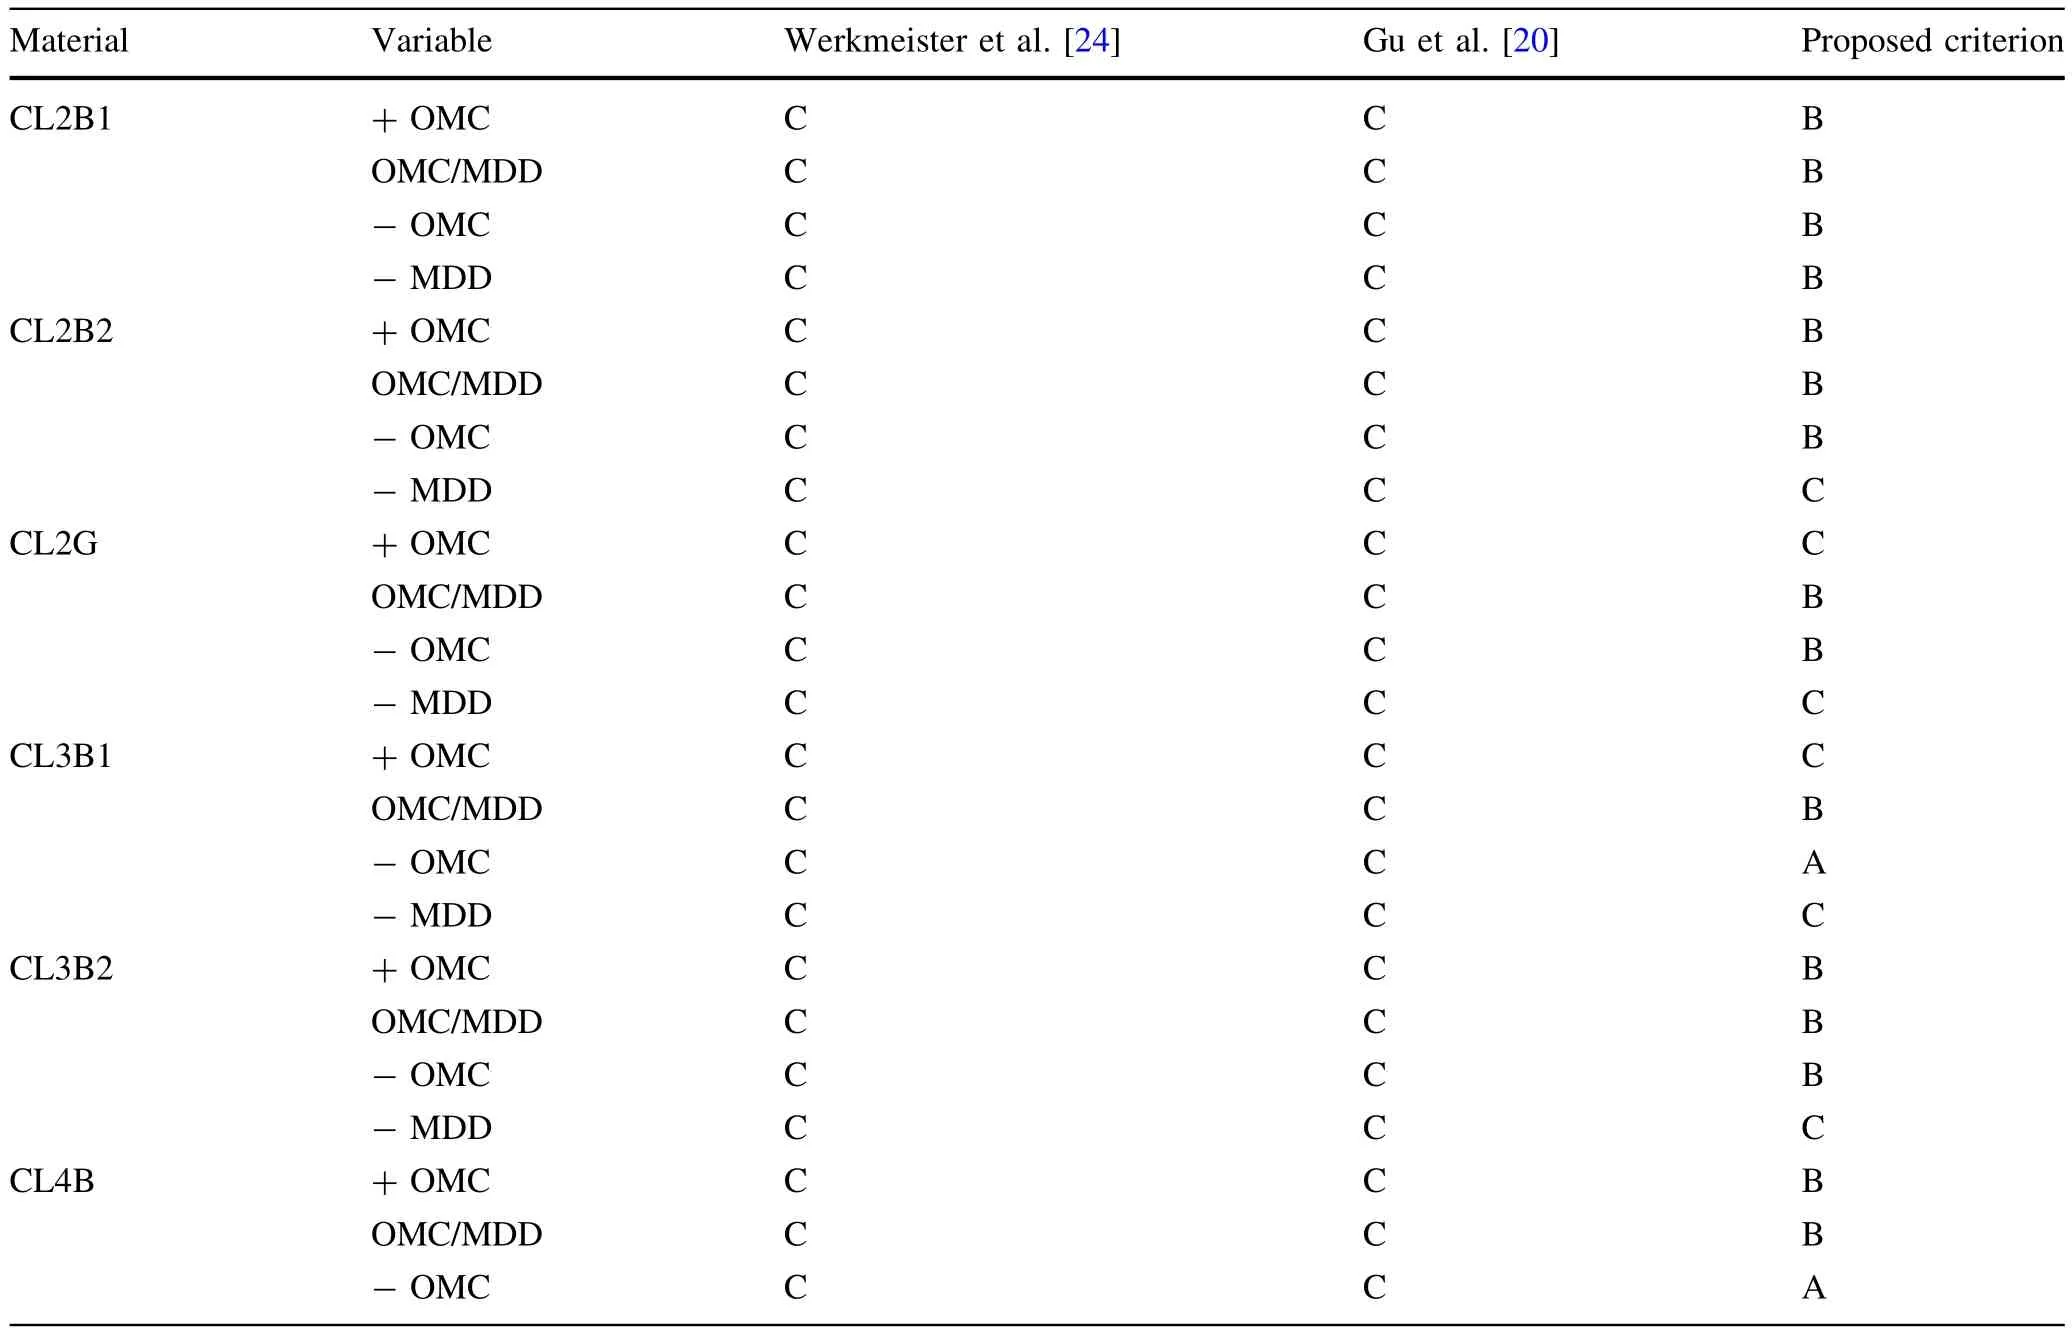
Table 7 Existing criteria for shakedown ranges
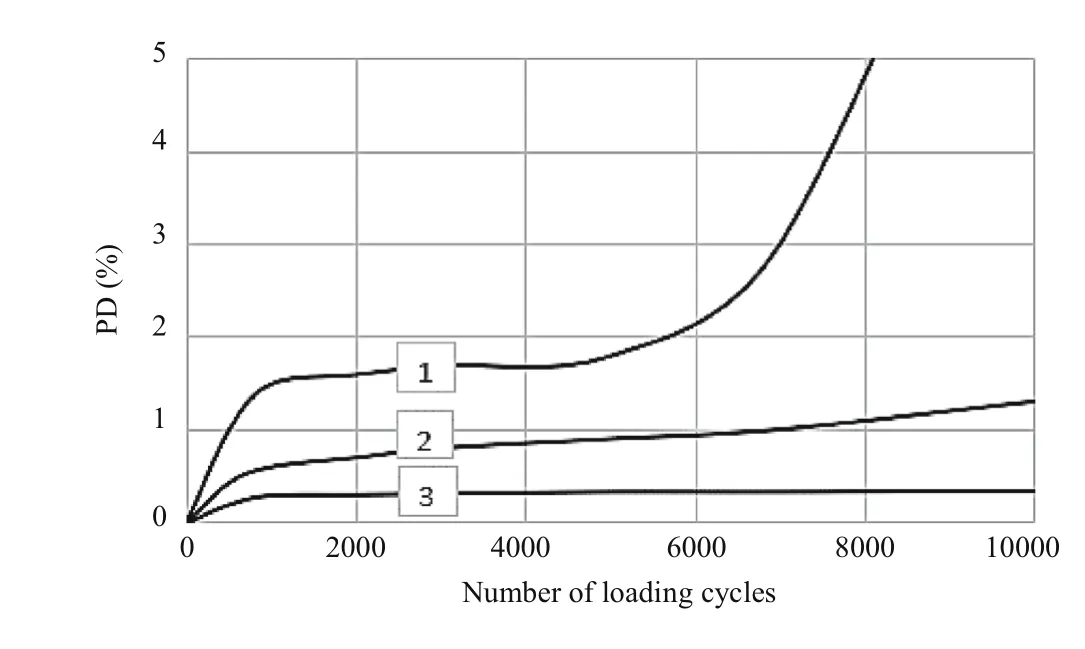
Fig.10 Typical three different types of PD failure
Based on the observed PD behaviours from the RLTT,this study proposes a new criterion to identify shakedown ranges.Figure 10 shows typical PD curves for three UGMs.Material 1 has a dramatic collapse in comparison with Materials 2 and 3.For the purpose of pavement design,the last response of the sample is essential.The curve slope angle of the PD vs logarithm of number of loading cycles at the end of the test is the principle of the new criterion.To assign the origin of the coordinate systems,it was found that the last in flection point of the PD curve is the appropriate origin of the identified slope.The most likely explanation for this in flection point is the beginning of the failure process that can be recognised as an increase in the PD behaviour.It can be clearly seen from the example in Fig.11 that Material 1 is in Range C,Material 2 is in Range B,and Material 3 is in Range A.Thus,the shakedown ranges can be determined according to the slope angle,Range C as 45°<angle<90°,Range B as 22.5°<angle<45°,and Range A as angle<22.5°as tabulated in Table 8.
According to the new criteria,most of the tested materials are in Range B and Range A as listed in Table 7,which indicated that these materials are acceptable as a base and subbase materials.The classification results of the new criterion are in good agreement with the crushed rock specification of VicRoads[34].Expected Range C has been observed for CL2B2,CL2G,CL3B1,and CL3B2 when the materials were prepared for lower MDD.In addition,when the moisture content exceeded the optimum,Range C was observed,particularly for materials CL2G and CL3B1.
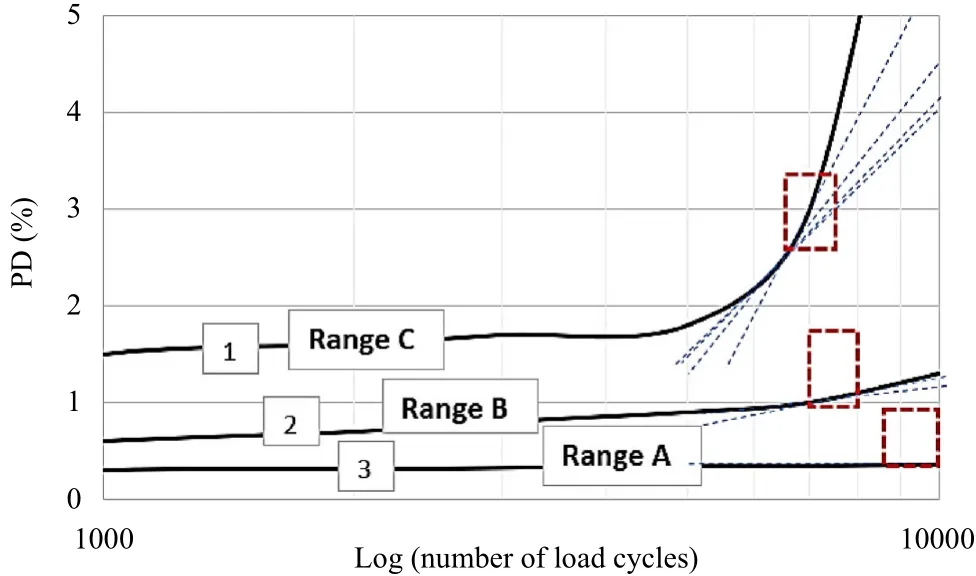
Fig.11 Proposed shakedown criteria
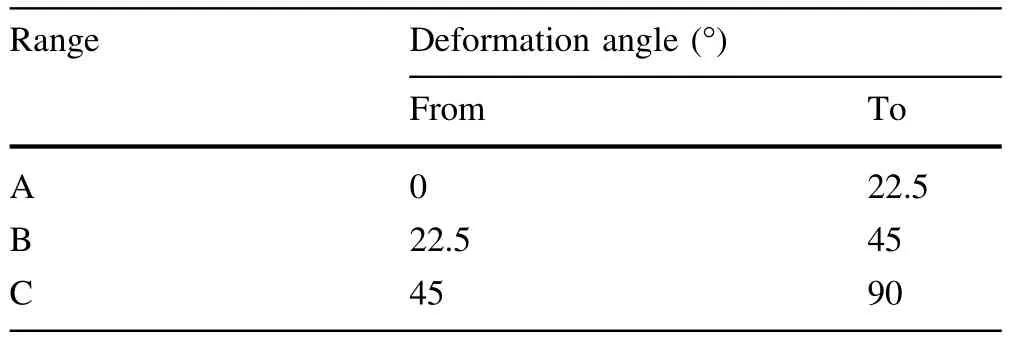
Table 8 New boundaries for the shakedown ranges
Figure 12a,b shows the vertical PD obtained at the third stage of the RLTT for specimens prepared at different ratios of moisture contents and dry densities,respectively.According to new shakedown criteria,CL2G and CL3B1,which were prepared at moisture contents above the optimum,showed incremental collapse(Range C),whereas CL3B1 and CL4B exhibit a low constant deformation(Range A)when the materials were prepared at moisture contents above the optimum.The remaining specimens were found to be in Range B as shown in Fig.12a.When CL2B2,CL2G,CL3B1,and CL3B2 compacted at dry densities below than the maximum,Range C was observed as shown in Fig.12b.It was concluded that the locally tested UGMs can be assigned as Range A when PD<1%,Range B when 1%<PD<3%,and Range C when PD>3%.
It was found that Ranges A and C can be easily distinguished on the basis of the PD behaviour,while Range B is found to be a bit challenging.The study recommends conducting further investigation to establish transition zones from Range A to Range B and from Range B to Range C,which could lead to better characterisation.
5.2 Validation of proposed shakedown criteria
In this study,three types of UGMs were used for the validation of the proposed shakedown criteria.G140-140,G140-420,and G140-700 were investigated by Werkmeister[18].Figure 13 shows the PD results of these materials for more than 100,000 load cycles.Table 9 presents the shakedown ranges for G140-140,G140-420,and G140-700 according to the three criteria,i.e.Werkmeister et al.[24],Gu et al.[20],and this study.It can be seen that the criteria proposed in this study are in good agreement with the criteria of Werkmeister et al.[24]and Gu et al.[20].In addition,it was observed that the new criterion achieved the same ranges in Fig.13.Therefore,the proposed shakedown criterion could be applied for several UGMs with single-and/or multi-stage stresses.Hence,the proposed criterion could give a useful qualitative approach to assess the PD of the UGMs according to the shakedown ranges with both single and multi-stages of stresses.
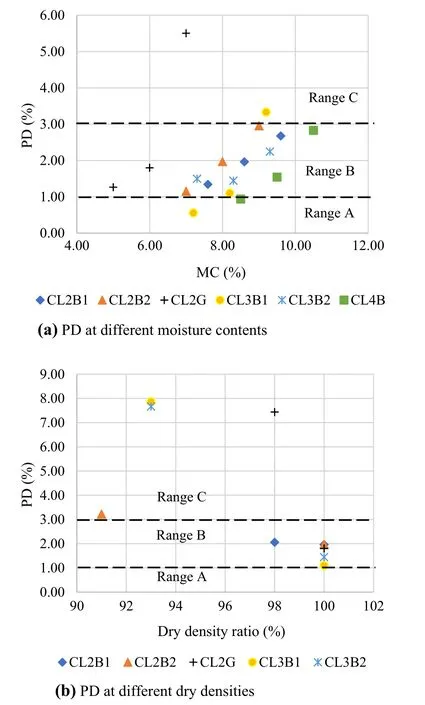
Fig.12 New shakedown limits
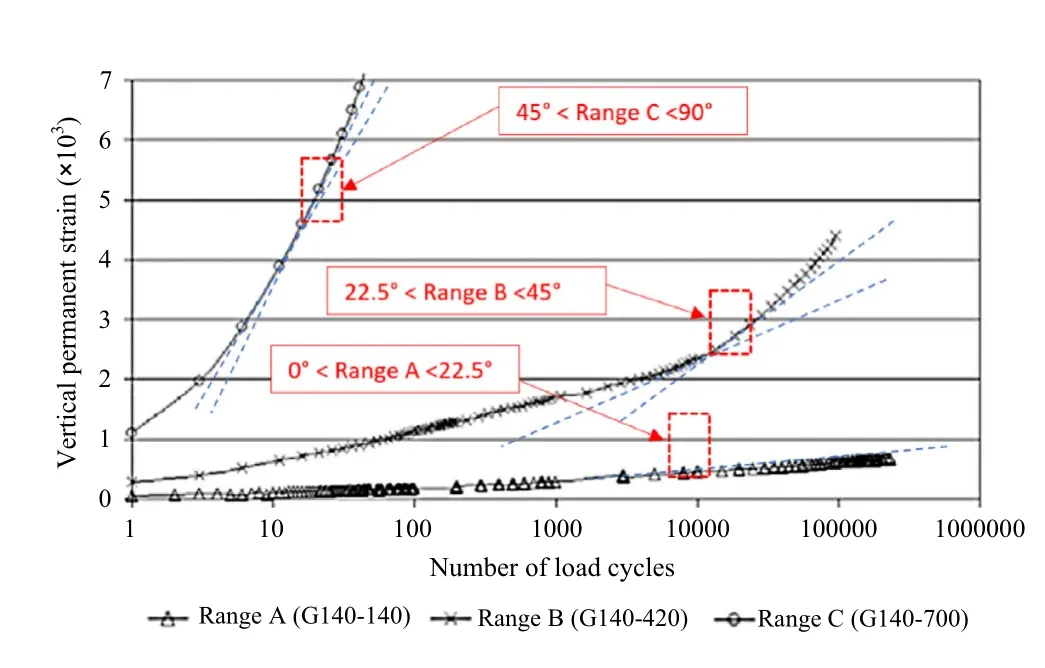
Fig.13 RLTT results of the selected UGMs(after[18])

Table 9 Criteria for shakedown ranges for selected materials
6 Summary and conclusion
This study examined four different types of base/subbase materials used for road pavements in Australia to investigate the effect of the intrinsic and compacted layer properties on PD under repeated loads.A new shakedown criterion with new boundaries was proposed for pavement design purpose.Extensive laboratory repeated-load triaxial tests were performed by varying material gradation,moisture content,and densities.
The results showed that the PD behaviour was influenced by several factors.Moreover,the tested subbasespecified UGMs have high PD resistance,which is almost equivalent to base-quality UGMs.These observations illustrate the requirement for new shakedown criterion for material characterisation based on PD behaviour.The shakedown ranges were identified using the new criterion,which is based on the curve slope angle of the PD vs.logarithm of number of loading cycles(0°<Range A<22.5°,22.5°<RangeB<45°and45°<Range C<90°).These boundaries were validated using several material behaviours from existing literature and were found to be consistent.
The proposed criterion has a number of benefits over the existing criteria.First,it could provide a powerful and quick material assessment tool for the accumulation of PD.Second,it can also be applied for various UGMs with single-and multi-stage stresses.It was found that the local tested base/subbase materials can be assigned as Range A when PD<1%,Range B when 1%<PD<3%,and Range C when PD>3%,which could simplify the flexible pavement design by predicting the rutting behaviour.Further investigations are required with different stress configurations to confirm these findings.
AcknowledgementsThe authors acknowledge the support of Ground Science South West Pty Ltd by providing the unbound granular materials in this study.
Open AccessThis article is distributed under the terms of the Creative Commons Attribution 4.0 International License(http://creativecommons.org/licenses/by/4.0/),which permits unrestricted use,distribution,and reproduction in any medium,provided you give appropriate credit to the original author(s)and the source,provide a link to the Creative Commons license,and indicate if changes were made.
 Railway Engineering Science2019年2期
- Railway Engineering Science的其它文章
- Modeling traffic barriers crash severity by considering the effect of traffic barrier dimensions
- Complementary parametric probit regression and nonparametric classification tree modeling approaches to analyze factors affecting severity of work zone weather-related crashes
- Vibration and acoustic radiation of bogie area under random excitation in high-speed trains
- A comprehensive review on hybrid electric vehicles:architectures and components
