Dy3+掺杂YNbO4微晶粉末发光特性
牛春晖,朱 婷,郎晓萍
(北京信息科技大学仪器科学与光电工程学院,北京 100192)
1 Introduction
The compoundswith ABO4composition are suggested to be excellent hosts for luminescent phosphors[1-5].Yttrium niobate YNbO4belongs to this family of compounds and also has excellent phosphor properties[6].YNbO4two has crystalline forms:the high temperature tetragonal phase with scheelite structure and the low temperature monoclinic phase with M-fergusonite structure.The reversible phase transition between the two phases has been observed in the temperature range 500-800℃depending on the rare earth(RE)ion[7-8].
The pure YNbO4emits a broad emission band centered at 405 nm excited at wavelength 260 nm,which is related to NbO34-groups in crystalline lattice of YNbO4[9-10].When being introduced different rare-earth ions,YNbO4matrix will induce different photoluminescence phenomenon,depending on the type of the RE dopant.Xiao et al.[11]have studied luminescent properties ofmicro-crystalline phosphors YNbO doped with Eu3+and Tb3+. Daˇcanin et4al.[12]have investigated temperature quenching of luminescence emission in Eu3+/Sm3+doped YNbO4powders.Chen et al.[13]have reported the excellent near-infrared quantum cutting luminescence of Tm3+doped YNbO powder phosphor.Yan et al.[14]have4studied chemical co-precipitation synthesis and photo-luminescent properties of Sm3+/Dy3+/Er3+codoped YNbO4microcrystalline phosphors.The photoluminescence properties of YNbO4doped with other RE ions(Er3+,Yb3+and Nd3+)have also been reported[15-16].
J-O theory has been proposed and developed independently by Judd[17]and Ofelt[18],and is intensively used to calculate spectral strength parameters of rare-earth ions in glass-state and crystalline-state hosts[19].But formanymaterialswith highermelting point such as YNbO4,it is very difficult to form glass or crystalline to study its spectral properties comprehensively.
In this article,to the best of our knowledge,luminescence properties of Dy3+ions in the host of YNbO4microcrystalline powder are investigated and spectral parameters are calculated according to Judd-Ofelt theory for the first time.
Firstly,five samples of Dy3+doped YNbO4microcrystalline powder are prepared through solidstate reaction and their phase composition are analyzed through X-ray diffraction(XRD) patterns.Secondly,absorption spectra of these samples are measured and spectral characteristics are calculated through Judd-Ofelt theory.Thirdly,excitation spectra with emission peak at 577 nm are obtained and analyzed.Then,emission spectra of the prepared samples excited at270 nm and 360 nm aremeasured respectively,and relationship of emission peak intensity with doping concentration of Dy3+ions is acquired.The analytic results indicated that concentration quenching mechanism of transition in Dy3+ions belonged to dipole-dipole interaction.Finally,CIE color coordinate is calculated and discussed for five samples.
2 Experiments
2.1 M aterial Preparation
Five shares of raw material with mass of 10 g are weighed according tomole ratio as Nb2O5∶Y2O3∶Dy2O3=100∶100 - x∶x(x=0.5,1,2,4,8),respectively.Here,rare-earth oxides are spectroscopic reagent and other oxides are analytical reagent.
The five shares of raw material are grinded and mixed in an agate mortar successively,then placed in five ceramic crucibles.The five ceramic crucibles are put into amuffle furnacemade up of silicon carbide rod and calcined at 1 300 ℃ for two hours,then are taken out and cooled to room temperature naturally.Cooled samples are grinded again and enclosed in five sample sacks for next measurement.The five shares of prepared samples are numbered 1#(x=0.5),2#(x=1),3#(x=2),4#(x=4)and 5#(x=8),respectively.
2.2 M easurement of M aterial Characteristic
Phase composition of the five prepared samples aremeasured by using Hitachi DMAX-3A X-ray diffraction(XRD)equipmentwith scanning scope from 10°to 80°.
Excitation spectrum and emission spectrum are measured by using Zolix Omi-λ150 mono-chromator,Omi-λ 300 mono-chromator and PMTH-S1-CR131 photomultiplier.
Absorption spectra of YNbO4∶Dy3+powder are obtained through formula asα(λ)= -ln[R(λ)],here,ln f means natural logarithm of function f and R(λ)is relative diffuse reflection spectrum.The relative diffuse reflection spectrum is expressed as R(λ)=I(λ)/I0(λ),here,I(λ)and I0(λ)represent diffuse reflection spectrum of YNbO4samples with and without Dy3+dopant,respectively,and the diffuse reflection spectra are measured by using Avantes ASPHERES-50-LS-HAL-12V integrating sphere and AvaSpec-2018 fiber spectrometer[20].
3 Experimental Results and Analysis
3.1 XRD Results and Discussion
Fig.1 displays measured XRD pattern of the prepared sample 5#,and the lower part of Fig.1 shows the characteristic peaks distribution of YNbO4crystal according to the 23-1486thPDF card.It is obvious thatmain X-ray diffraction peaks of prepared powder sample doped with Dy3+are accordant with characteristic peaks of normal YNbO4crystal,which illustrates that Nb2O5completely reacts with Y2O3and generates YNbO4with single phase structure.In addition,XRD patterns of other prepared samples are also measured and have the same characteristic peaks as YNbO4crystal.
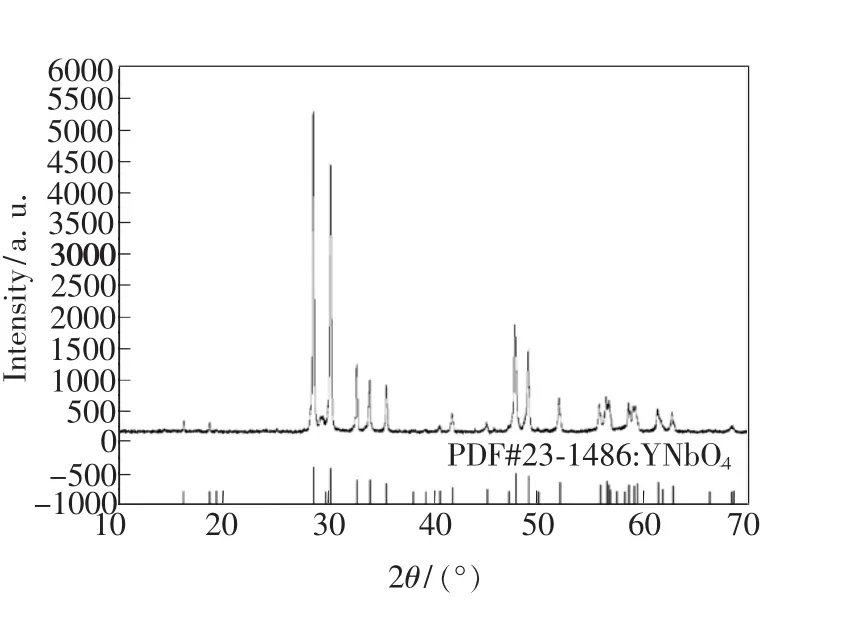
Fig.1 XRD pattern of sample 5#
3.2 Absorption Spectrum and J-O Calculation
Absorption spectrum of the prepared sample 5#is obtained through above-mentioned measure method and displayed in Fig.2.
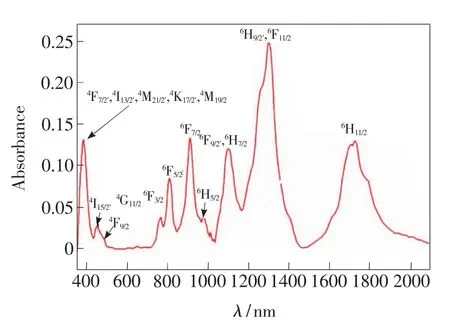
Fig.2 Absorption spectrum of sample 5#
It can be seen from Fig.2 that there are nine prominentabsorption peaks of Dy3+ionswithin spectral scope from 350 nm to 2 000 nm,and the corresponding excited-state energy levels are labelled,where,the stronger absorption peak located near800 nm corresponds to the transition from6H15/2to6F5/2and is often used to generate up-conversion luminescence.
The optical absorption spectra of rare earth ionscan helped to understand radiative properties.
According to J-O theory,experimental oscillator intensity has relationship with integral quantity of each spectral absorption peak as:

here,e is electricity quantity of electron,N is dosage concentration of rare-earth ions(unit:cm-3),and k(λ)is optical density,which has relationship with absorption coefficientα(λ)as:

where l is optical path length in hostmedium.
Experimental oscillator intensity can be expressed as:

in which,m is electron mass,h and c are Plank constant and light velocity,and J is the total angular quantum number of initial transition energy level,represents average wavelength of a absorption peak and can be shown as:

In Eq.(3),Sedmeans intensities of electric dipole transition and can be expressed by:

According to Eq.(1),(3)and(5),spectrum line intensity parametersΩtcan be obtained by leat square fitting to absorption spectrum.
From obtained spectrum line intensity parametersΩt,electric dipole transition oscillator intensity Sedcan be obtained according to Eq.(5).
one can calculate theoretical oscillator intensity as follows:

According to J-O theory,spectrum line intensity parameters of Dy3+in YNbO4can be calculated by using absorption spectrum shown in Fig.2.and the computed results are:

It iswell known that intensity parameterΩ2depends on the asymmetry nature of the local environments around rare earth ions,which implies that it also depends on the covalence between rare earth ions and ligand anions[21].The spectral intensity parameters of Dy3+ions in several different glass hosts are listed in Tab.1.It is clear that the value of intensity parameterΩ2of the prepared sample is only smaller than phosphate glass and is larger than other glass hosts,which means that there exists higher asymmetric nature of Dy3+ions sites and ionic nature of the chemical bond between Dy3+ions andligand.
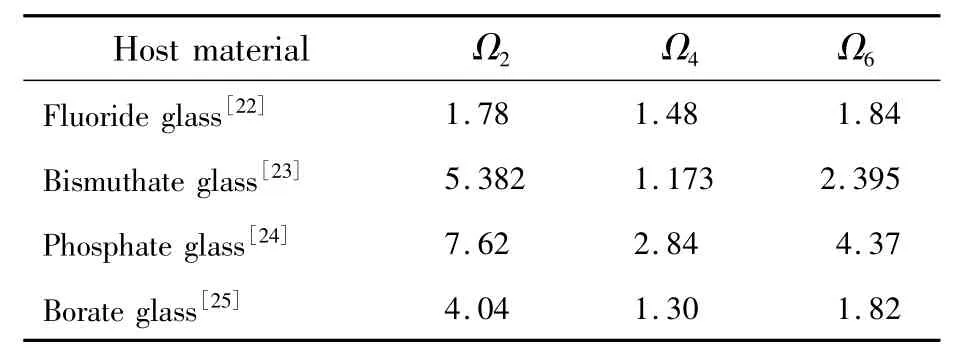
Tab.1 Spectral intensity parameters Ωt(t=2,4,6)of Dy3+ions
Furthermore,value ofΩ4/Ω6has relationship with odd crystal field and transition branching ratio[21],and smallerΩ4/Ω6valuemeans larger ratio of quantic crystal field to triple crystal field.It can be seen from Eq.(7)and Tab.1 thatΩ4/Ω6of Dy3+in YNbO4host is 0.59 and only larger than values in bismuthate glass hosts.
Experimental and theoretical oscillator intensities corresponding to transition from group level6H15/2to several excited state level of Dy3+ions are calculated,being displayed in Tab.2.Difference between experimental and theoretical oscillator intensities can be expressed as:

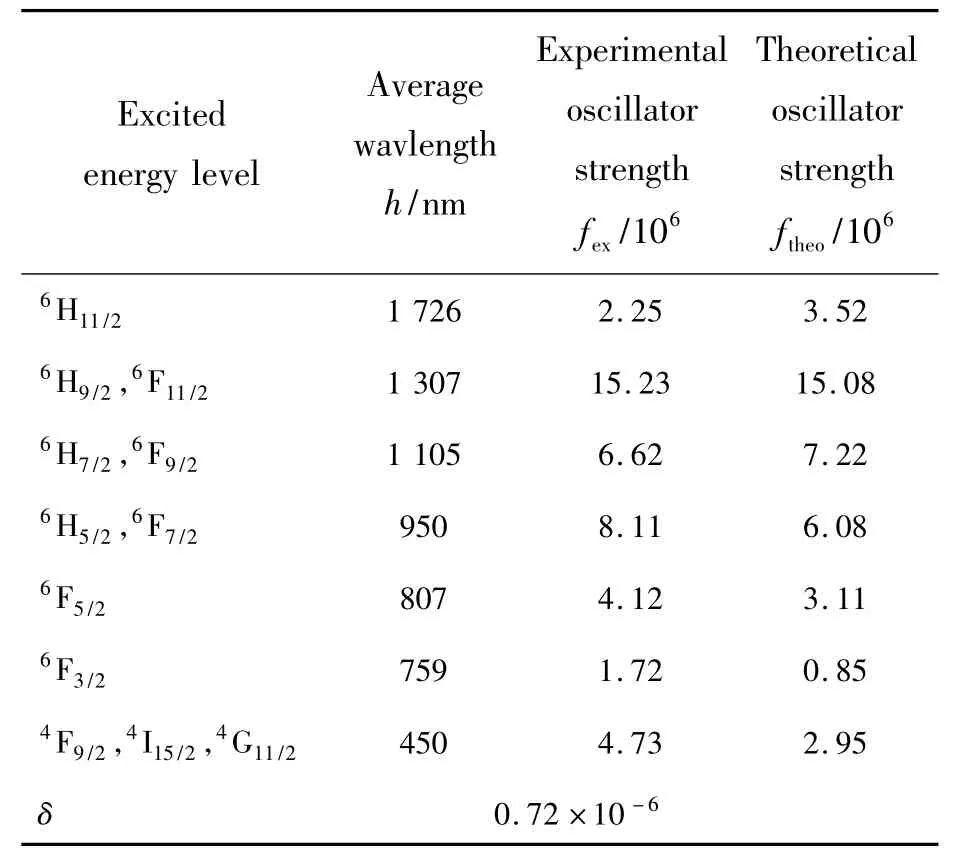
Tab.2 Experimental and theoretical oscillator intensity
It is obvious from Tab.2 that experimental os-cillator intensities have similar values to theoretical oscillator intensities,and the deviation is equal to δrms=0.72 ×10⁻⁶.
3.3 Excitation Spectrum and Em ission Spectrum
Fig.3 displays excitation spectrum of the prepared 5#sample when surveying wavelength is 577 nm.It can be seen from Fig.3 that the excitation spectrum comprises two portions,one portion is located at region from 240 nm to 300 nm,where it exhibited a strong excitation band originated from absorption ofgroups in crystalline lattice of,and excitation peaks in the other portion belong to 4f-4f transition of Dy3+ions.From left to right,the excitation peaks correspond to transitions of6H15/2to4I11/2,6H15/2to(4F7/2,4I13/2),6H15/2to4G11/2,6H15/2to4I15/2and6H15/2to4F9/2,respectively.The strongest exciting peak locates at458 nm.
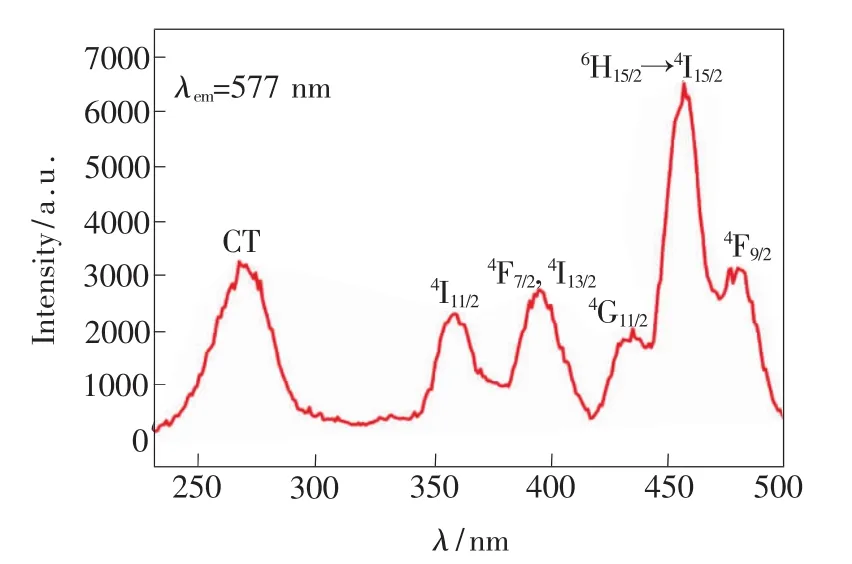
Fig.3 Excitation spectrum of sample 5#with surveyed wavelength at 577 nm
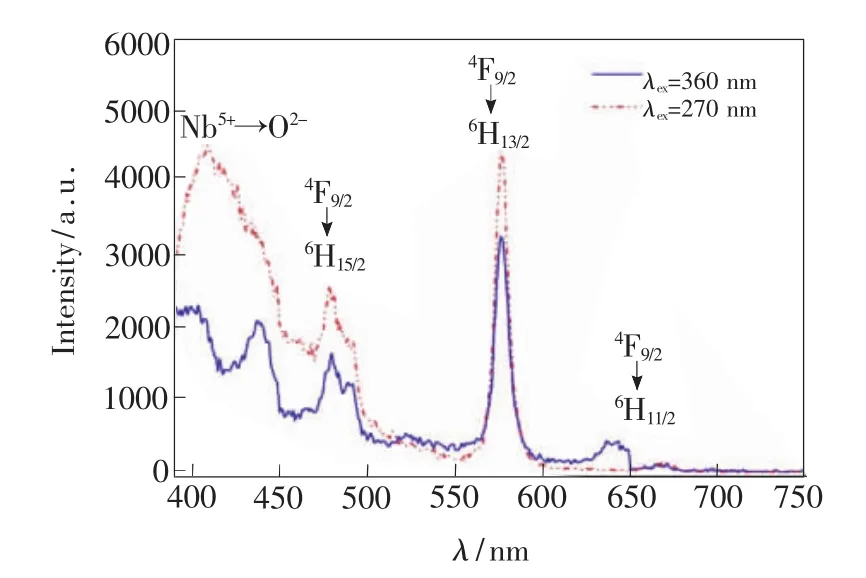
Fig.4 Emission spectrum of 3#sample excited at 270 nm and 360 nm
Emission spectra of 3#sample excited at 270 nm and 360 nm are shown in Fig.4.It can be seen that there are four groups of emission peaks.Three emission peaks are coincident for two exciting wavelength,that is,emission peak at 480 nm for transition from4F9/2to6H15/2,that at 577 nm for4F9/2to6H13/2and that at645 nm for4F9/2to6H11/2.But for emission peak at 405 nm,it is related to charge transfer transition,so that there are different luminescence performance excited at 270 nm and 360 nm.When excited at 270 nm,host crystalline lattice of YNbO4absorbs photon energy,and there is a wider emission band near 405 nm.However,when excited at360 nm,the photon energy will be absorbed by Dy3+ions and there are two narrower emission at 400 nm and 440 nm,respectively,which correspond to transitions of4F7/2to6H15/2and4I13/2to6H15/2of Dy3+ions.
Selecting exciting wavelength at270 nm,emission spectra of five prepared samples are measured,as shown in Fig.5.It is very obvious that there are mainly two emission peaks within visible light spectrum:one locates at 405 nm and the other at 577 nm,and the two emission peaks have different varying tendency along with increasing doping concentration of Dy3+ions.In order to quantitatively investigate relationship between emission peak intensity and doping concentration of Dy3+,an inlet figure is displayed in Fig.5.It can be seen that intensity of emission peak at 406 decreases progressively when increasing doping concentration of Dy3+.Intensity at 577 nm increases first,then decreases,and the strongest intensity appears when doping concentration of Dy3+ions is 2%.
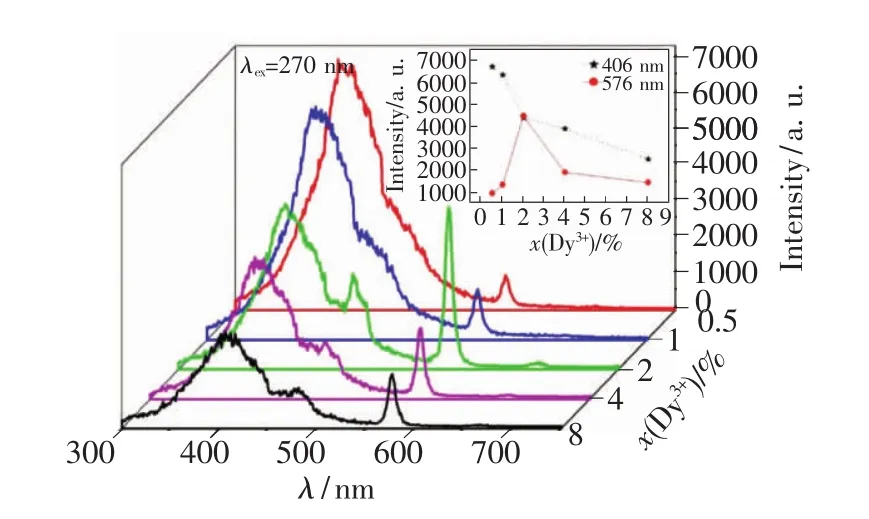
Fig.5 Emission spectrum of five samples excited at270 nm(inlet:luminescence vs.doping concentration of Dy3+ions)
According to Dexter theory[27],in non-conductive inorganicmaterial,the concentration quenching mechanism of activator ions belongs to electricmulti-pole interaction.When doping concentration of activator ions in fluorescent powder is large enough,luminescence intensity has relationship with mole fraction of activator ions as

here,I is luminescence intensity,x representsmole fraction of activator ions,k is scale coefficient,and c is a constant.When electric multipole interaction is dipole-dipole,dipole-quadrupole or quadrupolequadrupole,k is equal to 2.00,2.67 or 3.33.
Relation curve of lg(I/x)and lg x is displayed in Fig.6.Dotted lines represent fitting curve and it is clear that slope of two fitting curves is 1.35 for 409 nm luminescence peak and 1.83 for 577 nm,respectively.Itmeans that concentration quenching mechanism of transition emission from4F9/2to6H13/2of Dy3+ions belongs to dipole-dipole interaction.
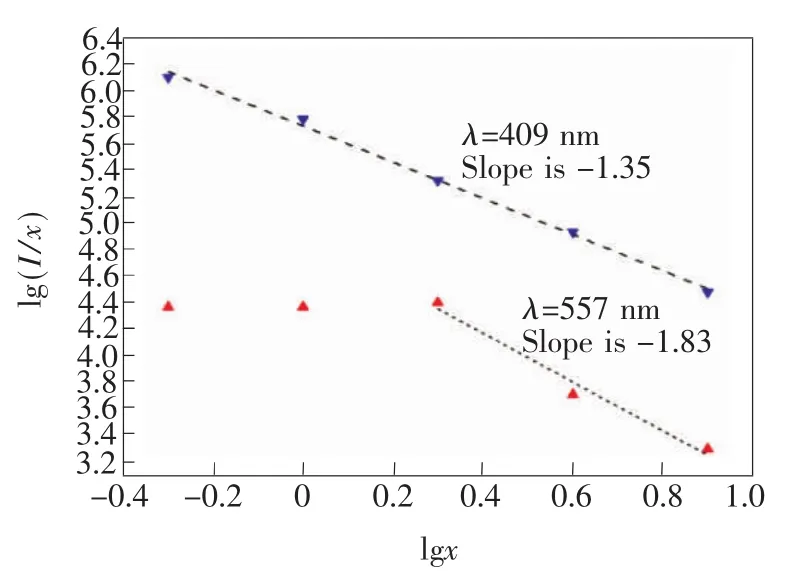
Fig.6 Relation curve of lg(I/x)and lg x
In order to investigate decaying characteristic of fluorescence emission intensity of the prepared sample,decaying curves about the two main emission peaks in Fig.5 aremeasured by using F-4500 typed FL Spectrophotometer of Hitachi.Moreover,it is clear in Fig.5 that the emission peak at 409 nm of 1#sample is higher than the emission peak at 577 nm of 3#sample.Fig.7 shows the decay profile of fluorescence peak of Dy3+ionsmonitoring at409 nm for 1#sample and at577 nm for 3#sample,respectively.It can be seen that the decay curve exhibits single exponential behavior and fluorescent lifetime for two peaks is fitted as 52μs(peak at 409 nm)and 221 μs(peak at577 nm),respectively.
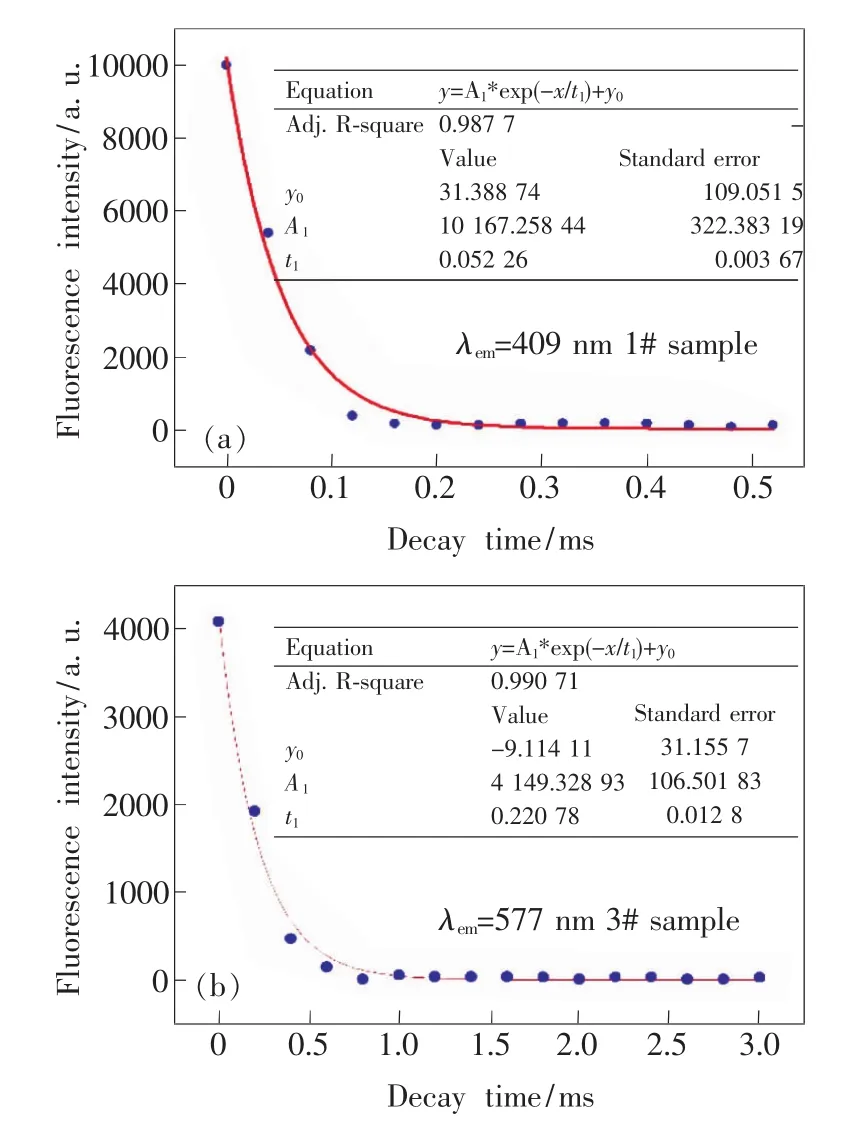
Fig.7 Decay curve of fluorescence intensity at 409 nm(a)and 577 nm(b)excited by 270 nm light
Fluorescence quantum efficiency of the phosphors is a key consideration for white-LED encapsulation companies,higher quantum efficiency of the phosphors corresponds higher emission intensity of white-LED.The integral sphere coupling fluorescence spectra can quantitatively determine the absolute quantum efficiency of the phosphors[28].The fluorescence quantum efficiency of 5#sample is obtained through Edinburgh FS5 typed spectrofluorometer and the result isη=55.3%.It can be seen from Fig.5 that integrated spectrum strength of 5#sample is the smallest in the five prepared samples,so that Dy3+doped YNbO4microcrystalline powder has fluorescence quantum efficiency larger than 55%under excitation at270 nm.
3.4 Color Parameter of Lum inescence
CIE color coordinates of emission spectrum of five prepared sample excited at270 nm are calculated,as shown in Fig.8.
It can be seen that CIE coordinates vary along with doping concentration of Dy3+ions but all locate at blue light region due to stronger luminescence band at 405 nm.When doping concentration of Dy3+ions is 2%,CIE coordinate has the nearest distance towhite light region,at this time,color parameters are(0.219,0.166).
The emission light photographs of five prepared samples under 270 nm excitation are displayed in Fig.9.The five photographs correspond to 1#,2#,3#,4#and 5#samples from left to right.It is clear that all the five samples emit white light but being close to blue light region.

Fig.9 Emission light photographs of five prepared samples under 270 nm excitation
4 Conclusion
In conclusion,five shares of Dy3+doped YNbO4microcrystalline powder with different doping concentration are prepared through solid-state reaction at1 300℃and duration of 2 h.Their X-ray diffraction patterns were examined and the results confirmed the formation of single phase crystalline structure of YNbO4.Absorption spectra aremeasured and spectral characteristics are calculated through Judd-Ofelt theory.Excitation spectra with emission peak at577 nm were recorded and the results illustrated that therewas an excitation peak near260 nm due to absorption of crystalline lattice of YNbO4and several excitation peaks originated from 4f-4f transition of Dy3+ions.Emission spectra excited at 270 nm and 360 nm were also measured and basically identical emission spectra were observed.Concentration quenching phenomenon of Dy3+ion's luminescence was discovered by comparing emission spectrum of different Dy3+doping concentration.Analytic results according to energy transfer theory indicated that concentration quenchingmechanism in Dy3+ions belonged to dipole-dipole interaction.At last,CIE color coordinates of the prepared sampleswere also calculated and color parameterswith nearest distance to white light region were(0.219,0.166).

