
Meta-analysis Reveals Potential Influence of Oxidative Stress on the Airway Microbiomes of Cystic Fibrosis Patients
2019-06-03 12:56:28XinShiZhanchenGaoQianLinLipinZhaoQinMaYuKanJunYu2
Xin Shi, Zhanchen Gao, Qian Lin, Lipin Zhao, Qin Ma Yu Kan*, Jun Yu2,*,
1 CAS Key Laboratory of Genome Sciences and Information, Beijing Institute of Genomics, Chinese Academy of Sciences, Beijing 100101, China
2 University of Chinese Academy of Sciences, Beijing 100190, China
3 Department of Respiratory & Critical Care Medicine, Peking University People’s Hospital, Beijing 100044, China
4 Department of Biochemistry and Microbiology, School of Environmental and Biological Sciences, Rutgers, The State University of New Jersey, New Brunswick, NJ 08901, USA
5 Bioinformatics and Mathematical Biosciences Lab, Department of Agronomy, Horticulture and Plant Science and Department of Mathematics and Statistics, South Dakota State University, Brookings, SD 57007, USA
Abstract The lethal chronic airway infection of the cystic fibrosis (CF) patients is predisposed by colonization of specific CF-philic pathogens or the CF microbiomes,but key processes and reasons of the microbiome settlement in the patients are yet to be fully understood,especially their survival and metabolic dynamics from normal to diseased status under treatment. Here, we report our meta-analysis results on CF airway microbiomes based on metabolic networks reconstructed from genome information at species level.The microbiomes of CF patients appear to engage much more redox-related activities than those of controls,and by constructing a large dataset of anti-oxidative stress (anti-OS)genes, our quantitative evaluation of the anti-OS capacity of each bacterial species in the CF microbiomes confirms strong conservation of the anti-OS responses within genera and also shows that the CF pathogens have significantly higher anti-OS capacity than commensals and other typical respiratory pathogens.In addition,the anti-OS capacity of a relevant species correlates with its relative fitness for the airways of CF patients over that for the airways of controls.Moreover, the total anti-OS capacity of the respiratory microbiome of CF patients is collectively higher than that of controls, which increases with disease progression, especially after episodes of acute exacerbation and antibiotic treatment. According to these results, we propose that the increased OS in the airways of CF patients may play an important role in reshaping airway microbiomes to a more resistant status that favors the pre-infection colonization of the CF pathogens for a higher anti-OS capacity.
KEYWORDS Cystic fibrosis;Airway microbiome;Meta-analysis;ROS;Respiratory pathogens
Introduction
Cystic fibrosis (CF) is a genetic disorder due to dysfunctional mutations of CFTR, a gene that encodes the cystic fibrosis transmembrane conductance regulator,an ion channel protein transporting chloride, bicarbonate, and thiocyanate ions across epithelial cell membranes [1,2]. CFTR mutations in the airway epithelium cells lead to a reduced volume of the airway surface liquid (ASL), which is composed of thick mucus,decreased muco-ciliary clearance, and increased ASL acidity,and altogether, they compromise local physical anti-bacterial defenses [3]. Meanwhile, immune response to pathogen infections in CF patients is also defective as previously reviewed[4].Therefore,the CF-associated pulmonary environment constitutes an allowed habitat for microorganisms that are able to colonize in the thickened mucus and cannot be effectively cleared,eventually leading to recurrent and chronic pulmonary infections—the major cause of CF morbidity[3].A number of specific pathogens, such as Pseudomonas aeruginosa, and Burkholderia cepacia complex have much higher frequency of causing chronic infections in patients with CF than healthy individuals and other patient groups[5-7].Mechanisms underlying this close association between CF and the CF-philic pathogens or the CF pathogens are not yet fully understood except the discovery of predisposed colonization of CF pathogens in airways of CF patients before they cause chronic infections [8]. In fact, there are complex and diverse microbial floras, or microbiomes, in the airway of CF patients [9], and such multispecies communities often exhibit apparently distorted species composition, i.e., dysbiosis, when compared with those of healthy individuals [10]. Obviously, dysbiosis of the microbiome is critical for CF pathogen colonization,and investigations on the microbiome dysbiosis will help in elucidating the pathogenesis of chronic infections in CF patients and in finding effective treatment strategies.
The CF airway microbiomes face quite complex milieu different from that of normal individuals. In addition to the thickened mucus, sputa of CF patients are also featured increased acidity and abundant nutrients, such as iron [11],small organic acid [12], amino acid [13], and nuclear acid [14]which are always undetectable in healthy lungs. Furthermore,hyper-inflammation is another primary feature of CF airways that is heavily infiltrated with neutrophils and other immune cells [15]. Neutrophils are engaged in non-specific defending against bacterial invasion by releasing a large amount of reactive oxygen species (ROS), and thus elevate local oxidative stress (OS) [16]. Studies have shown that pro-inflammation cytokines production, neutrophil infiltration, and increased OS are already observed even in new born CF patients before bacterial colonization [5]. Furthermore, this neutrophil dominant inflammation is perpetually exaggerated by recurrent infections of CF pathogens during the progression of the disease in a lifetime of CF patients [4]. Therefore, CF airways provide a unique trophic and stress milieu for microbes inhabiting there, and have important effects on their metabolic activities for the sake of fitness. In this way, the dysbiosis can be dissected by elaborative analysis on the metabolic activities and stress response of each component species of the microbiomes in the milieu, which, however, have not yet been systemically investigated. Another feature of respiratory microbiome is obvious diversity among individuals [17,18],for which large sample size is demanded for sufficient statistical power.
Toward this end, we perform meta-analysis using highquality data selected from previous studies to investigate mechanisms of the CF pathogen colonization and microbiome dysbiosis in CF patients based on the metabolic activity of airway microbiomes.The limitation of such a function analysis is that the data sources are all 16S-based, and ideally, a thorough functional analysis prefers comparative datasets where highquality shotgun-sequencing-based and 16S-based data from adequate sampling of respiratory microbiomes are both available. Nevertheless, the current data are all 16S-sequencebased, albeit often questioned for reliability in metabolic reconstruction and analysis, and it is what we have available for examination at this time point. Furthermore, metabolic processes among human microbiomes are usually very stable and may not lethally affected by occasional quantitative differences of individual genes within a complex pathways and networks. The key often lies in the conservation of such metabolic processes within lineage levels, such as within the scope of genus where resolution can be reached based on 16S rDNA sequencing data, and we are extremely cautious and always ask the question as to in what extent a variable metabolic process is conserved.
Results and discussion
Our meta-analysis confirms the microbiome dysbiosis in CF airways
Following the preferred reporting items for systematic reviews and meta-analyses (PRISMA) guidelines [19], we select previous published studies and datasets in public resource for analysis, and a detailed description of our selection process can be found in Materials and methods section. Since we are yet to find a high-quality shotgun sequencing-based research report,let alone a qualified dataset, for respiratory microbiomes, we only include 16S rDNA sequencing-based studies. Our selection for high-quality data finally results in seven studies from 149 original studies(Figure 1),and of them,five are published studies [20-24] on healthy controls, early-stage and adult patients, and the other two are unpublished datasets of controls and early-stage patients(Table 1,Table S1).In total,this meta-analysis contains 298 CF patients and 54 healthy controls(Table S2).The average read mapping rates at various lineage levels reach 97.78% , and 91.27% of the reads are assignable to known genera alone (Figure S1).
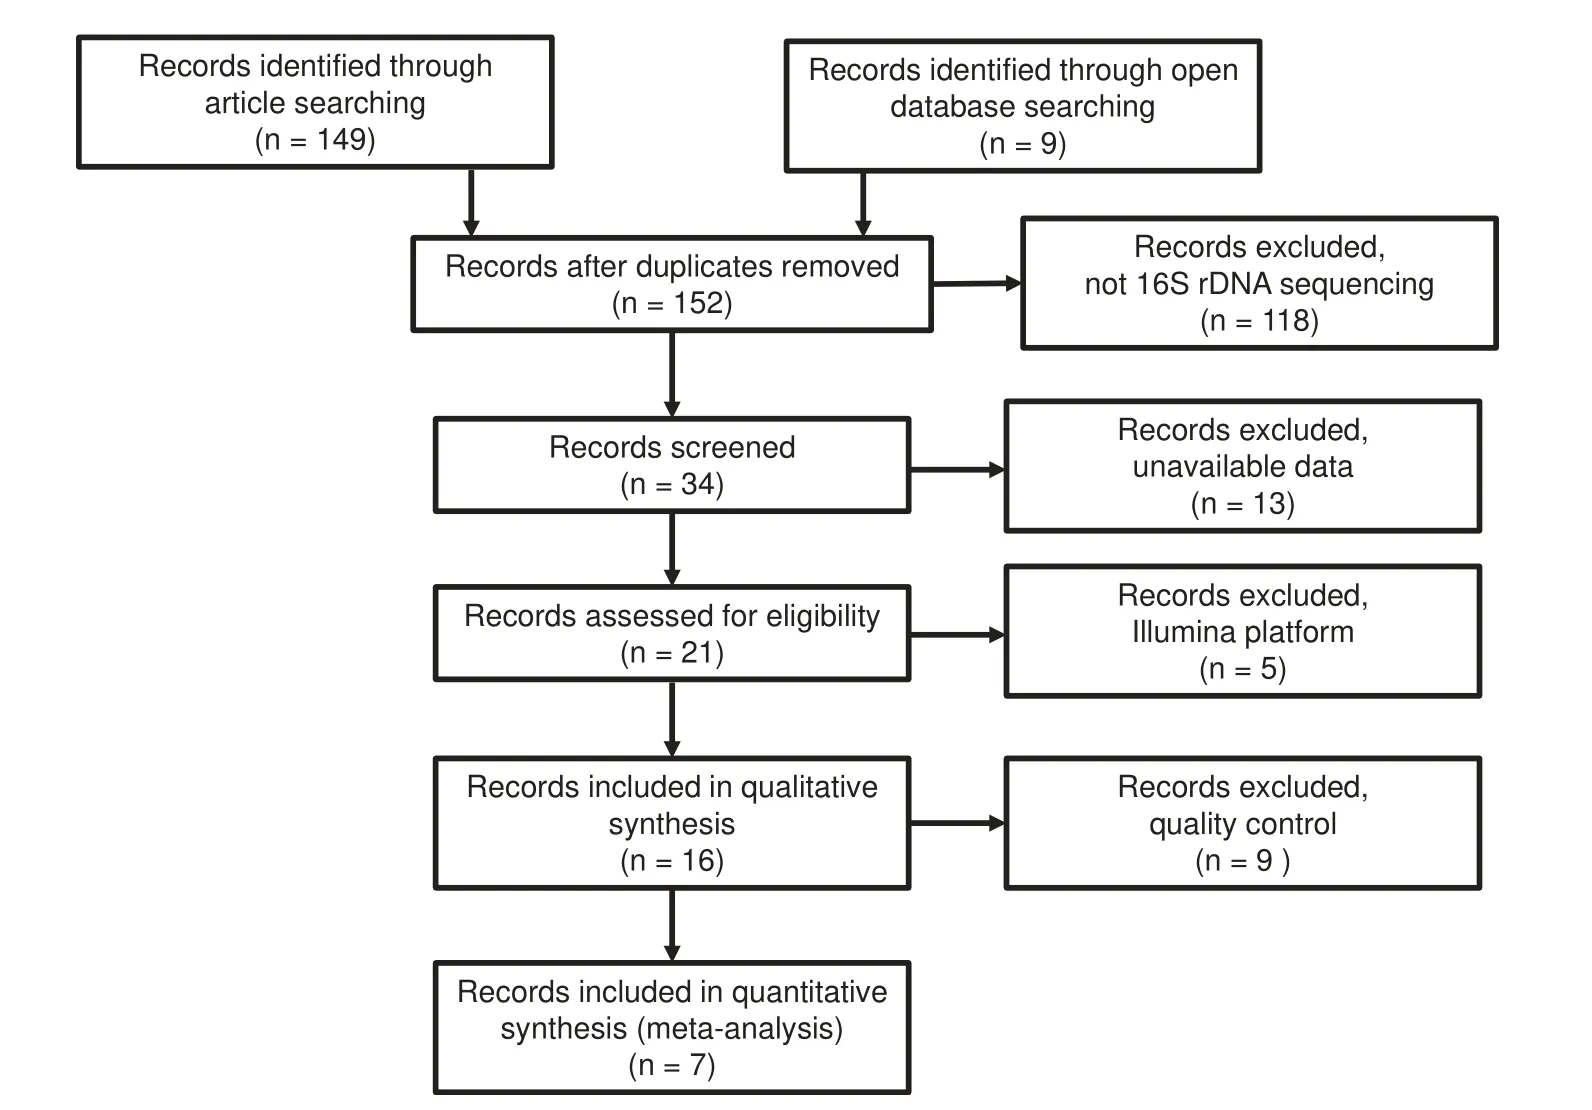
Figure 1 PRISMA flow diagram of all searched records
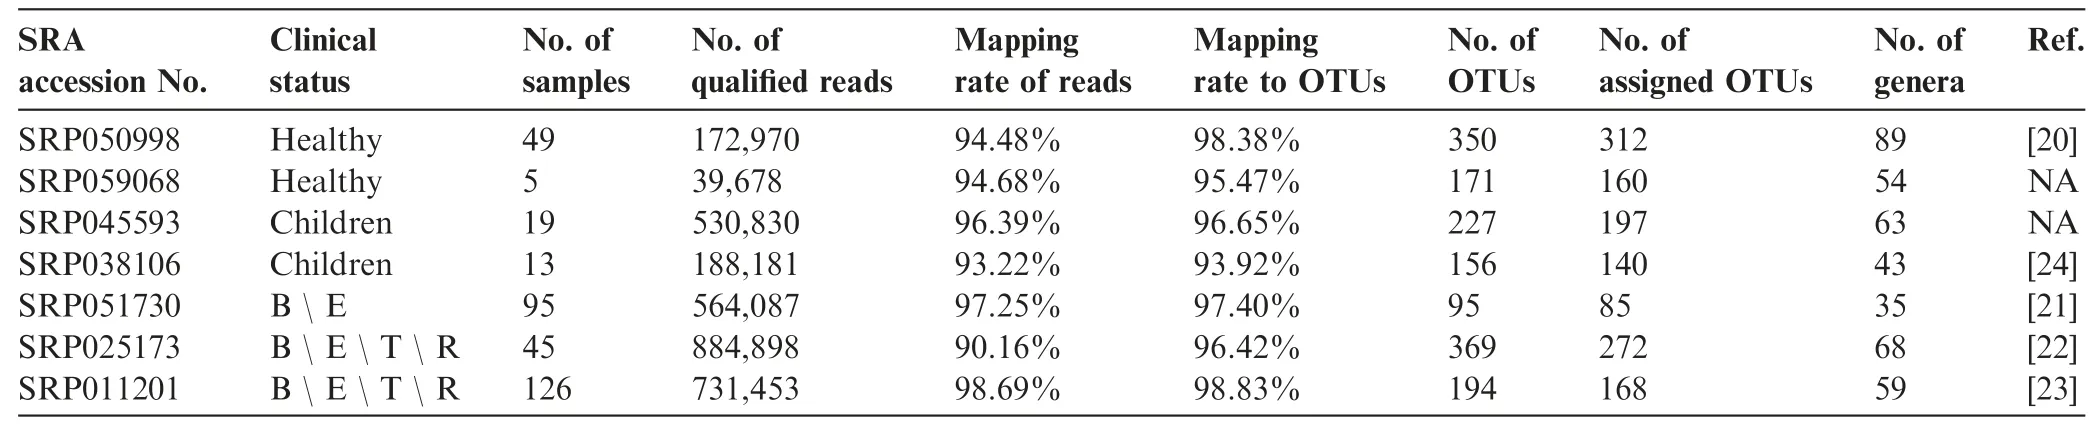
Table 1 Studies used in the current meta-analysis
Our meta-analysis confirms the observations of microbiome dysbiosis in CF patients described in previous studies [25-27].Although there are some batch-based variations among different studies, we find that microbiome dysbiosis in adult CF patients becomes apparent after re-grouping the samples.Our nonmetric multidimensional scaling(NMDS)result shows that samples from adult CF patients are quite different in term of species profile from those of healthy controls,while samples of early-stage CF patients lie between the two groups(Figure 2A). A typical sample from the adult CF patient mainly manifests dysbiosis in two aspects: a pathogen species,especially Pseudomonas,dominates the microbiome while commensal species appear diminishing.Both of the changes reduce diversity of the CF microbiomes, leading to a significant decrease of Shannon index which is commonly used to characterize species diversity in a community(Figure 2B).For the 12 major components at the genus level in the airway microbiome,which are present in >60% CF or control samples with their reads abundance >1% in at least one sample,the Spearman’s rank correlation coefficient between each pair of species indicates that Pseudomonas is negatively correlated with the five commensal species,while these commensals and four other species are positively correlated if we set a loose cut-off of correlation coefficient |ρ|>0.4 (Figure 2C).
When taken in a longitudinal view,the microbiome dysbiosis aggravates with the disease progression as the abundance of Pseudomonas gradually increases, whereas the abundance of the commensals,as well as the Shannon index,decrease simultaneously. An example of a CF patient with decade-long collected samples in a longitudinal study is showcased here(Figure 2D). These observations feature the microbiome dysbiosis in CF airways,where a rather loose negative correlation is seen between Pseudomonas and commensals.

Figure 2 Dysbiosis of airway microbiomes in CF patientsA.NMDS ordination of species profile of samples from healthy controls,early-stage and adult patients.B.The Shannon index of samples in each group. P values were calculated using Wilcoxon’s test. **, P <0.01; ***, P <0.001. C. The 12 top-ranking genera in the Spearman’s rank correlation network.The red node indicates CF pathogen Pseudomonas,whereas other species are indicated using green nodes.The red and blue lines indicate the negative and positive correlations,respectively,with their thickness in proportion to coefficient(ρ)value,which indicates correlation strength.D.Shannon index,abundance of Pseudomonas,and abundance of the negatively-correlated commensals of longitudinally collected samples in patient P2.Samples were arranged based on the collection time from early to late in the 10-year period. B, E, T, and R indicate the time points of sample collection at the baseline, acute exacerbation stage, after antibiotic treatment,and recovery stage,respectively,and the numbers after B,E,T,R represent the numbers of occurrence at the respective stages.CF, cystic fibrosis; NMDS, nonmetric multidimensional scaling.
CF microbiomes are highly-engaged in redox activity
In the interrogation of nutrient metabolism, we first look at direct interactions, i.e., competition or co-operation between the major species. Here, we follow the method, proposed by Zelezniak et al to in silico predict nutrition consumption and metabolite generation for each species [28]. Our results show that all major component species compete with each other for common nutrition resources such as saccharides and amino acids, and the value of metabolic resource overlap (MRO),which quantitatively represents competition between species pairs, does not have significant difference between the groups of negatively-correlated (Pseudomonas-commensal pairs with ρ <-0.4), positively-correlated (commensal-commensal pairs with ρ >0.4), and uncorrelated (pairs with |ρ|<0.4) species pairs (Figure S2A). Similarly, the value of metabolic interaction potential (MIP), which quantitatively represents metabolic co-operation between species pairs, does not show apparent association with the Spearman’s correlation coefficient as well (Figure S2B). Therefore, our analysis indicates that the major component species in the airway microbiomes are largely independent from nutrient metabolism, and such a fact is very different from the gut microbiomes,and the latter exhibit intensive interspecies interactions [29]. Such a difference may be due to the fact that an airway microbiome harbors much less bacterial species both in species number and total biomass and whose poor biodiversity offers very little chance for the establishment of interspecies interaction.
The metabolic independence among the airways major component species indicates that they may confront the CF airway milieu independently, and the dysbiosis of the CF microbiomes may be a result of the specific CF airway environment that is highly selective for adaption of the CF pathogens that out-compete the commensals.Therefore,we try to identify metabolic differences between the CF and normal airway microbiomes, which should offer some clues on the selective forces. Therefore, we use a constrained metabolic analysis method, BiomeNet [30] to interrogate details where reactions are limited by the abundance of corresponding enzymes and substances. The inferred discriminatory metabolic subnetworks involve 312 enzymes,which can be used to make distinctions between the CF and control samples (Figure S3). These enzymes are functionally classified to be those that increase fitness for resident species in changing environments, and the exercise yields a major top-ranking CF-enriched enzymes:oxidoreductases. These enzymes are carried mainly by CF pathogens,whereas none of the control-enriched enzymes participate in any redox reactions (Figure 3). The functions of these oxidoreductases are not in a single category but include electron transport (rubredoxin reductase), H2O2degradation(glutathione peroxidase), glutathione (GSH) synthesis(glutathione reductase), and NADPH (nicotinamide adenine dinucleotide phosphate) generation, and all of them appear to share protective functions in alleviating ROS damage. For example, the rubredoxin system in Pseudomonas conveys efficient defense during infection, and its high electron transfer efficiency keeps the iron center in a reduced state that minimizes OS-damage after phagocytosis in neutrophils [31].Another example is a pair of detoxification enzymes found in Pseudomonas, glutathione peroxidase and reductase, and both are upregulated in response to H2O2stress [32].
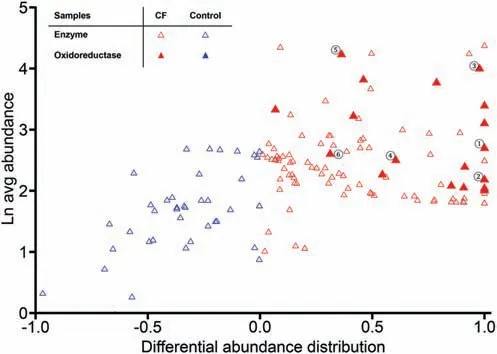
Figure 3 Differential distribution of enzymes in discriminatory metabolic subnetworks between CF and normal microbiomesTriangles indicate the enzymes that compose the discriminatory metabolic subnetworks (refer to Figure S3). The Y-axis shows average enzyme abundance in all samples, and the X-axis shows differential abundance distribution between CF and control samples, which is calculated by dividing the difference between enzyme abundances in CF and control by their sum (refer to Materials and methods). Red and blue triangles indicate enzymes enriched in CF (more than 0) and control samples (less than 0),respectively. Solid triangles indicate oxidoreductases. Enzymes that are well-known to function in anti-OS response are indicated with solid triangles marked by circled numbers: ①, alkane hydroxylase; ②, rubredoxin reductase; ③, aldehyde dehydrogenase; ④, glutathione reductase; ⑤, alcohol dehydrogenase; and⑥, glutathione peroxidase.
The intensively increased redox-related activities in the CF microbiomes provide evidence for hypothesizing on the mechanism of dysbiosis in CF, where increased OS in CF airways selects for CF pathogens that are more resistant to OS than commensals. There have been sufficient documentations on the increased ROS level or OS in CF airways, which is one of its most apparent pathological features and correlates to the disease progression [33-35]. Some underlying mechanisms leading to high OS in CF are well-documented, including (i)malfunction of CFTR gene disables the transport of antioxidant thiocyanate (SCN) [36] and glutathione (GSH) [37,38]across airway epithelial cell membrane, which may be a primary factor that decreases SCN/GSH concentration and increase OS in the CF airways [39-41]; and (ii) recurrent and chronic infections caused by CF pathogens induce infiltration of neutrophils and macrophages, which usually release large amount of ROS [4]. To check if a microbiome component is associated with increasing OS, we must evaluate anti-OS capacity quantitatively at genome level for species. Even at such a level, sometimes we can start with a single strain but other time may use the concept of pangenome for a species or even pangenome of species for a genus.
Anti-OS capacity can be quantitatively evaluated at species level
Oxidative stress (OS) is almost ubiquitous for all microbes,which originates from both intrinsic redox reactions and extrinsic conditions, such as toxic chemicals, ultraviolet light,and immune attacks from hosts. Therefore, all microbial species bear a set of mechanisms encoded by their genome to confront OS. Molecular studies have been clarifying genes that participate in OS-response for both model bacteria such as S. aureus and P. aeruginosa or pathogenic species of a microbiome. Unfortunately, only a small portion of the anti-OS genes pool has been classified from the entire microbial world[42,43]. Some known common OS-response genes shared among species,especially those closely related,can be currently used to predict anti-OS capacities [44], but the strategy sometimes may actually fail when remote relatives bearing different anti-OS mechanisms and genes are put together [42,45]. It is fortunate that transcriptional responses to OS has been experimentally studied in various species across phyla,and the data can be used to predict anti-OS capacity for a given genome.These studies also indicate that OS-response is a complex process involving genes in many function categories, such as repair, escape, defense, and metabolic shift to anaerobic glycolysis,which are synchronized in the response to help survival of host bacteria and should be together considered for evaluating anti-OS capacity.
To systemically evaluate anti-OS capacity of a given species, we need datasets composed of genes that are experimentally confirmed to participate in OS-response as well as functional categories. By systemically searching primary experimental studies with gene expression information in response to ROS (Table S3), we construct an anti-OS gene dataset containing 504 anti-OS genes (protein families,Table S4). These genes are clustered into five functional categories according to the eggNOG database [46], i.e., Signal,Repair, Cell Wall, Regulation, and Metabolism (Figure 4).The Signal category includes classical OS sensors, such as phoP, and other signal sensors, such as irlR for heavy metal and cheY for chemotaxis. The Regulation category includes regulators, such as gapR, rpoS, rpoE, chrR, and hslO in the OS-response regulons. The Repair category is composed of proteins related to damage-repairing of DNA and other macro-molecules, such as recA, radC, uvrA, dnaE, and rtcB.Flagellar proteins such as flhF, flgE, fliC, as well as efflux pumps and transporters, are assigned in the Cell Wall category. The Metabolism category contains genes in glycolysis and pentose phosphate pathways to reduce aerobic respiration or genes participating in NADPH synthesis, such as zwf and pgm,and some detoxification proteins,such as katA and sodA.Accuracy of the collection depends largely on accuracy of gene function annotation,and can be further improved by intensive literature-based confirmation or database reference, such as more experimental evidence on broader taxa or uncharacterized genes becoming known in function.

Figure 4 Anti-OS capacity of species in airwayWe manually curated 44 common respiratory bacteria from articles and books; for each bacteria, the right panel indicates anti-OS capacity (proportion of anti-OS genes in the genome of each species) and the left panel displays a heatmap for copy number count from each anti-OS gene. NOG, non-supervised orthologous groups.
For each species,we select a representative genome(often a strain not a pangenome)and infer the presence of each anti-OS gene by a thorough search for protein families in the Pathosystems Resource Integration Center (PATRIC) based on a Markov clustering algorithm for cross taxa orthologs identification. An anti-OS capacity is subsequently quantitatively assessed as proportion of anti-OS genes over total protein-coding genes in a genome. Similarly, anti-OS capacity of a microbiome is evaluated as an average anti-OS capacity(proportion of anti-OS genes) of each species constituents and weighted by their abundance. As microbial genomes of a species also vary greatly, we have to check if a pangenome and the contributing strain genomes are conserved and anti-OS capacity within genus can be resolved based on 16S sequences. For each genus, we first select at least one representative genome for each species and subsequently calculate anti-OS capacity for each representative genome. Our results indicate that anti-OS capacity at species level for each genus vary in a very limited way (Figure S4), and the limited variation is possibly due to the fact that anti-OS response mechanisms among closely-related species are highly conserved, and so do their gene contents relevant to the OS response. Since 16S sequences are more readily available than those from shotgun sequencing,our conservation analysis provides a simple way to evaluate anti-OS capacity, which adds more assurance to the datasets. In addition, increased OS is commonly observed in pathogenesis of many other diseases,such as opportunistic infection in patients with COPD(chronic obstructive pulmonary disease)[47],diabetes mellitus[48],and empyrosis [49].
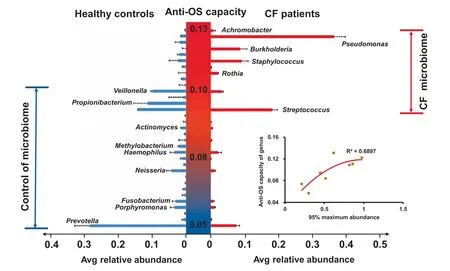
Figure 5 Comparative fitness analysis of species with different anti-OS capacity in microbiomes of CF patients and controlsThe central Y-axis shows average anti-OS capacity of each genus. The right and left X-axes show average relative abundance of each species in CF and control samples,respectively.For each species,the red and blue bars show average relative abundance in CF and control samples, respectively. The error bar indicates the upper limit of 95% confidence interval. Adaptive ranges of anti-OS capacity for the species in CF(red)and control(blue)microbiomes are labeled.The lower right inlet shows the correlation of 95% maximum abundance with average anti-OS capacity of major genera in microbiomes of CF patients, where 95% maximum abundance refers to the 95th percentile of the relative abundance of each species.
CF airway microbiomes are potentially reshaped by gradual increase of oxidative stresses
We first assess the number of species that have been reported to be frequently detected in human airways in current literatures; the key words include but not limited to CF pathogens(such as P. aeruginosa, Staphylococcus aureus, and Burkholderia cepacia), typical pulmonary pathogens (such as Streptococcus pneumonia,Klebsiella pneumonia),and commensals (such as Prevotella melaninogenica). The proportion of anti-OS genes are all above 0.1 among CF pathogens, but below 0.1 in some typical pathogens and aerobic commensals,and even below 0.05 in some anaerobic commensals(Figure 4).Collectively,the proportion of anti-OS genes of CF pathogens are significantly higher than other groups (P <0.001 in Wilcoxon test, Figure S5), which is in accordance with experimental comparison [50]. Therefore, CF pathogens may have stronger resistance to high-OS environments in CF airways and have greater potential to colonize and even to dominate the microbiomes. Meanwhile, high-OS in CF airways makes the microenvironment inhospitable for most OS-sensitive commensals especially anaerobic species that have much less anti-OS genes.Along with disease progression,ROS level gradually elevates, and eventually leads to chronic dominance of CF pathogens and diminishment of commensals, i.e., the state of dysbiosis.
We further interrogate anti-OS capacity at genus level based on fitness between CF and normal airways. For species in our data, we evaluate their average relative abundance in CF patients and controls separately for comparative fitness.We observe that species with high proportions of anti-OS genes are more abundant in the CF than in the control samples,whereas those with low proportions prefer normal airway environment. When sorted by anti-OS capacity, comparative abundance of species suggests that CF airways are more suitable for species with anti-OS capacity of 0.09-0.13,as compared to normal airways that are suitable for species with anti-OS capacity of 0.05-0.1 (Figure 5). In addition to average abundance, we also investigate maximum relative abundance,95% ,of species in the CF samples,which represents the ability of dominating the microbiomes or causing infections there,and find that it positively correlates to anti-OS capacity as well(Figure 5).Such positive correlations indicate that species anti-OS capacity may play an important role in pathogenicity, and such correlations are in accordance with previous reports on the role of anti-OS genes in infections [51-54].
As for anti-OS capacity of microbiomes, we observe a significant increase in adult CF samples when compared to early-stage patients and healthy controls.The difference is still significant even after removing the two most dominant CF pathogens in our samples, Pseudomonas and Burkholderia(Figure 6A). The result suggests that increased OS in CF not only selects for CF pathogens that dominate the microbiome but also has effects on the minor species constituents.Interestingly, antibiotics treatment increases anti-OS capacity of the CF microbiomes regardless if Pseudomonas and Burkholderia are included or not in the analysis (Figure 6B). Our observation agrees with previous studies where intensive antibiotics treatment often exaggerates microbiome dysbiosis as recently reviewed [10]. One possible reason is that a considerable portion of anti-OS genes is attributable in general to various stresses, such as genes in SOS response and toxic-antitoxic (T-AT)two-component system, which force the bacteria into the persister status and becoming resistant to most stresses [55,56].Antibiotics treatment is a severe stress, together with the OS,selects species with higher resistant to global stresses. Acute exacerbation of infection has been known to be a major factor for disease progression [4], which is always followed by increased neutrophils infiltration,ROS release,and antibiotics treatment;all factors forcing microbiomes to be more resistant to OS make infection more refractory.When we examine time courses of a single patient (the patient in Figure 2C), the anti-OS capacity of his microbiome appears increasing gradually and is accompanied by deteriorating dysbiosis,especially after episodes of acute exacerbation (Figure 6C).
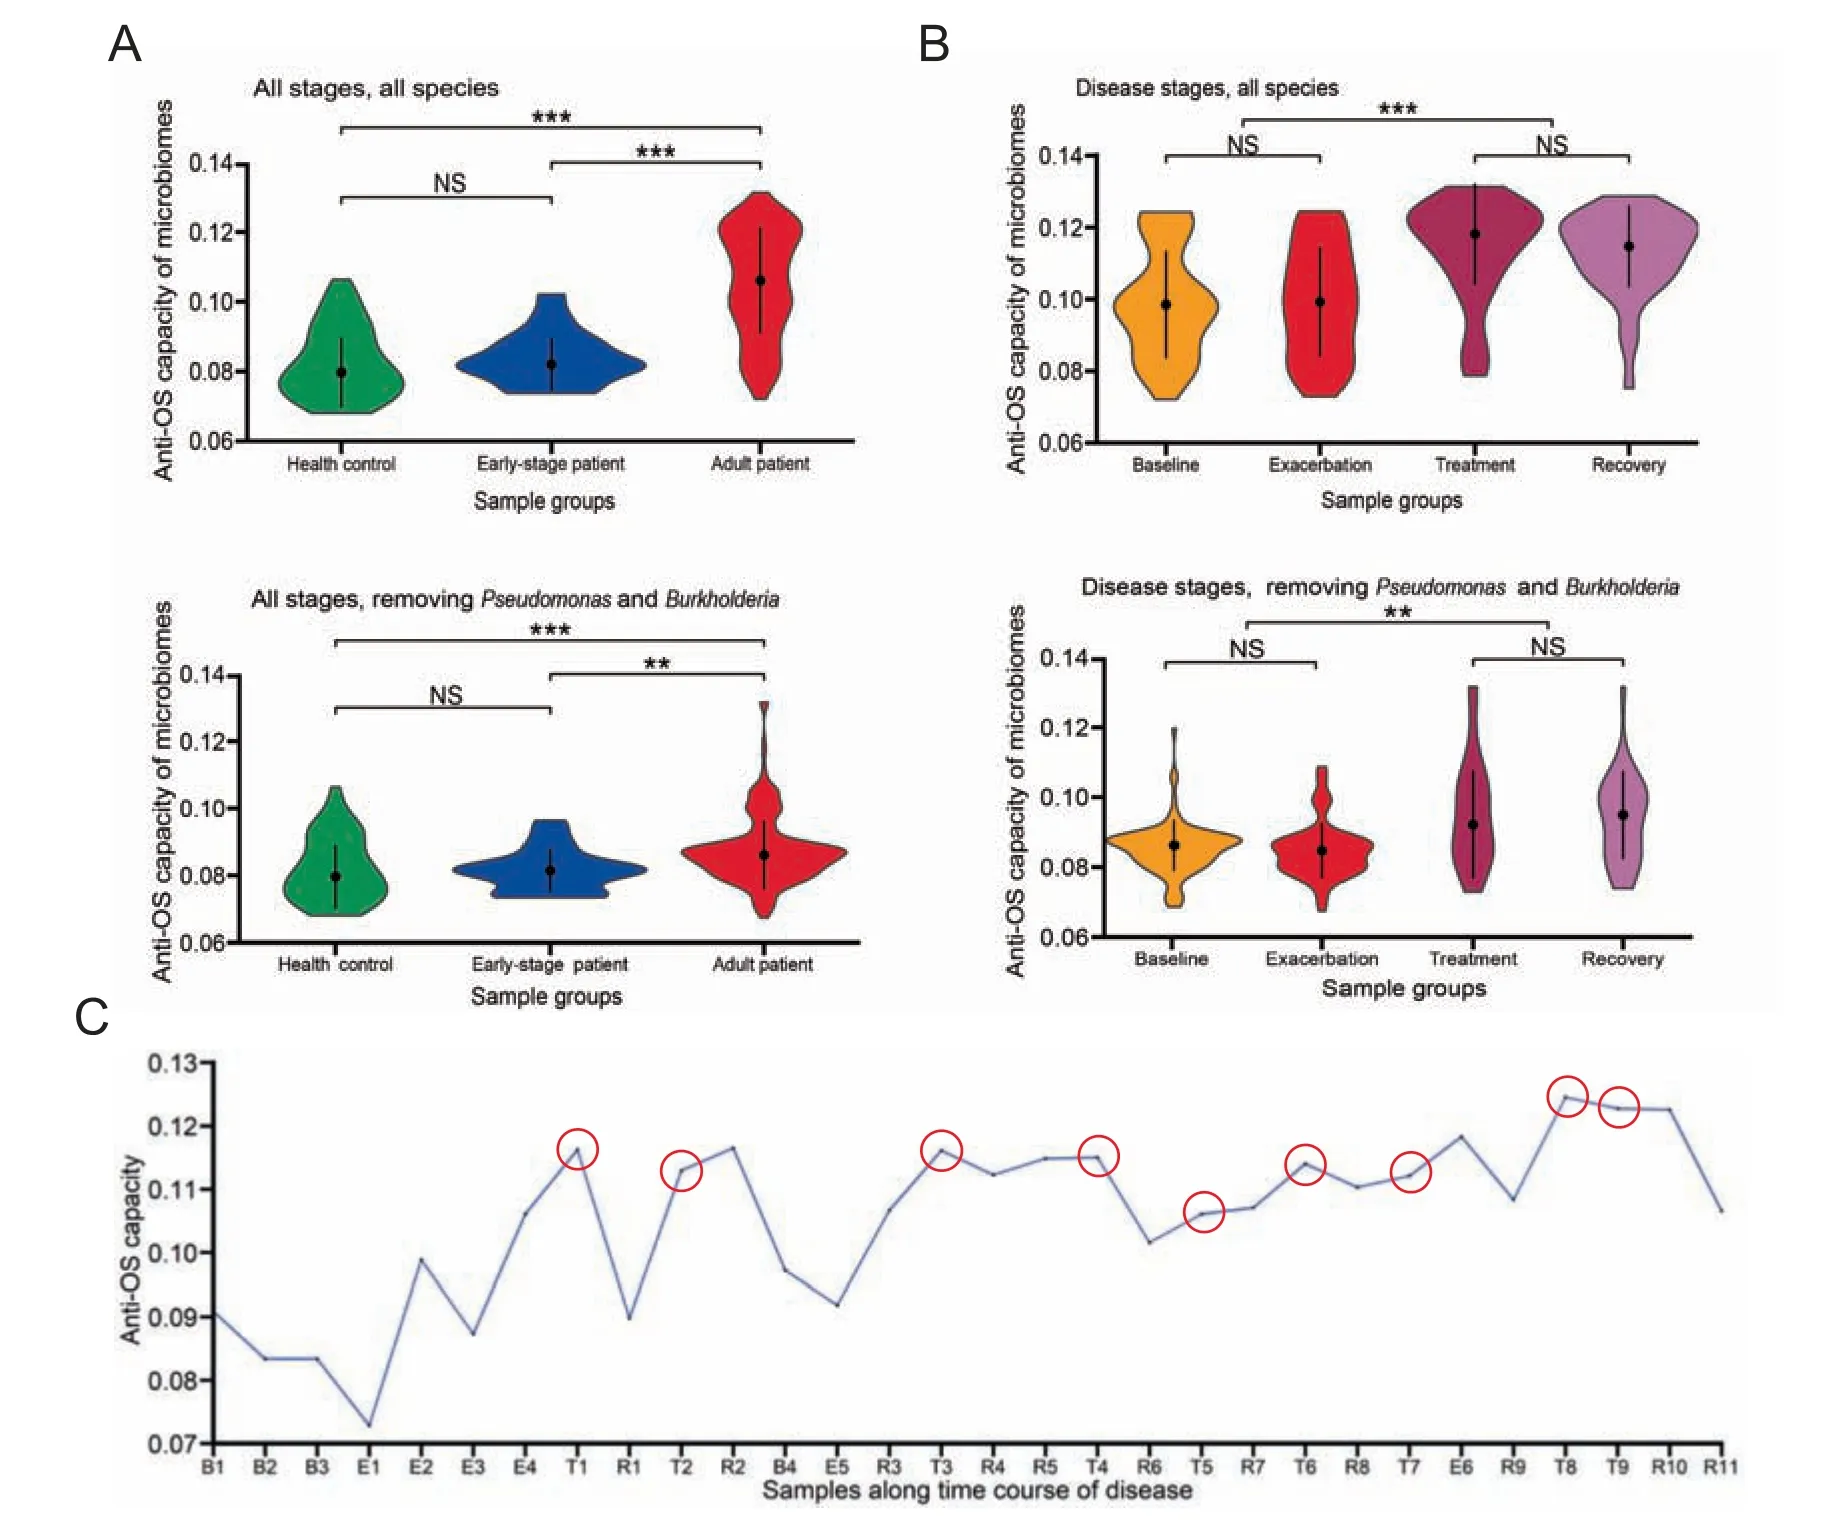
Figure 6 Increased OS forces the airway microbiome to achieve higher anti-OS capacityA.Anti-OS capacity in various patient groups.B.Anti-OS capacity in various disease stages.The upper panels show anti-OS capacity of total microbiomes, and the lower panels display that of minor species after excluding Pseudomomas and Burkholderia. P values for differences between various groups were calculated using Wilcoxon’s test.NS,non-significant;**,P <0.01;***,P <0.001.C.Anti-OS capacity of samples collected along the time course of patient P2 in a longitudinal study. Samples collected after intensive antibiotics treatment are indicated using the red circles.
Our results strongly support the hypothesis that CF pathogen domination and dysbiosis in CF airways may potentially be affected by increased OS. As the disease progresses in CF patients since birth,OS of their airway microbiomes gradually increases and eventually leads to a synchronous pathogen shift or multiple shifts with increasing anti-OS capacity. Therefore,we have observed that the low anti-OS capacity species H. influenza (0.085) is more prevalent at early stages, whereas the high anti-OS capacity species P.aeruginosa and B. cepacia(0.12-0.13) are more prevalent at late stages [57]. As OS becomes a potential reason promoting colonization of CF pathogens,anti-oxidative therapy may provide promising ways to control CF progression.In fact,incipient animal experiment and clinical trials have proven effective by inhaling GSH in reducing P. aeruginosa abundance and even in improving pulmonary functions [58,59]. Other studies have shown increased OS and dysbiosis [60] and effects of oral anti-oxidants in correcting dysbiosis in CF gut microbiomes [61]. Although GSH effect in general is still controversial [62], and varies among patients with gamma-glutamyltransferase (GGT, a GSH degrader) activity [63], anti-OS treatment, targeting one of the critical mechanisms in CF pathogen colonization,deserves further investigation, maybe in some larger trials and better formulation designs.
Conclusions
Although the studies we have collected for the current analysis are carried out before September 2015, the species profiles of the CF microbiome remain consistent thereafter.Furthermore,the anti-OS geneset we have curated has been constantly renewed according to the up-to-date literature and PATRIC database, and we are quite sure about its reliability for anti-OS capacity calculation. 16S data are known to have limitations for metabolic analysis,especially in the case of poor species assignment.However,16S data are still useful for inferring metagenome features by the application of some sophisticated tools,such as PICRUSt [64], Tax4Fun [65], and Piphillin [66],coupled with in-house approaches[67,68].In our case,the respiratory microbiome is rather simple as compared to the complicated intestinal microbiomes. Over 90% 16S reads are mapped to known genera,and 34 genera(take up to 90.6% relative abundance) are detectable in >10% samples with relative abundance >1% in at least one sample, and 14 genera(taking up to 80.4% relative abundance) are well-known human respiratory bacteria based on high-quality reference genomes. Furthermore, the anti-OS genes are very conserved within genus as shown in Figure S4, so that analysis based on 16S data,albeit not always credible,is still deemed reliable.
By carrying out meta-analysis on high-quality studies of CF airway microbiomes based on anti-OS genes across various functional categories and species,we are able to quantitatively evaluate anti-OS capacity for any single species or microbiome, and based on such data, we verify the conservation of OS-response within genus and propose the greatly increased OS as a potential but important force that reshapes CF airway microbiomes to a more resistant status. The increased OS is a potential predisposition of the colonization and domination of CF pathogens, which points to the importance of monitoring airway OS level and developing antioxidants, especially in inhaled formulation,as a promising treatment strategy to control lethal infections. Moreover, a similar mechanism in other high-OS situations, such as some other opportunistic infections in patients with primary diseases, also deserves similar in-depth investigations.
Materials and methods
Collection of studies and the associated data
We searched literatures in the Web of Science with the following criteria: ‘‘Title: (cystic fibrosis OR healthy) AND Topic:(microbiome OR microbiota) AND Topic: (lung OR airway OR respiratory)”. And we also searched the NCBI SRA records with the same keywords.We checked the reference list of existing reviews and meta-analysis articles for additional studies. Unpublished sources of data are also included. All these papers and records are restricted to the time period from January 2006 to September 2015. We restricted our search to English literature only.
The following types of studies were included: (1) participants:adult or pediatric healthy individuals,and patients with CF in baseline, exacerbation, treatment, and recovery clinical state; (2) sample collection: bronchoalveolar lavage (BAL)fluid from healthy individuals and sputum from patients; (3)methods:target-amplicon sequencing of 16S rDNA hypervariable region; (4) long-read sequencing platform: 454 GS FLX titanium platform; (5) sequencing data availability: raw data could be downloaded from the NCBI SRA system or other websites. Two authors independently performed text mining in the titles and abstracts of these publications for eligible studies. Full-text articles were retrieved after text mining, and reviewed by the same two authors to make decision for inclusion. Confused inclusions were resolved based on thorough discussion.
OTU picking and taxonomic assignment
There have been several tools available for handling 16S data,such as UPARSE, QIIME, and Parellel-META [69-71]. We chose a combination of UPARSE and QIIME for this study.We removed the adapter and primer and filtered the reads with parameters (250 bp ≤length ≤1000 bp, average quality score≥25, no ambiguous base in first 250 bp). Then, we pooled the reads from the same study, trimmed them to 250 bp in length, and reduced the cleaned reads to unique sequences,and clustered the final reads to OTUs (operational taxonomic units)with 97% minimum pair-wise sequence identity by using UPARSE (USEARCH v8.1.1861) [69]. We also removed chimeric reads and singletons.As the reads in this work are from different variable regions of 16S rDNA,we clustered OTU for different studies. After OTUs clustering, the reads from each study were mapped to OTUs with 97% identity for building OTU tables. Finally, the representative OTUs were assigned to appropriate taxonomy by using UCLUST algorithm [72]and Greengenes database(version 13_8) [73]with a 97% minimum percent similarity in QIIME (v1.8.0) [70]. We further pooled the OTUs assigned to the same taxonomy across the studies and summarized all OTUs from the same genus (including all species it contains)to construct a genus-level table,which was further rarefied by vegan (v2.4.2). All the downstream analyses were based on this rarefied genus-level table.Samples with <1000 reads included in OTUs assigned to known taxonomy were removed, and studies with <80% eligible samples were further excluded. All eligible samples were pooled and regrouped into six groups of healthy control,early-stage patient,and four stages of adult patients,i.e.,baseline, exacerbation, treatment, and recovery.
Microbiome diversity and species correlation
To compare community diversity for each sample group, we calculated the Shannon index and the Bray-Curtis distance as showcased in the NMDS plot, using vegan (version 2.4-2)[74]. We further calculated the Spearman’s rank correlation coefficient (ρ) using R scripts [75] and set cutoffs of positive and negative correlations as |ρ|>0.4 (P <0.01).
Selection of representative genomes for genus and metabolic analysis
For each genus, we selected one representative genome from the PATRIC database. Complete genomes were given priority over drafts; poorly assembled genomes (>100 scaffolds) were not included for the current study. The criteria for genome selection were: (i) strains reported in the human respiratory system; (ii) strains reported in human but not respiratory;and (iii) strains reported in non-human animals and environmental.The representative genomes were annotated according to the PATRIC Bioinformatics Resource Center (https://www.patricbrc.org)[76].We reconstructed genome-scale metabolic models to predict in silico nutrition requirement and metabolite generation for each representative genome and calculated the value of MIP and MRO for each genome pair according to method as described [28]. For each species pair,an MIP value is the number of metabolites, which they can provide for each other,and an MRO value is the overlap ratio of resource requirements.
Inference of metabolic diversity between CF and control microbiomes
We used BiomeNet [30] to infer compositional metabolic subnetworks of CF and healthy control samples quantitatively by limiting reactions with enzyme abundance, including substrates and products of the enzymes. The method for selecting representative genomes is as described above. Enzyme abundance of each sample was normalized according to the number of rDNA clusters and calculated as the sum of isoenzymes in representative genomes. Multiple subunits of a given enzyme were merged.From the BiomeNet results,we listed all enzymes in the discriminative subnetworks and calculated their differential distribution between CF and control samples as:
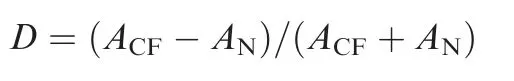
Here, D is the differential distribution of an enzyme between CF and control samples.ACFis the enzyme’s average abundance in the CF samples, and ANis that of the controls.
Anti-OS gene curation and anti-OS capacity calculation
To construct anti-OS gene database, we first used the criteria‘‘Topic: (peroxide transcriptome bacteria)” to search articles in Web of Science, and manually curated all primary experimental studies that supply the transcriptome or expression profile of specific species in response to in vitro treatment of peroxides including H2O2, paraquat, diamide, and sodium hypochlorite, based on RNA-Seq or microarray experiments by Jan 2017. We recruited 34 studies from 54 experiments,which involve 24 bacterial species. Genes whose expression was upregulated over two-fold in response to peroxide treatment in at least two experiments were collected as candidates.All candidate genes were annotated and clustered by using PATRIC, which uses PATtyFams to group genes into protein families across species[76].The clustered protein families were further assigned to function categories by mapping to the egg-NOG database with HMMER, and those without function annotation or not relevant to OS-response,which includes signal transduction, regulation, protective reaction, repair process, or conversion to anaerobic metabolic, were removed from the final database. Species belonging to CF pathogens,typical pathogens, and commensals were manually curated from review articles, books, and our studies. Representative genomes were also annotated by using PATRIC and their gene hits to our database were classified as anti-OS genes. Anti-OS capacity of a species is defined as proportion of anti-OS genes in all protein-coding genes of the species,and anti-OS capacity of a genus is an average of collective anti-OS capacity from all representative species genomes:

Here, Ps is anti-OS capacity of a species, Na is the number of anti-OS genes of the species genome, and Nc is the number of all coding genes of a species genome.
Anti-OS capacity of a sample or microbiome is calculated as abundance weighted average proportion of anti-OS genes of all component genera of the microbiome:
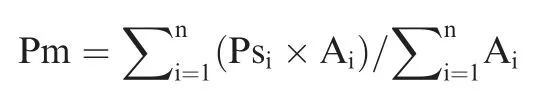
Here, Pm is anti-OS capacity of a microbiome, n is the number of component genera in the microbiome, Ps is anti-OS capacity of each genus, and A is genus abundance. In our case,only genera detectable in >10% samples with abundance >1% in at least one sample are accounted for.
Data availability
The clean sequence data used in this study have been deposited in the Genome Sequence Archive[77]in BIG Data Center[78],Beijing Institute of Genomics (BIG), Chinese Academy of Sciences (GSA: CRA000583), which are publicly accessible at http://bigd.big.ac.cn/gsa.
Authors’ contributions
JY and YK conceived the project and led the writing; XS and ZG collected studies;XS,QL,LZ,and QM analyzed the data.All authors contributed to the writing and/or intellectual development of the manuscript, read and approved the final manuscript.
Competing interests
The authors have declared no competing interests.
Acknowledgments
The work is supported by the National Key R&D Program of China (Grant No. 2016YFC0903800) and the National Natural Scientific Foundation of China (Grant Nos. 31470180,31471237, and 31671350). This work was also supported by the National Science Foundation/Established Program to Stimulate Competitive Research (EPSCoR) (Grant No. IIA-1355423), the State of South Dakota Research Innovation Center, the Agriculture Experiment Station of South Dakota State University, and Sanford Health - South Dakota State University Collaborative Research Seed Grant Program, United States. The funding bodies have no roles in the design of the study, as well as collection, analysis, and interpretation of data and in writing the manuscript.
Supplementary material
Supplementary data to this article can be found online at https://doi.org/10.1016/j.gpb.2018.03.009.
 Genomics,Proteomics & Bioinformatics2019年6期
- Genomics,Proteomics & Bioinformatics的其它文章
- SPOT-Disorder2: Improved Protein Intrinsic Disorder Prediction by Ensembled Deep Learning
- A Computational Approach for Modeling the Allele Frequency Spectrum of Populations with Arbitrarily Varying Size
- Schizophrenia-associated MicroRNA-Gene Interactions in the Dorsolateral Prefrontal Cortex
- Large-scale Identification and Time-course Quantification of Ubiquitylation Events During Maize Seedling De-etiolation
- Multi-omics Analysis of Primary Cell Culture Models Reveals Genetic and Epigenetic Basis of Intratumoral Phenotypic Diversity
- Tung Tree (Vernicia fordii) Genome Provides A Resource for Understanding Genome Evolution and Improved Oil Production