
Alisol B 23-acetate-induced HepG2 hepatoma cell death through mTOR signaling-initiated G1 cell cycle arrest and apoptosis: A quantitative proteomic study
2019-05-25 07:49:30JiXiaQiangLuoShengbinHuangFuquanJiangLinWangGuanghuiWangJingjingXieJieLiuYangXu
Ji Xia, Qiang Luo, Shengbin Huang, Fuquan Jiang, Lin Wang, Guanghui Wang, Jingjing Xie,Jie Liu, Yang Xu
1School of Pharmaceutical Sciences, Fujian Provincial Key Laboratory of Innovative Drug Target Research, Xiamen University, Xiamen 361101,China;
2Department of Oncology, Zhongshan Hospital of Xiamen University, Xiamen 361004, China;
3Institute of Gastrointestinal Oncology,Medical College of Xiamen University, Xiamen 361101, China
Abstract Objective: The present study aimed to investigate the molecular events in alisol B 23-acetate (ABA) cytotoxic activity against a liver cancer cell line.Methods: First, we employed a quantitative proteomics approach based on stable isotope labeling by amino acids in cell culture (SILAC) to identify the different proteins expressed in HepG2 liver cancer cells upon exposure to ABA. Next, bioinformatics analyses through DAVID and STRING on-line tools were used to predict the pathways involved. Finally, we applied functional validation including cell cycle analysis and Western blotting for apoptosis and mTOR pathway-related proteins to confirm the bioinformatics predictions.Results: We identified 330 different proteins with the SILAC-based quantitative proteomics approach. The bioinformatics analysis and the functional validation revealed that the mTOR pathway, ribosome biogenesis, cell cycle, and apoptosis pathways were differentially regulated by ABA. G1 cell cycle arrest, apoptosis and mTOR inhibition were confirmed.Conclusions: ABA, a potential mTOR inhibitor, induces the disruption of ribosomal biogenesis. It also affects the mTOR-MRP axis to cause G1 cell cycle arrest and finally leads to cancer cell apoptosis.
Keywords: Alisol B 23-acetate; apoptosis; cell cycle; mTOR; ribosome proteins
Introduction
The rhizome of Alisma orientale has been widely used in traditional Chinese medicine for the treatment of edema,high blood cholesterol, diabetes and urinary disturbance(1,2). Its components include a series of protostane-type triterpenoids, including alisol A and B and alisol monoacetates and sesquiterpenes such as alismols A, B, and C. In recent years, several alisol B acetates have been identified, all of which have the effect of inhibiting nitric oxide production and also have antiallergic effects. Alisol B 23-acetate (ABA) has been found to exhibit significant cytotoxic activity against several cancer cell lines, including PC-3, SGC-7901, MDA-MB-231 and MCF-7 cell lines(3,4). However, the detailed molecular basis of ABAtriggered cell death remains largely unknown.
The mammalian target of rapamycin (mTOR), a type of Ser/Thr kinase, is responsible for amino acids, oxygen,energy levels, and growth factors that promote protein synthesis, lipogenesis, energy metabolism, autophagy inhibition, lysosome formation, cell cycle progression,apoptosis and many important cellular processes (5,6). The association between abnormal mTOR pathways and tumors reinforces the importance of considering mTOR as a target in cancer therapy. mTOR, a key kinase downstream of PI3K/AKT, participates in a number of cellular functions by activating its downstream effectors, such as S6K1,4EBP1 and eIF4E (7,8). As a central controller of cell growth, mTOR regulates ribosomal biosynthesis by promoting mRNA translation of ribosomal proteins (RPs)and affecting ribosomal RNA (rRNA) synthesis (9,10).Inhibition of mTOR signaling by rapamycin treatment results in a rapid and significant down-regulation of rRNA gene transcription and pre-rRNA processing. When the mTOR pathway is over-activated, it causes production of many proliferation-related mRNA transcripts, synthesizes the desired growth-promoting proteins, and accelerates cell proliferation. Inhibition of the mTOR pathway leads to cell cycle arrest in G1 phase. This effect is correlated with a down-regulation of cyclin D1, CDK4 and retinoblastoma(Rb) phosphorylation (11). The function of mTORinvolved apoptosis appears to be dictated by cellular backgrounds and multiple downstream targets, including the well-known apoptotic regulatory proteins such as p53,Bad, Bcl-2, DR5 and caspases (12).
In the present study, we employed a stable isotope labeling by amino acids in cell culture (SILAC) quantitative proteomic approach to identify proteins regulated by ABA in the hepatoma cell line HepG2. We found that several mTOR/ribosome proteins, FAS/caspase-related apoptotic proteins, and cell cycle-related proteins were involved in ABA-induced HepG2 cytotoxicity. Further functional studies showed that ABA treatment resulted in inhibition of mTOR and ribosome synthesis and triggered cell cycle arrest and apoptosis in HepG2 cells. These results demonstrate that ABA is perhaps a new mTOR inhibitor and may induce death of cancer cells by cell growth arrest and apoptosis.
Materials and methods
Cell culture and reagents
HepG2 hepatoma cells were cultured in Dulbecco’s modified eagle medium (DMEM) (high glucose) medium supplemented with 10% fetal bovine serum (FBS) plus antibiotics at 37 °C in a 5% CO2atmosphere. ABA(Figure 1A) was purchased from the National Institute for the Control of Pharmaceutical and Biological Products. It was dissolved in phosphate-buffered saline (PBS) and stored at -20°C until use. Lipofectamine 2000 from Invitrogen (Carlsbad, CA, USA) and a cocktail of proteinase inhibitors from Roche (Meylan, France) were used in this study. All other chemicals used were commercial products of analytic grade obtained from Sigma (St. Louis, MO, USA).
3-(4,5-Dimethylthiazol-2-yl)-2,5-diphenyltetrazolium bromide (MTT) assay
To measure half maximal inhibitory concentration (IC50) of ABA in HepG2 cells, an MTT assay was performed.Following a method reported previously (13), the cells were seeded in 96-well plates at 1×10⁴/well in complete medium and incubated for 24 h. The medium was then substituted with medium containing various amounts of ABA. Next,10 µL of 5 µg/mL MTT was directly added to each well while the cells continued to be incubated at 37 °C for 4 h.At the end of the experiments, 100 µL of DMSO was used to dissolve formazan, and the absorbance was measured at 560 nm on a Victor 3 V multiwell plate reader from Perkin Elmer.
SILAC labeling
HepG2 cells were grown in DMEM (SILAC standard)containing light (12C, 14N) or heavy (13C, 15N) lysine and arginine supplemented with 10% dialyzed FBS for 2 weeks. The light-labeled HepG2 cells were treated with 10 µmol/L ABA for 10 h. The heavy-labeled HepG2 cells were treated with DMSO. The cells were then harvested and suspended with 8 mol/L urea lysis buffer (8 mol/L urea in 0.2 mol/L Tris/HCl, 4 mmol/L CaCl2, pH 8.0). The supernatant fractions were collected, and protein concentration was determined by BCA assay (Pierce,Thermo Fisher Scientific, Waltham, MA, USA) (14-16).
Filter-aided sample preparation
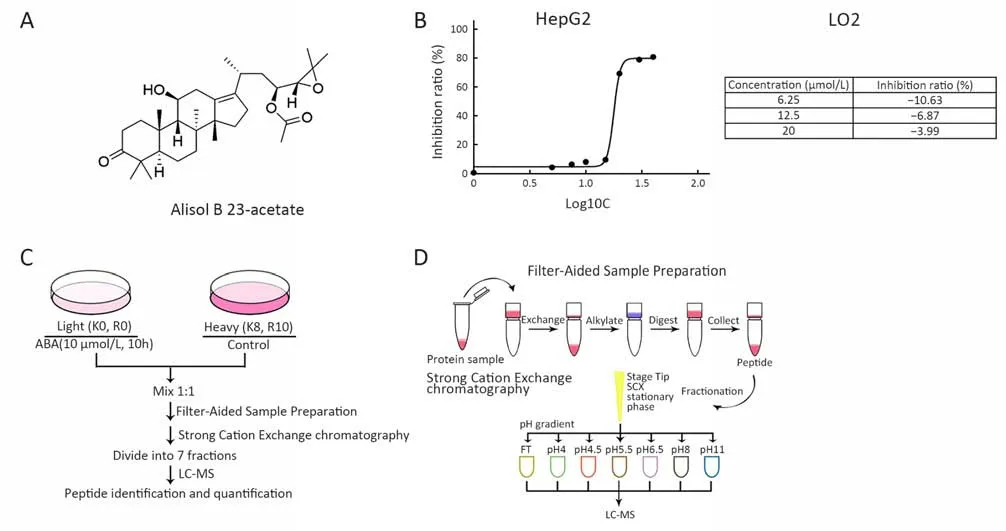
Figure 1 Anti-cancer effect of alisol B 23-acetate (ABA). (A) Structure of ABA; (B) HepG2 cells and LO2 cells were treated with ABA in a gradient of concentration and cell proliferation was determined by 3-(4,5-dimethylthiazol-2-yl)-2,5-diphenyltetrazolium bromide (MTT)assay. Half maximal inhibitory concentration (IC50) value was determined to evaluate the inhibition of tumor cell growth by ABA. The value was the mean value of three independent experiments; (C) Workflow of sample preparation and management. Light (12C, 14N) or heavy(13C, 15N) lysine and arginine labeled HepG2 cells were treated with or without ABA, and then mixed with 1:1 by protein weight followed by LC-MS/MS analysis; (D) Workflow of Filter Aided Sample Preparation and strong cation exchange chromatography.
The “light” and “heavy” lysates were mixed at a ratio of 1:1 by protein weight, and then all samples were digested and fractionated before high-performance liquid chromatography-mass spectrometry (HPLC-MS) analysis (Figure 1C,D). Then 125 μg of each sample was mixed with 200 µL of 8 mol/L urea in 0.1 mol/L Tris/HCl (pH 8.5). This mixture was transferred into a filter device and centrifuged at 14,000× g for 40 min. The retentate was then diluted with 200 µL urea buffer and centrifuged at 14,000× g. We repeated this step twice. We alkylated the resulting retentate with 100 µL of 0.05 mol/L iodoacetamide in urea buffer at room temperature for 20 min in the dark. After centrifugation, we added 100 µL of urea buffer in 0.1 mol/L Tris/HCl (pH 8.0) on top of the filter and centrifuged the filter at 14,000× g and then repeated this step twice. The retentate was digested in 120 µL of 0.05 mol/L NH4HCO3with trypsin (enzyme-to-protein ratio 1:50) on the filter. We incubated the units at 37 °C for more than 16 h. The digests were collected by centrifugation, and the filter devices were rinsed with 50 µL of 0.5 mol/L NaCl and centrifuged again. Then the resulting solutions were acidified with trifluoroacetic acid(TFA) at a final concentration of 1% (17).
Strong cation exchange chromatography (SCX) peptide fractionation and LC-MS/MS analysis
Peptides digested through filter-aided sample preparation(FASP) were fractionated using SCX StageTips.Approximately 80 µg of peptides were distributed with
SCX StageTips combined six Empore SCX disks as described by the manufacturer for a StageTip in a 200 μL pipet tip. In total, 8 SCX fractions were collected by elution in SCX conditioning buffer, SCX buffers at pH 4.0,4.5, 5.5, 6.5, 8.0 and 11.0. All samples were dried in a SpeedVac and then resuspended in 0.1% FA prior to LCMS analysis. Fractions were eluted with gradient buffer solution (Buffer A, 0.1% formic acid; Buffer B, 0.1%formic acid in ACN) and separated on Acclaim pepMap 100 nano Vipar C18 colum (50 µm × 15 cm, 2 µm, 100 Å)over 120 min. The eluate was then analyzed online using a Q-exactive mass spectrometer operated in a datadependent mode.
Protein identification and quantitation
Protein identification and quantitation were automatically performed using Thermo Proteome Discoverer (PD 1.4.0288, Thermo Fisher Scientific) software against the UniProt human protein database as previously described(18). The precursor ion mass tolerance was 10 ppm; the fragment ion mass tolerance was 0.5 Da. The false discovery rate (FDR) of protein, peptide and site was 0.01.
The normalized ratio of light versus heavy SILAC was automatically calculated by the PD program.
Bioinformatics analysis
The proteins that were identified as being altered were subjected to various bioinformatic on-line tools for interpretation. DAVID 6.7 was applied (http://david.abcc.ncifcrf.gov/) to data annotation and for understanding the biological context (19). Panther 9.0 (http://www.pantherdb.org/) was used to analyze proteins through their evolutionary relationships and bring out information on molecular functions, biological processes and cellular components (20). The interactions of the differentially regulated proteins were interpreted by STRING version 10(http://string-db.org/) (21).
Western blotting
Western blotting analysis was performed as previously described (22). Equal amounts of protein were separated by sodium dodecyl sulfate-polyacrylamide gel electrophoresis(SDS/PAGE). After transferring onto membranes, the proteins were probed with corresponding antibodies and detected with ECL detection reagents (GE Healthcare).The primary antibodies for anti-caspase-3 antibody, anticleaved caspase-3 antibody, anti-poly-ADP-ribose polymerase (PARP) antibody, anti-phosphorylated mTOR(p-mTOR) antibody, anti-p-p70S6K antibody, anti-p-S6 antibody, anti-p-4E-BP1 antibody, anti-CDK4 antibody,anti-Cyclin D1 antibody, anti-p-Rb antibody, and anti-Rb were purchased from Cell Signaling Technology (Beverly,MA, USA). Anti-β-actin was from Sigma (St. Louis, MO,USA). Secondary anti-mouse and rabbit antibodies were purchased from Thermo Fisher Scientific, Inc. (Waltham,MA, USA), polyvinylidene difluoride membranes were from Millipore (Billerica, MA, USA), and enhanced chemiluminescence reagents were from GE Healthcare(Buckinghamshire, UK).
Real-time polymerase chain reaction (PCR)
Total RNA was extracted with Trizol. A total of 2 mg RNA was used to prepare cDNA using oligo (dT)12 as a primer.A TIANScript RT Kit was used for real-time PCR analysis.Each sample was run in triplicate. The relative RNA amounts were calculated with the DDCt method on an ABI StepOne PCR instrument and normalized with an internal control, GAPDH. Primers were as follows: GAPDH(forward primer, 5’-ATG GGG AAG GTG AAG GTC GG-3’; reverse primer, 5’-GAC GGT GCC ATG GAA TTT GC-3’); EIF3L (forward primer, 5’-GAA CCA GGG AGA CGT TGT GT-3er reverse primer, 5’-AGT ACG GTT TGT GGC CTT TG-3’); RPS15A (forward primer,5’-GTG CTT ATT AGG CCG TGC TC-3’; reverse primer, 5’-TTC TGC CAT TTT TCC AGG TC-3’);FKBP9 (forward primer, 5’-TAC CAC TAC GTG GGG ACG TT-3’; reverse primer, 5’-CTT CAT TTC CGT AGG CAA GC-3’); EIF2B2 (forward primer, 5’-TCA AGA TTA TCC GGG AGG AG-3’; reverse primer, 5’-ATG GAA GCT GAA ATC CTC GT-3’); and RPS6KA1(forward primer, 5’-ATG GAG CTA GTG CCT CTG GA-3’; reverse primer, 5’-TCA TAG CAT ACA GGT GCC CA-3’).
Flow cytometry assay
Apoptosis was determined by dual staining using Annexin V:FITC and propidium iodide (PI, Invitrogen). Briefly,cells were seeded into 24-well cell culture plates (1×10⁵cells/well) and treated with ABA for 10 h. Cells were dissociated from wells with 0.25% trypsin, spun at 400× g for 5 min, resuspended in Annexin V binding buffer, and stained with 1 µL Annexin V: FITC for 15 min and 1 µL propidium iodide for 5 min. Cells were analyzed using a fluorescence activated cell sorter (FACS) Calibur System(BD Biosciences, San Jose, CA, USA). The relative proportion of Annexin V-positive cells, representing apoptotic cells, was determined using FlowJo software(FlowJo LLC, Ashland, OR, USA).
Apoptosis assays
For 4’,6-diamidino-2-phenylindole (DAPI) staining, cells were collected and incubated in PBS containing 50 µg/mL of DAPI and 100 µg/mL of DNase-free RNase A at 37 °C for 20 min. Apoptotic cells were identified with typical morphology of shrinkage of the cytoplasm, membrane blebbing, and nuclear condensation and/or fragmentation.At least 300 cells from more than five random microscopic fields were counted by two independent investigators.
Statistical analysis
Statistical significance of differences was calculated by a two-tailed Student’s t test. All data are shown as.Reproducibility was confirmed in three separate experiments. All statistical analyses were performed using Microsoft office 2010 Excel. P<0.05 was considered statistically significant.
Results
Cytotoxicity of ABA in HepG2
To select the lead compounds with anti-liver cancer potency, we screened 100 compounds in QGY-7701,QYG-7703, HepG2 and LO2 cell lines using the MTT assay (data not shown). We found that ABA exhibited greater cytotoxicity than other compounds on the HepG2 cell line, with the lowest IC50value of 17.82 µmol/L. ABA(20 µmol/L) applied for 24 h does not inhibit growth of the human liver cell LO2 (Figure 1B). This was consistent with reports that ABA has the potential to protect liver cells(23,24) and selectively inhibit cancer cells. Therefore, ABA may have great potential for clinical treatment of liver cancer. To identify an early event responsible for the biological effects, short-term administration of ABA in HepG2 cells was considered, and a condition of 10 h of treatment with 10 µmol/L ABA was chosen for the following proteomic analysis.
Identification of ABA-regulated proteins
Two biological replicates of SILAC were performed with or without 10 µmol/L ABA treatment for 10 h in light- or heavy-labeled HepG2 cells, respectively (Figure 1C). The protein samples were divided into seven fractions by strong cation exchange chromatography (Figure 1D). The ratio L/H was automatically normalized by the PD program. In total, 4,843 proteins and 4,740 proteins with at least one unique peptide were detected. Among these identified proteins, 3,884 proteins and 3,836 proteins were quantified,and 3,121 quantified proteins were again detected in the replicates (Figure 2A). Proteins were selected based on the presence of one or more peptides. The log2 (light: heavy)ratio was significantly altered and finally filtered by a Pearson correlation (Figure 2C) for a representative pair.After removing abundant proteins that might be nonspecifically captured by ABA treatment, we had a total of 330 candidate proteins. These final target proteins had|log2 (light/heavy)| ratios equal to or greater than 0.5 in two replicates, and the Pearson correlation was 0.91 (Figure 2A—C).
Bioinformatics analysis
Gene ontology and network analysis can provide suggestions of biological processes and corresponding pathways that may be responsible for ABA cytotoxicity in HepG2 cells. Therefore, the 330 proteins identified using two replicates of the SILAC approach were subjected to different bioinformatics online tools.
In the current investigation, an interaction network analysis through STRING indicated that there are three clusters of high stringency proteins (Figure 2D), including mTOR/ribosome proteins, FAS/caspase-related apoptotic proteins and cell cycle-related proteins. These three clusters are highlighted with blue, pink and yellow in Figure 2D, separately. The exact proteins in different pathways are listed in Table 1.
Using the DAVID online tool, 30.3% of the differentially regulated proteins were grouped into different biological functions by the Kyoto Encyclopedia of Genes and Genomes (KEGG) pathway analysis. These functions included ribosome function, RNA degradation and purine metabolism (Table 2). Also, through a BIOCARTA pathway analysis, four significant pathways were found, as shown in Table 3. These included the Fas signaling pathway, the caspase cascade in apoptosis, the mTOR signaling pathway, and induction of apoptosis through DR3 and DR4/5 death receptors. Enriched categories were sorted by percentage value and determined by two criteria: a minimum of three altered genes and a P<0.05 (Table 3).
Quantitative proteomic analysis reveals activation of mTOR signaling pathway in ABA-induced HepG2 cell cytotoxicity
Among the activated pathways in ABA-treated HepG2 cells, there was over-representation of mTOR pathway components, which caught our attention. Many mTOR signaling pathway-related proteins were differentially regulated by ABA (Figure 2D, Table 1). Furthermore, we identified altered expression of phospho-mTOR, p70 S6K,S6 and 4E-BP1 by Western blotting (Figure 3A). We also saw alterations in the mRNA levels of EIF3L, RPS15A,FKBP9, EIF2B2, RPS6KA1 and EIF4A2 by real-time PCR assays (Figure 3B). The phosphorylation levels of mTOR,p70S6K, S6 and 4E-BP1 were inhibited by the treatment of cells with ABA in a dose-dependent manner (Figure 3A).Meanwhile, the mRNA levels of EIF3L, RPS15A, FKBP9,EIF2B2, RPS6KA1 and EIF4A2 were also reduced by ABA treatment (Figure 3B). These results indicated that ABA may be a potential mTOR inhibitor.
Effect of ABA on ribosomal biosynthesis in HepG2 cells

Figure 2 Final candidates after Alisol B 23-acetate (ABA) treatment were analyzed by STRING. (A) Candidates of all quantified proteins overlap from biological replicate experiments for HepG2 cells. A total of 3,121 quantified proteins were repeated in both replicates of which total quantified proteins are 3,884 and 3,836, respectively. Among the overlap, 330 quantified proteins were selected as final candidates; (B)Pearson correlation plot for overlapping candidates from two experiments (Ex.). X axis: log2 [light (L): heavy (H)] Ex.1 value; Y axis: log2[light (L): heavy (H)] Ex.2 value; (C) Log2 (L:H) plot for whole cell proteins from HepG2 cells (Ex.1.2 overlap proteins) and scheme for identification of candidate proteins; (D) Interaction of differentially expressed proteins quantified in both replicates after ABA administration, mapping with the STRING database. Three clusters are separately highlighted with blue, pink and yellow color.
DAVID pathway analysis showed that there are eight genes involved in ribosomal biogenesis; these are highlighted with red pentagrams (Figure 4A). Based on our bioinformatics results, we found 28 RPs that were differentially regulated by ABA (Figure 4B), and most of them come from mitochondria (Table 4). It has been reported that the destruction of ribosomal biosynthesis is associated with mTOR and its corresponding signaling pathways. Combined with the observation of decreased phosphorylation of p-mTOR, p-p70 S6K and p-4E-BP1 by ABA treatment (Figure 3A), this suggests that ABA may mediate the destruction of ribosomal biosynthesis through mTOR signaling.

Table 1 Categories of final selected candidates by STRING and DAVID pathways analysis

Table 2 Categories of final selected candidates through KEGG-pathway

Table 3 Categories of final selected candidates through BIOCARTA-pathway
Inhibition of G1 arrest through CDK4/cyclin D1/Rb pathway by ABA
According to the above-mentioned bioinformatics results,ABA influences the expression of many cell cycle proteins,including CDC6, CDC16 and MRPL41. To determine whether ABA affected cell cycle progression, HepG2 cells treated without or with 10 μmol/L and 15 μmol/L ABA for 20 h were analyzed by FACS. As shown in Figure 5A,B, the percentage of cells in the G1 phase increased in the ABAtreated group as compared with the control group. Cell cycle progression through G1 is mainly regulated by the sequential activation of cyclin D/CDK4/CKD6, which induces the phosphorylation of Rb and the release of E2F.To investigate the mechanism of ABA-induced G1 arrest in HepG2 cells, we analyzed the expression of CDK4, cyclin D1, Rb and phospho-Rb by immunoblotting. The expression of CDK4, cyclin Dl, Rb and phospho-Rb decreased by treatment of cells with ABA for 20 h in a dose-dependent manner (Figure 5C).
ABA induces apoptosis in HepG2 cells
Apoptosis has an important role in cancer biology, therapy and prevention. ABA induced apoptosis in HepG2 cells,but how apoptosis of cancer cells is regulated by ABA remains undefined. The toxic effect of ABA was examined by assessing its ability to induce caspase-3 and PARP cleavage. Western blotting clearly showed cleavage of caspase-3 and PARP after 15 μmol/L ABA treatment for 10 h (Figure 6A). In addition, DAPI staining showed that treatment of HepG2 cells by 15 μmol/L ABA for 10 h resulted in about 46.18%±1.27% of cells displaying nuclear condensation and fragmentation (Figure 6B). Furthermore,Annexin V/PI staining showed ABA-induced late apoptosis as Annexin V+/PI+ cells were increased from 5.85% to 44.89% when they were treated with 15 μmol/L ABA for 10 h (Figure 6C). To determine whether ABA could induce apoptosis through inhibiting mTOR signaling in HepG2 cells, we took advantage of a constitutively active mTOR allele, L1460P (25). We found mTOR (L1460P) could increase p70 S6K phosphorylation, suggesting the mutant works well (Figure 6D). We next examined whether expression of the mTOR L1460P mutant could inhibit apoptosis induced by treatment with 15 μmol/L ABA for 10 h, and we found that ectopic expression of mTOR L1460P decreased PARP cleavage in HepG2 cells(Figure 6E). These observations provide further support to our hypothesis that ABA-induced apoptosis is dependent on ABA-associated mTOR inhibition.
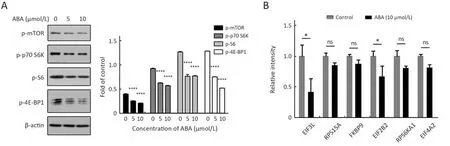
Figure 3 Alisol B 23-acetate (ABA) inhibits mTOR signaling pathway. (A) HepG2 cells were treated with ABA for 10 h at the concentration of 5 μmol/L and 10 μmol/L. Phospho-mTOR (ser2448), phosphor-p70 S6K (Thr389), phosphor-S6 ribosomal protein (ser235/236) and phosphor-4E-BP1 (Thr37/46) were evaluated by Western blotting and densitometric analysis. Values were corrected and normalized with respect to the corresponding control value. Data are of at least 3 experiments. ****, P<0.0001; (B) Relative mRNA expression levels of EIF3L, RPS15A, FKBP9, EIF2B2, RPS6KA1 and EIF4A2 after normalization with GAPDH mRNA levels as determined by quantitative real-time polymerase chain reaction after 10 μmol/L ABA treated for10 h. *, P<0.05.
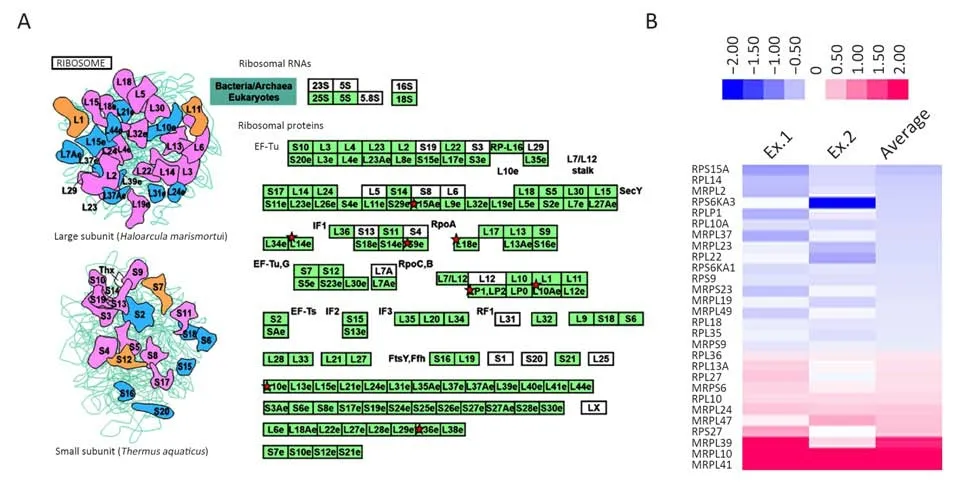
Figure 4 Disruption of ribosome biogenesis in HepG2 cells by alisol B 23-acetate (ABA). (A) DAVID analysis of ribosomal proteins contained in final selected candidates. Red pentagrams highlighted 8 genes involved in ribosomal biogenesis; (B) Light: heavy heat map of differentially expressed ribosomal proteins overlapped in both Ex.1 and Ex.2.

Table 4 Categories of final selected candidate ribosomal proteins
Discussion
ABA is a triterpenoid that is a major component isolated from the traditional Chinese medicine Alismatis rhizoma.ABA protects against non-alcoholic steatohepatitis(NASH), hepatotoxity and cholestasis. Increasing evidence shows that ABA also has anti-cancer potential. It has been reported that ABA causes cytotoxicity in cancer cells by inducing autophagy, endoplasmic reticulum stress,mitochondrial dysfunction and cell cycle arrest (26-28).ABA has the ability to protect normal liver cells, but it also has the role of inhibiting the development of liver cancer.ABA may be a potential anti-liver cancer drug. However,the exact mechanism of the drug action and the early events responsible for these effects are still unknown. In the present study, we applied a SILAC quantitative proteomic approach to identify the proteins that were altered after ABA administration in HepG2 cells. Our bioinformatics analysis based on STRING and DAVID online tools revealed that the altered proteins were divided into several categories, including mTOR/ribosome proteins, FAS/caspase-related apoptotic proteins and cell cycle-related proteins (Figure 2D; Table 1,3).

Figure 5 Inhibition of G1 arrested by alisol B 23-acetate (ABA). (A) HepG2 cells treated with ABA for 20 h at the concentration of 10 μmol/L and 15 μmol/L, the cell cycle was analyzed using flow cytometry; (B) Histogram of cell cycle changing after ABA treatment; (C)Expression dynamics of CDK4, Cyclin D1, p-Rb and Rb after ABA treatment for 20 h at the concentration of 10 μmol/L and 15 μmol/L in HepG2.
mTOR integrates a variety of extracellular signal stimuli and participates in multiple signaling pathways, affecting transcription and protein synthesis. It might be a potential target for anti-cancer therapy. In esophageal squamous cell carcinoma, over-expression of p-mTOR is independently associated with tumor prognosis. Many tumors, including small cell lung cancer cells (29), pancreatic cancer cells (30)and liver cancer cells (31), have abnormalities in this pathway. mTOR inhibitors, including the rapamycin analogues deforolimus (32), everolimus (33) and temsirolimus (34) , have been submitted to clinical trials for the treatment of various cancers. In this study, ABA treatment causes differential protein expression in the mTOR signaling pathway; differentially expressed proteins include FKBP1A and EIF4E (Table 3). ABA inhibits mTOR activation in a dose-dependent manner (Figure 3A,B), suggesting that ABA may be a naturally occurring mTOR inhibitor with anti-cancer potential.
mTOR is a master regulator of the production of RP and rRNA and has effects on ribosomal biosynthesis. There are at least three such effects. First, inhibition of mTOR globally represses the transcription of most RP-encoding genes. Transcription factors, such as SFP1 and FHL1, are directly linked to the promoter of the RP gene and inactivated at mTOR inhibition, resulting in the downregulation of RP gene expression. Second, mTOR can facilitate the translation of RP-encoding genes. mTOR phosphorylation of S6K1 promotes 5’TOP mRNA translation. Since the translation of RP-encoding mRNA is negatively controlled by its 5’TOP sequence, mTOR can elevate ribosome production and cell growth (35). Third,serum-induced rDNA transcription requires the TORactivated S6K1 (36). mTOR enhances rDNA transcription by TIF-IA and promotes the formation of RNA Pol Ipriming complexes. Rapamycin can reduce RNA Pol III activity and the activity of its specific transcription factor TF-IIIB, thereby inhibiting the transcription of the 5S rRNA gene (37). Our proteomic results showed that the RPs we quantified were down-regulated after the administration of ABA (Figure 4), suggesting that ABA might induce ribosomal dysfunction in an mTORdependent manner.
Proteomic analysis and FACS results imply that ABA could arrest HepG2 cells at the G1 cell cycle stage (Figure 5A,B; Table 1). We further confirmed that ABA greatly decreased the expression of cyclin D1 and CDK4 and the phosphorylation of Rb (Figure 5C). After rapamycin treatment, the expression levels of mTOR and cyclin D1 mRNA were down-regulated in RPMI8226 cells. In MDAMB-231 human breast cancer cells, both S6K and 4EBP1/eIF4E are involved in the retardation of rapamycininduced G1 cell cycle progression. Rapamycin treatment inhibits 4E-BP1 phosphorylation to reduce the expression of CDK4 and cyclin D1 and inhibits Rb phosphorylation to initiate G1/S phase arrest in cancer cells (38). In addition,MRPL41, encoding the mitochondrial ribosomal protein(MRP), was obviously up-regulated after ABA administration (Figure 4B). MRPL41 plays a dual role,either arresting the cancer cell cycle in the G1 phase or inducing the apoptosis of cancer cells in a P53-dependent manner (39). There are many lines of evidence reveal that MRPs are required for cell proliferation through regulating the cell cycle-dependent kinases and partner cyclins,including MRPL10 (39,40), another MRP detected by our ABA-induced proteomic results (Figure 4B). Therefore, our data indicate that the mTOR-MRP axis may be required for ABA-induced G1 cell cycle protein degradation.
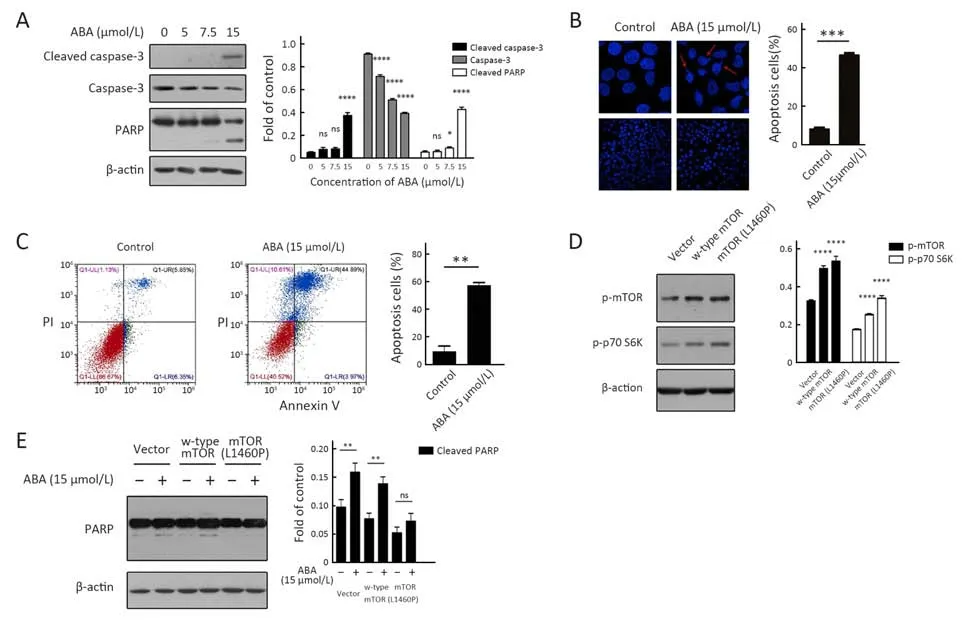
Figure 6 Alisol B 23-acetate (ABA) induces apoptosis in HepG2 cells through mTOR pathway. (A) Caspase-3 and poly-ADP-ribose polymerase (PARP) cleavage after ABA treatment for 10 h at the concentration of 5 μmol/L, 7.5 μmol/L and 15 μmol/L in HepG2 was analyzed by Western blotting; (B) After ABA administration, the cells were stained by 4’,6-diamidino-2-phenylindole (DAPI) and visualized by fluorescence microscope. Arrows show the apoptotic cell; (C) HepG2 cells treated with ABA for 10 h at the concentration of 15 μmol/L.Cells stained by Annexin V-FITC/PI assay were analyzed by flow cytometry; (D) HepG2 cells transfected with empty vector, w-type mTOR plasmid and mTOR (L1460P) plasmid were analyzed by Western blotting to evaluate phosphor-mTOR (ser2448) and phosphorp70S6K (Thr389); (E) Expression dynamics of PARP after ABA treatment for 10 h at the concentration of 15 μmol/L in HepG2 (H).Values were corrected and normalized with respect to the corresponding control value (C, D, G and H). Data are of at least 3 experiments. *, P<0.05; **, P<0.01; ***, P<0.001; ****, P<0.0001.
mTOR inhibitors may activate the apoptotic pathway.Rapamycin exerts its immunosuppressive and anti-rejection functions by regulating the expression of FasL mRNA and inhibiting the apoptosis of intestinal epithelial cells. mTOR also activates the extrinsic apoptotic pathway via the DR5/FADD/caspase-8 axis after rapid inhibition of 4EBP1 phosphorylation (12). Here, ABA induced HepG2 apoptosis (Figure 6A,B). Our proteomic data shows that the FAS signaling pathway, caspase cascade, and DR3 and DR4/5 death receptors were expressed differentially after ABA administration (Table 3). Further functional investigation indicated that mTOR (L1460P), an active mTOR mutant, increased p70 S6K phosphorylation and decreased PARP cleavage in HepG2 cells. The abovementioned observations suggest that ABA-caused apoptotic liver cancer cell death occurs through an mTOR inhibition-related pathway. However, ABA could cause cancer cell death by inducing autophagy, endoplasmic reticulum stress, mitochondrial dysfunction and cell cycle arrest. Therefore, mTOR, as an early central regulator of ABA, deserves further investigation.
Conclusions
Taken together, our proteomics results indicate that mTOR/ribosome proteins, FAS/caspase-related apoptotic proteins and cell cycle-related proteins are differentially regulated by ABA in HepG2 cells. These effects may be responsible for the cytotoxicity of ABA. In-depth data mining and functional analysis demonstrate that ABA, as a potential mTOR inhibitor, may induce the disruption of ribosomal biogenesis. It may have effects on the mTORMRP axis to arrest the cell cycle at the G1 phase. It may eventually lead to cancer cell apoptosis. These results therefore shed light on the mechanism of the anti-tumor action of ABA, especially in an mTOR-regulated manner.
Acknowledgements
This study was supported by the National Natural Science Foundation of China (No. NSFC-81502406, 81673320)and Education Scientific Research Project for young teachers, 2018 (No. JT180013).
Footnote
Conflicts of Interest: The authors have no conflicts of interest to declare.
 Chinese Journal of Cancer Research2019年2期
- Chinese Journal of Cancer Research的其它文章
- Extensive exploration of T cell heterogeneity in cancers by single cell sequencing
- Synthesis and evaluation of 64Cu-radiolabeled NOTA-cetuximab(64Cu-NOTA-C225) for immuno-PET imaging of EGFR expression
- Nomograms based on HPV load for predicting survival in cervical squamous cell carcinoma: An observational study with a longterm follow-up
- Histogram analysis of apparent diffusion coefficient predicts response to radiofrequency ablation in hepatocellular carcinoma
- Efficacy of endoscopic treatment on patients with severe dysplasia/carcinoma in situ of esophageal squamous cell carcinoma: A prospective cohort study
- Sequential therapy according to distinct disease progression patterns in advanced ALK-positive non-small-cell lung cancer after crizotinib treatment