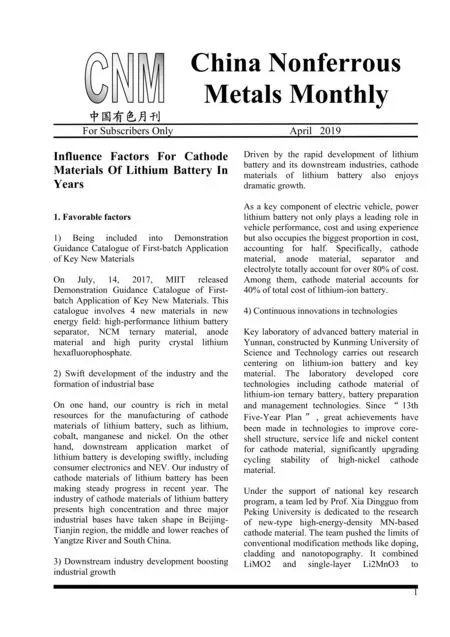
Technical and Economic Indicators of Major Enterprise

IndicatorUnitFebruary. 2019Jan.-Feb. 2019Change2018-2019 Ore Grade Copper%0.740.720.74 Lead%2.392.672.80 Zinc%5.095.245.54 Nickel%1.121.131.18 Tin%0.680.720.56 Antimony%2.092.201.74 Tungsten%0.280.270.29 Molybdenum%0.10.10.11 Concentrate Grade Copper%22.3822.0421.03 Lead%61.2360.8661.66 Zinc%50.1050.0450.01 Nickel%6.916.916.85 Tin%42.8942.8943.16 Antimony%24.9228.3629.90 Tungsten%51.6850.2751.37 Molybdenum%52.3852.6052.42 Recovery Rate of Mineral Processing Copper%86.0186.1085.87 Lead%85.0585.2786.01 Zinc%90.7691.2191 Nickel%83.9784.2684.59 Tin%71.9572.569.23 Antimony%74.7777.6686.20 Tungsten%77.7276.8677.44 Molybdenum%84.5484.7884.88 Copper Total Recovery Rate of Copper Smelting%98.5498.5398.33 Recovery Rate of Refined Copper%99.5999.6199.55 Recovery Rate of Blister%99.0199.0198.75 Direct Current Consumption of Refined CopperkWh/ton324.96324.74320.76 Current Consumption of BlisterkWh/ton712.15722.15756.06 Coal Consumption of Blisterkg/ton174.20187.49210.80 Aluminum Comprehensive AC Power Consumption of AluminumkWh/ton13524.6513510.5213563.76 Direct Current Consumption of AluminumkWh/ton12881.6612886.6112919.03

IndicatorUnitFebruary. 2019Jan.-Feb. 2019Change2018-2019 Alumina Consumption of Aluminumkg/ton1911.661911.641913.54 Total Recovery Rate of Aluminakg/ton77.9078.4579.35 Soda consumption of Aluminakg/ton157.98160.35172.43 Lead Total Recovery Rate of Lead Smelting%97.0697.0197.04 Recovery Rate of Lead Bullion%97.8797.8797.91 Coal Consumption of Lead Bullionkg/ton288.50313.39404.25 Direct Current Consumption of Refined LeadkWh/ton120.97117.51115.38 Zinc Total Recovery Rate of Refined Zinc%96.1195.6796.01 Direct Current Consumption of Refined ZinckWh/ton3078.383093.103085.34 Tin Total Recovery Rate of Tin Smelting%98.2898.1197.82 Direct Current Consumption of Tin SmeltingkWh/ton1264.461204.511910.30 Coal Consumption of Tin Smeltingkg/ton1545.451450.211577.48 Nickel Total Recovery Rate of Nickel Smelting%949493.83 Antimony Total Recovery Rate of Antimony Smelting%95.3495.9695.38 Direct Current Consumption of Antimony SmeltingkWh/ton543.48932.83494.96 Yield of Processed Material Rate of Total Copper Products%75.4076.5978.20 Copper Melting %94.7994.8995.37 Copper Processing Products%78.8280.0581.46 Rate of Total Aluminum Products%64.4564.5665.17 Aluminum Melting%88.3487.8787.06 Aluminum Processing Products%72.9473.1674.71
 China Nonferrous Metals Monthly2019年4期
- China Nonferrous Metals Monthly的其它文章
- Zinc Production by Province in 2019
- Copper Mine Production by Province or City in 2019
- Lead Production by Province or City in 2019
- Fabricated Copper Production by Province or City in 2019
- Production of the Ten Major Nonferrous Metals in 2019
- Nickel Production by Province or City in 2019
