Updating conventional soil maps by mining soil–environment relationships from individual soil polygons
CHENG Wei , ZHU A-xing , QIN Cheng-zhi , QI Feng
1 State Key Laboratory of Resources and Environmental Information System, Institute of Geographic Sciences and Natural Resources Research, Chinese Academy of Sciences, Beijing 100101, P.R.China
2 University of Chinese Academy of Sciences, Beijing 100049, P.R.China
3 Key Laboratory of Virtual Geographic Environment, Ministry of Education, Nanjing Normal University, Nanjing 210023, P.R.China
4 Jiangsu Center for Collaborative Innovation in Geographical Information Resource Development and Application, Nanjing 210023, P.R.China
5 Department of Geography, University of Wisconsin-Madison, Madison 53706, USA
6 School of Environmental and Sustainability Sciences, Kean University, Union 07083, USA
Abstract Conventional soil maps contain valuable knowledge on soil–environment relationships. Such knowledge can be extracted for use when updating conventional soil maps with improved environmental data. Existing methods take all polygons of the same map unit on a map as a whole to extract the soil–environment relationship. Such approach ignores the difference in the environmental conditions represented by individual soil polygons of the same map unit. This paper proposes a method of mining soil–environment relationships from individual soil polygons to update conventional soil maps. The proposed method consists of three major steps. Firstly, the soil–environment relationships represented by each individual polygon on a conventional soil map are extracted in the form of frequency distribution curves for the involved environmental covariates.Secondly, for each environmental covariate, these frequency distribution curves from individual polygons of the same soil map unit are synthesized to form the overall soil–environment relationship for that soil map unit across the mapped area.And lastly, the extracted soil–environment relationships are applied to updating the conventional soil map with new, improved environmental data by adopting a soil land inference model (SoLIM) framework. This study applied the proposed method to updating a conventional soil map of the Raffelson watershed in La Crosse County, Wisconsin, United States. The result from the proposed method was compared with that from the previous method of taking all polygons within the same soil map unit on a map as a whole. Evaluation results with independent soil samples showed that the proposed method exhibited better performance and produced higher accuracy.
Keywords: update conventional soil map, soil–environment relationships, knowledge extraction, individual soil polygons
1. Introduction
Information on the spatial distribution of soils is increasingly important for watershed management and ecological modeling applications (McBratneyet al.2003; Bruset al.2008). However, polygon-based conventional soil maps with crisp boundaries cannot satisfy the model requirements for more detailed and accurate soil data (Zhu and Mackay 2001; Quinnet al.2005; Liet al.2012). Previous studies have shown that conventional soil maps can be used as a source of both data and knowledge in digital soil mapping(DSM; McBratneyet al.2003), and be updated to higher accuracy (Häringet al.2012; Kerryet al.2012; Subburayalu and Slater 2013; Collardet al.2014; Heunget al.2014,2016; Subburayaluet al.2014).
One way of updating conventional soil maps involves extracting the soil–environment relationships embedded in these maps (Buiet al.1999; Moran and Bui 2002; Qi and Zhu 2003; Yanget al.2011). The extracted knowledge is then applied to updating soil maps with new and improved data on environmental factors which co-vary with the soil forming process (Jenny 1941, 1961).
Currently there are two main approaches to extracting such embedded knowledge from soil maps. One is to select training samples from conventional soil maps, and then use a machine learning algorithm (such as decision trees, classification trees, or Random Forest) to generalize the soil–environment relationships represented by these samples. The training samples are often randomly selected using different methods, such as selecting equal number of training samples for each soil map unit (Moran and Bui 2002), selecting equal number of training samples for each polygon (Subburayalu and Slater 2013; Heunget al.2014,2016; Odgerset al.2014; Subburayaluet al.2014; Holmeset al.2015), or selecting training samples according to an area-weighted proportion of each map unit extent over entire study area (Bui and Moran 2001, 2003; Moran and Bui 2002;Grinandet al.2008; Heunget al.2014, 2016; Vincentet al.2018). Randomly sampling from conventional soil maps,however, cannot avoid the inclusion of low quality samples that may result from mapping errors, such as incorrect labels,inclusions and misplacements of boundaries (Ehlschlaeger and Goodchild 1994). To guarantee the selection of high quality, representative training samples from conventional soil maps, it has been proposed to select samples only from typical areas for each map unit. The locations of typical areas of each map unit can be represented by the clustering centroids using clustering algorithms (Yanget al.2011) or the modes of frequency distribution histograms on individual environmental covariates for each map unit (Qi and Zhu 2003; Qi 2004).
The other approach to extracting the knowledge on soil–environment relationships from soil maps is through constructing frequency distribution curves of individual environmental covariates (or, environmental frequency curve) for each map unit by overlaying soil map with data layers of the soil-forming environmental covariates. This is based on a reasonable assumption that the majority of the polygon area on the conventional soil map is correctly categorized (Qi and Zhu 2003). The resulted environmental frequency curves indicate the degree that the environmental conditions are suitable for the development of the mapped soil types (Qiet al.2008; Duet al.2015). Qi and Zhu (2011)and Silvaet al.(2016) compared the above two approaches to extracting knowledge from existing soil maps and updating these maps. Extracting soil–environment relationships as individual environmental frequency curves have achieved higher accuracy than sampling the original map.
Previous studies derived environmental frequency curves from existing soil maps by taking all polygons within the same soil map unit on a map as a whole. The resulting soil–environment relationships inevitably represent bias toward larger polygons in the map unit. As the basic spatial unit of a conventional soil map, each polygon represents soil surveyors’ understanding of the local soil and its environment at that particular location. This means that each individual polygon, no matter small or large, represents some specific environmental conditions for the development of that particular soil type. Grouping the smaller polygons with larger ones within the map unit to construct environmental frequency curves leaves the smaller areas underrepresented at the low frequency ends. It introduces bias of the soil–environment relationships favoring environmental conditions represented by polygons that occupy larger areas spatially. This bias may in fluence the performance of DSM when using such extracted soil–environment relationships to update a conventional soil map.
In this paper we present a method of mining soil–environment relationships as environmental frequency curves from individual soil polygons. With a case study we used the method to update a conventional soil map of the Raffelson watershed in La Crosse County, Wisconsin,United States. The proposed method was then compared with previous method that extracts the soil–environment relationship only at the map unit level.
2. Methods
2.1. Basic idea
As in previous studies (Qi and Zhu 2003; Qi 2004)which assume that normally the majority in polygon area on the conventional soil map is correctly categorized,environmental frequency curves (Qiet al.2008; Duet al.2015) are used to represent the soil–environment relationships extracted from mapped soil polygons in this study. To obtain the final soil–environment relationships,we first calculate the frequency distribution of each environmental covariate for each individual soil polygon and construct the corresponding environmental frequency curve.Next, for each environmental covariate, these environmental frequency curves from individual soil polygons within the same map unit are synthesized through combining the categories together for a categorical environmental covariate or selecting the max frequency value associated with the same environmental covariate value for a continuous environmental covariate.
Note that a map unit on a conventional soil map sometimes contains more than one soil type (complex map units). The environmental frequency curves from individual soil polygons within same map unit but represent different soil types should not be synthesized. In such case, we introduce a parent material variable to supplement the map unit delineations. Parent material, as a categorical covariate,plays a decisive role in controlling the development of soil types. One soil type is normally developed on only one parent material, while the same parent material usually develops into different soil types. Overlaying the conventional soil map with a parent material or sometimes bedrock geology layer which is often available for the mapped area (Zhanget al. 2017), we obtain combinations of soil map unit and parent material called the map unit–parent material pairs that help break down complex map units. Environmental frequency curves are then extracted from these map unit–parent material pairs to differentiate soil types within complex map units developed on different parent material. For the parent material environmental covariate itself, environmental frequency curves will still be synthesized at the map unit level. Whereas for other environmental covariates, the environmental frequency curves from individual soil polygons will be synthesized at the level of map unit–parent material pair. The detailed steps are elaborated below.
2.2. Step 1: Extracting soil–environment relationships implied by each individual soil polygon
The soil–environment relationships implied by individual soil polygons are first extracted as environmental frequency curves. The form of these environmental frequency curves is dependent on the type of environmental covariate.
For a categorical environmental covariate, a step function with a membership value of 1 for the optimal category and 0 for other categories is used for the environmental frequency curve. The dominant category (i.e., the one with the highest area proportion) in a soil polygon is assigned membership 1 for the soil type at that location. As aforementioned, we overlay the soil map with a parent material map to first create a map unit–parent material composite map so that each polygon on this map has both a map unit and a parent material attribute.
Note that small polygons located at the border of the soil map are often incomplete polygons whose dominant part may not be included in the map. Using such incomplete polygons to extract the soil–environment relationships may introduce errors. Therefore we recommend a data preprocessing step in this study to exclude these small polygons at the map borders. For other categorical environmental covariates (such as land use or vegetation)that come in secondary in terms of their impact on soil formation, the categorical map of each covariate is then overlapped with the above-generated soil map unit–parent material composite map. The dominant category (i.e., the one with the highest area proportion) for each soil polygon on the composite map is finally identi fied to be assigned a membership of 1.
For a continuous environmental covariate (such as elevation, slope gradient), a curve is used to fit its frequency distribution within a soil polygon on the soil map unit–parent material composite map. There are parametric or non-parametric methods to fit the curve. Duet al.(2015)experimented with both methods to fit frequency distribution curves for continuous covariates and the results exhibited no significant difference when these two methods were used to predict soil type or soil property. We adopt a non-parametric method, i.e., kernel density estimation (KDE) (Gatrellet al.1996; Lawet al.2009), in this study as it does not need to assume curve shapes in advance.
The basic assumption of KDE is that a soil type associated with an optimal environmental covariate value(i.e.,xi) may occur at locations with a different environmental covariate value (i.e.,x) at a lower probability. The probability decreases as the distance betweenxiandxincreases. The following equation shows the probability density estimation with KDE:

KDE estimates the probability density associated with a particular environmental covariate valuexby summing up the density contributions from all environmental covariate values (Diggle 1985; Fotheringhamet al.2000). The derived frequency(the probability density) values are then normalized to([0,1]) using the following equation:

After normalization, each environmental covariate valuexwill correspond to a normalized frequency value. The highest normalized frequency value is 1 which means the corresponding environmental covariate value is the optimal value for the soil polygon under consideration.
2.3. Step 2: Synthesizing soil–environment relationships across polygons
Synthesizing the relationship between soil and parent material at the map unit levelTheoretically, when a soil type is found to have developed only on a certain parent material, it should not distribute outside the spatial range of this parent material. However, due to errors on conventional soil maps (such as incorrect labels, and inaccurate placements of polygon boundaries), the soil map unit–parent material composite map resulted from the last step might contain some unrealistic combinations between soil map unit and parent material. These unrealistic combinations should be excluded when synthesizing knowledge derived from each individual polygon. This is realized through selecting only the dominant parent material within each map unit.Specifically, map unit with single soil type should correspond to one parent material only. Under this assumption, we add the polygons with the same parent material together to get the area of each parent material and select the parent material with the highest area proportion as the optimal one for this map unit, the minor ones which may well be results of mapping errors are discarded. Again, a step function with a membership value of 1 for the optimal parent material and 0 for other parent materials is used for the synthesized soil–parent material relationships of the map unit.
Complex map units contain more than one soil type that could have developed on different parent materials. In this case, the area proportions of different parent material categories are calculated to re flect the dominant ones in the complex map unit (Fig. 1). During this process, a threshold(i.e.,thr1in Fig. 1) is set to judge if the inclusion of a parent material is trivial (due to map errors) or significant enough to represent an actual inclusion. An area proportion of 15%,which has been used as a threshold value in Soil Survey Manual (SSDS 2017) to determine whether a component is a minor one, was used in the case study. Sometimes however, the total area of a parent material (e.g., b+c,in Fig. 2) is small, so that its area proportion occupied in a specific map unit (e.g., b/(a+b), in Fig. 2) may not be significant but shows a large proportion of its own area(e.g., b/(b+c) in Fig. 2 is larger thanthr2in Fig. 1) , it should not be neglected and is still added to be one of the parent material categories for this map unit. In our case study, a parent material category included in the complex map unit that occupies more than half of its own area is considered to be such case (i.e.,thr2=50%).
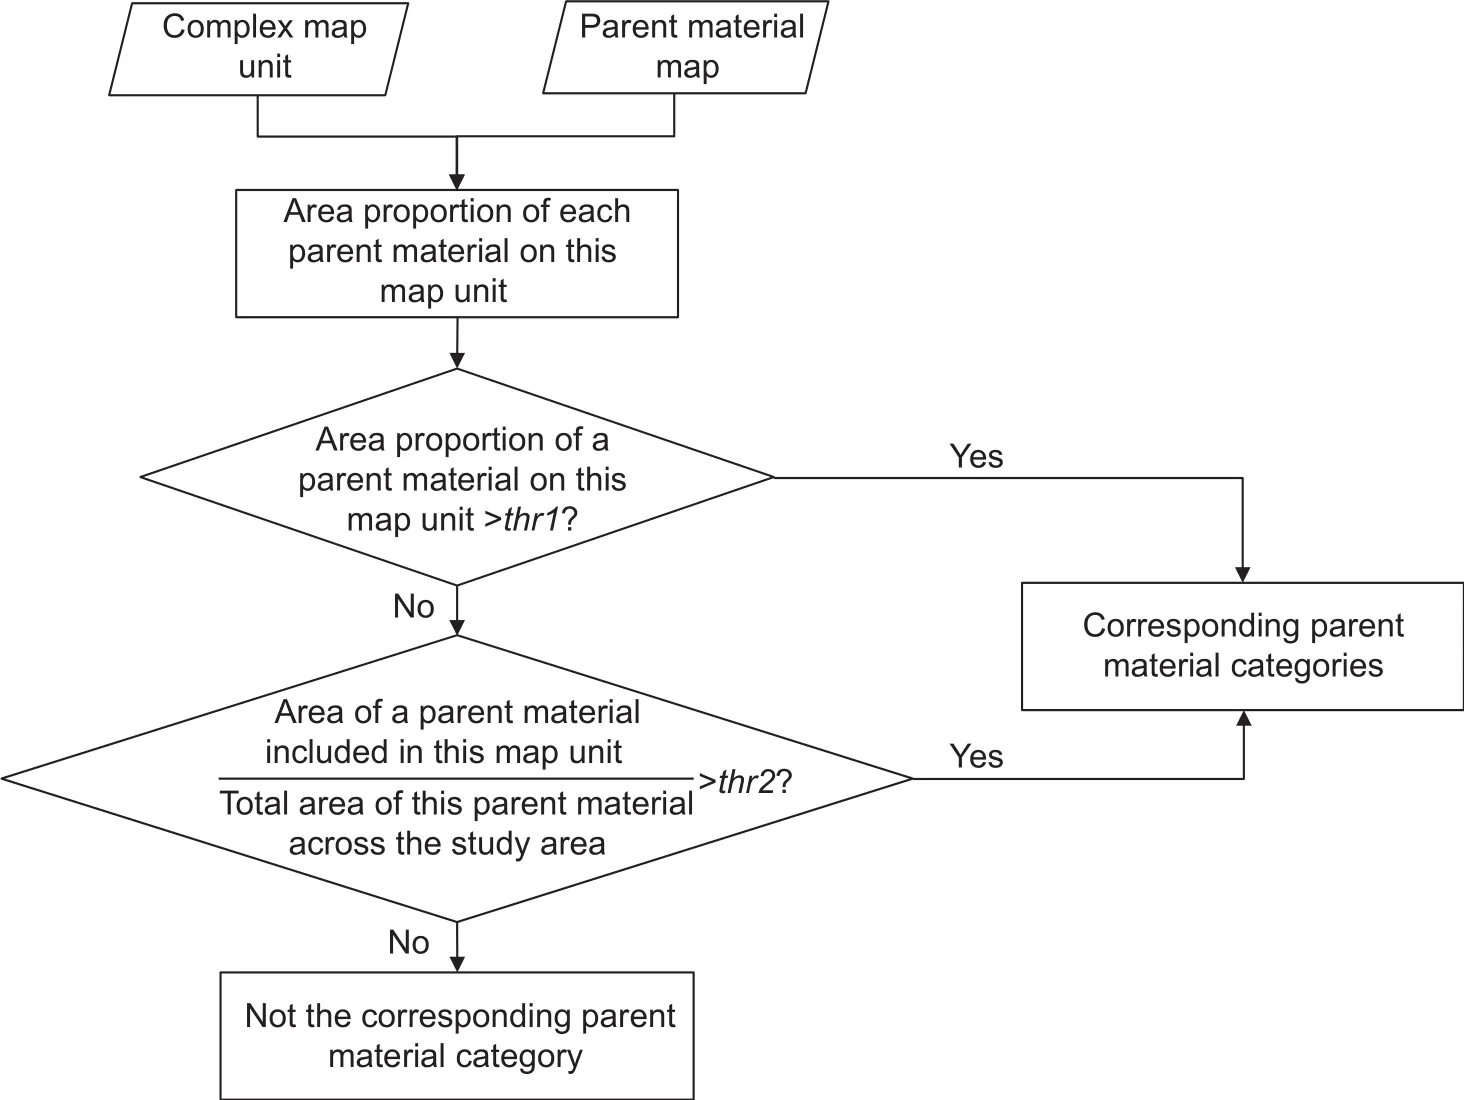
Fig. 1 Flowchart of synthesizing the corresponding parent material group for a complex map unit.
After all parent material categories are identi fied for a complex map unit a similar step function as before is then used to represent the synthesized soil–parent material relationships of this complex map unit (Fig. 3-A). This synthesized step function for the complex map unit can also be decomposed to separate step functions (Fig. 3-B and C), each for one map unit–parent material pair and can be conveniently applied to updating the conventional soil map in Step 3.
Synthesizing the relationship between soil and other environmental covariates at the level of map unit–parent material pairFor each categorical environmental covariate other than parent material, the dominant category derived from each individual polygon with the same map unit–parent material pair is combined together to constitute the category combination for each map unit–parent material pair.
For a continuous environmental covariate, a fuzzy MAX-operator is adopted to synthesize the frequency distribution curves derived from each individual soil polygon within the same map unit–parent material pair (Fig. 4):

2.4. Step 3: Updating the conventional soil map
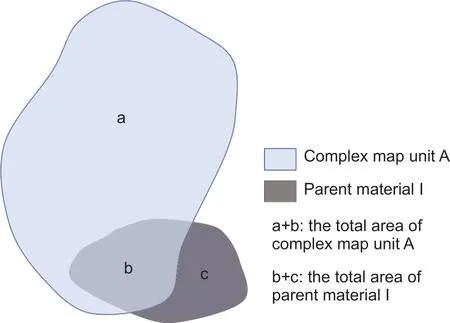
Fig. 2 Example of a complex map unit overlapped with a small parent material polygon.

Fig. 3 Example of a synthesized step function for a complex map unit and the decomposition of it to separate step functions.
After the relationships between soil and each environmental covariates are extracted and synthesized in the form of a set of environmental frequency curves, the soil land inference model (SoLIM) (Zhuet al.1997, 2001) can be adopted to update the soil map. SoLIM is a DSM model based on the similarity of environmental conditions. It combines the knowledge on soil–environment relationships with detailed environmental data layers to infer the spatial distribution of soils (Zhuet al.1996, 2001; Zhu 1997, 1999). Under the SoLIM framework, those synthesized environmental frequency curves on soil map unit–parent material pairs are used as fuzzy membership functions to compute the corresponding similarity values between each cell in the mapping area and each map unit–parent material pair. This process produces a set of fuzzy membership maps, with each of them shows the spatial variation of membership to a certain map unit–parent material pair across the area. A crisp map of soil map units could also be created by hardening the set of fuzzy membership maps, which is achieved by assigning each location the soil map unit bearing the highest membership value at that location(Zhu 1997).
3. Case study
3.1. Study area and data
Our study site is the Raffelson watershed in La Crosse County, Wisconsin, United States. It covers a small area of approximately 4 km2, and the elevation ranges from 250 to 420 m (Fig. 5). The study area is in the so-called “driftless area” of southwestern Wisconsin, which has remained free of direct impact from late Pleistocene era continental glaciers. As a result, it has a typical ridge and valley terrain with relatively flat, narrow ridges and wide valley. The slope gradient in the study area ranges from 0 to 60% and slopes with gradients below 20% accounts for about 50%of the area. The land use in the ridges and valley region is primarily cultured land while the side slopes is predominantly covered by forests.

Fig. 4 An example of the synthetization of continuous environmental frequency curves.
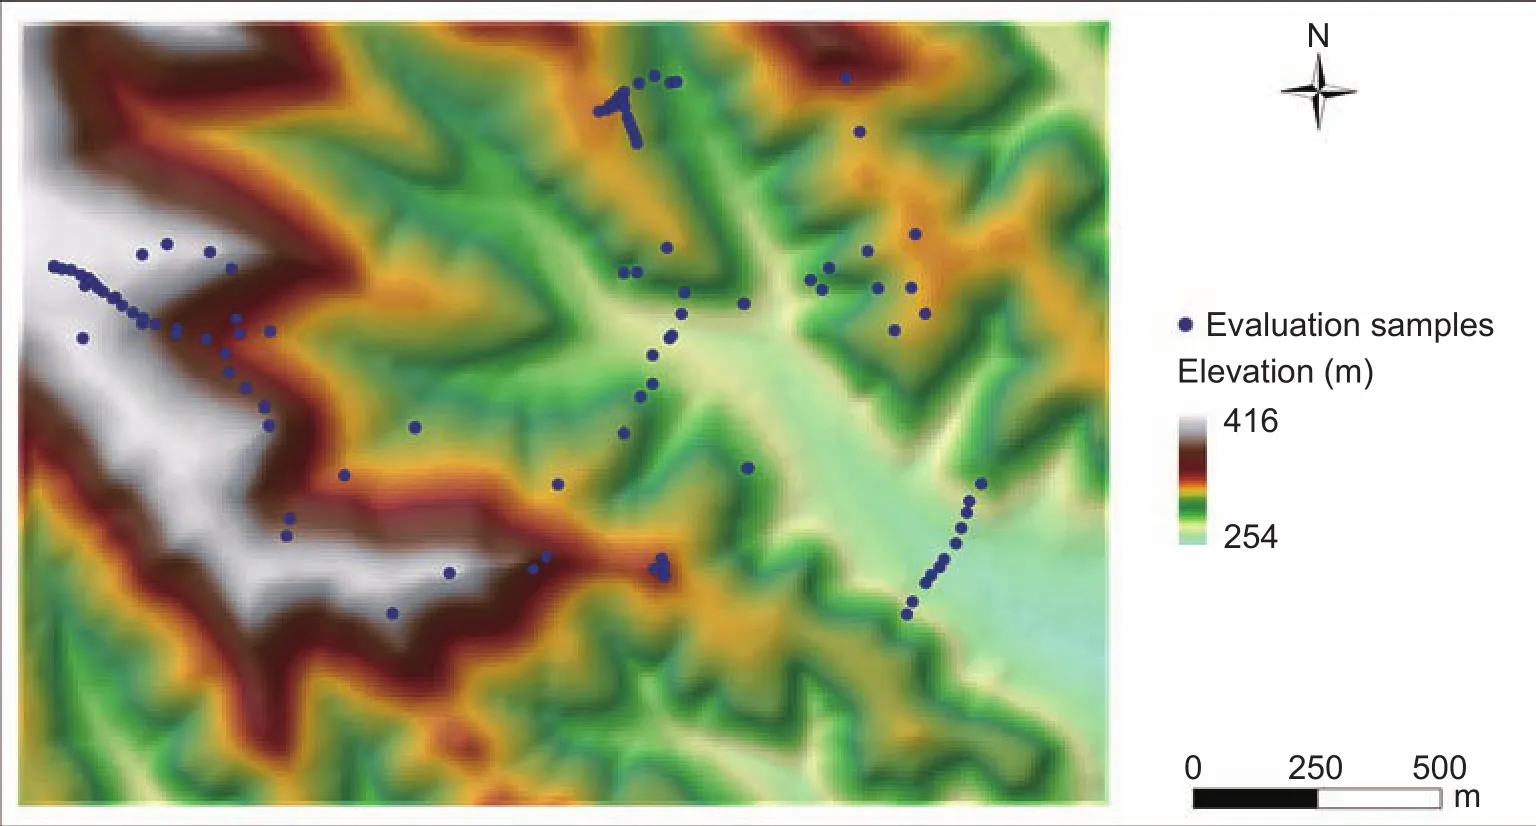
Fig. 5 Map of the Raffelson watershed in La Crosse County, Wisconsin, United States.
The conventional soil map at 1:12 000 scale of the study area (Fig. 6) was obtained from the Soil Survey Geographic database (SSURGO) created by the Natural Resources Conservation Service, United States Department of Agriculture. The map includes 12 map units, which are Valton (Val), Lamoile (Lam), Churchtown (Chu), Norden(Nor), Greenridge (Gre), Council (Cou), Kickapoo (Kic),Orion (Ori), Hixton (Hix), Dorerton-Elbaville (Dor-Elb),Gaphill-Rockbluff (Gap-Roc), and Council-Elevasil-Norden(Cou-Ela-Nor). Fig. 6 shows a rasterized format of this soil map to be used in the case study. It shows that some map units (i.e., Dor-Elb, Gap-Roc, and Cou-Ela-Nor) are complex map units. Five of the 12 map units (i.e., Chu, Nor, Cou,Dor-Elb, and Cou-Ela-Nor) cover 79% of the study area.
The environmental covariates used for knowledge extraction and soil map updating were selected based on the relevant soil forming factors in the study area. In this study area, only one categorical environmental covariate was considered: parent material. According to the soil survey report, bedrock geology in this area is complex and plays an important role in the soil formation. We thus used a bedrock geology map (Fig. 7) to depict the parent material conditions. Fig. 7 shows five distinct types of parent materials within the study area: Oneota (dolomite),Glauconite (sandstone), Jordan (sandstone), Wonewoc(sandstone), and alluvial materials (Alluvial for short).Among them, Oneota, Glauconite, and Alluvial occupy 94.6% of the total area, while the remaining two (i.e., Jordan and Wonewoc) only take up 2.0 and 3.4%, respectively.Land use and vegetation were not chosen in this case study,because they are disturbed seriously by human activities(Zhu 2008) and the relationships between them and soil are not clear in this area.
Topography is a primary factor that determines the soil variation in the study area. This is con firmed by the SSURGO soil map which shows clear correlation between soil and terrain conditions. In the case study, elevation, slope gradient,and topographic wetness index were chosen to characterize topography and were derived from a DEM of 10-m resolution produced by the United States Geological Survey (Qinet al.2011). Aspect was not chosen because soil polygons on the conventional soil map (Fig. 6) almost wrap around slopes with all aspects, which means that aspect has no significant indication for soil changes in the case study area.
In the study area, a total of 99 field samples (Fig. 5) were collected as the independent evaluation set. Among them,53 samples were collected along a few transects to cover different landscape positions and soil types in the study area. The remaining 46 samples were scattered to cover the major landscape units (such as ridge tops, side slopes,and valley bottoms) throughout the watershed. Sixteen soil types were identi fied from these samples. Fourteen of them were shown on the conventional soil map and the other two(containing seven samples) were not.
3.2. Knowledge extraction
Small polygons located at the border of the soil map were excluded first during preprocessing as mentioned in Section 2.2. These polygons accounts for 2.1% of the total area. After that the relationships between soil and parent material were extracted as detailed in Section 2.3.
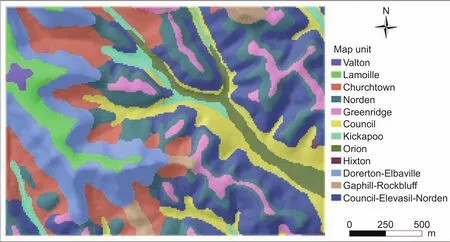
Fig. 6 Rasterized conventional soil map of the Raffelson watershed in La Crosse County, Wisconsin, United States.
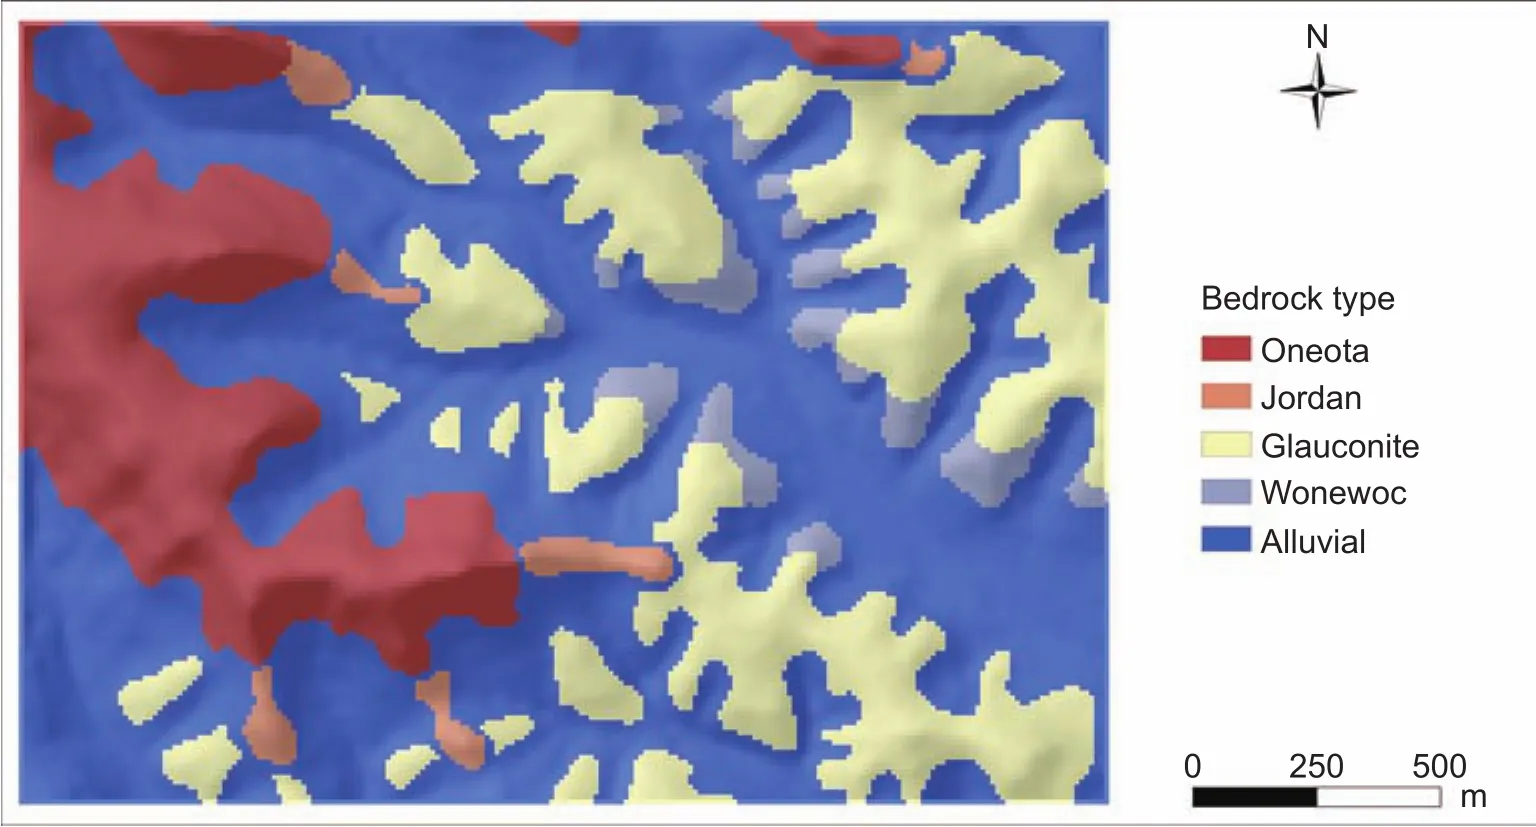
Fig. 7 Bedrock geology map of the Raffelson watershed in La Crosse County, Wisconsin, United States.
Specifically, Dor-Elb is a complex map unit that contains two soil types, Dorerton and Elbaville. The area proportions of two dominant parent material Oneota and Alluvial in this map unit are 67 and 28%, respectively. The corresponding parent material categories were determined to be Oneota and Alluvial. Gap-Roc is a complex map unit that contains two soil types, Gaphill and Rockbluff. Three dominant parent materials (i.e., Oneota, Jordan, and Alluvial) were found in this map unit, with area proportions of 24, 24, and 49%,respectively. All three were determined as parent material categories for Gap-Roc. Cou-Ela-Nor is also a complex map unit that contains three soil types, Council, Elevasil,and Norden. Two parent materials Glauconite and Alluvial cover 33.2 and 54% of the map unit, respectively. A third parent material, Wonewoc, covers only 11% of this map unit, but the area included in this map unit accounts for 74% of all Wonewoc in the study area. It thus should not be neglected. All three were identi fied to be corresponding parent material categories for this map unit.
Next, the step functions of the relationships between map units and their corresponding parent materials were constructed as described in Section 2.3. And the decomposed step function between a complex map unit and each of its corresponding parent material was also constructed. The result is 17 pairs of map unit–parent material (i.e., step functions) (Table 1; Fig. 8). The area covered by these 17 pairs of map unit–parent material accounts for 88.9% of the total area. The rest area contains either border polygons or combinations between soils and parent materials that are not typical for the soils and thus considered to be unreasonable and excluded from the steps below.
For each continuous environmental covariate, the frequency distribution curves implied by individual soilpolygons were constructed by the proposed method detailed in Section 2.2 and then synthesized for the map unit–parent material pair as described in Section 2.3. With the 17 pairs of identi fied map unit–parent material and the 4 selected environmental covariates, a total of 68 environmental frequency curves were constructed. These environmental frequency curves, which represent knowledge of soil–environment relationships embedded in the conventional soil map, were input to SoLIM to update the soil map with the newly obtained environmental data layers.
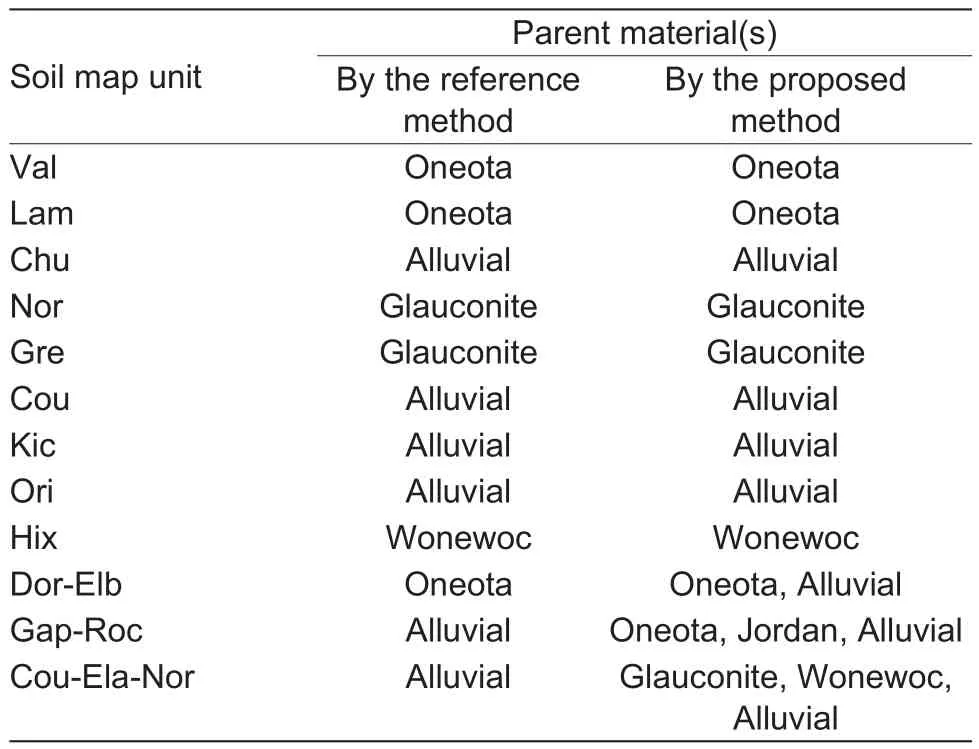
Table 1 Parent material(s) corresponding to each map unit,extracted by the proposed method and the reference method which extract soil–environment relationships only at map unit level
3.3. Evaluation
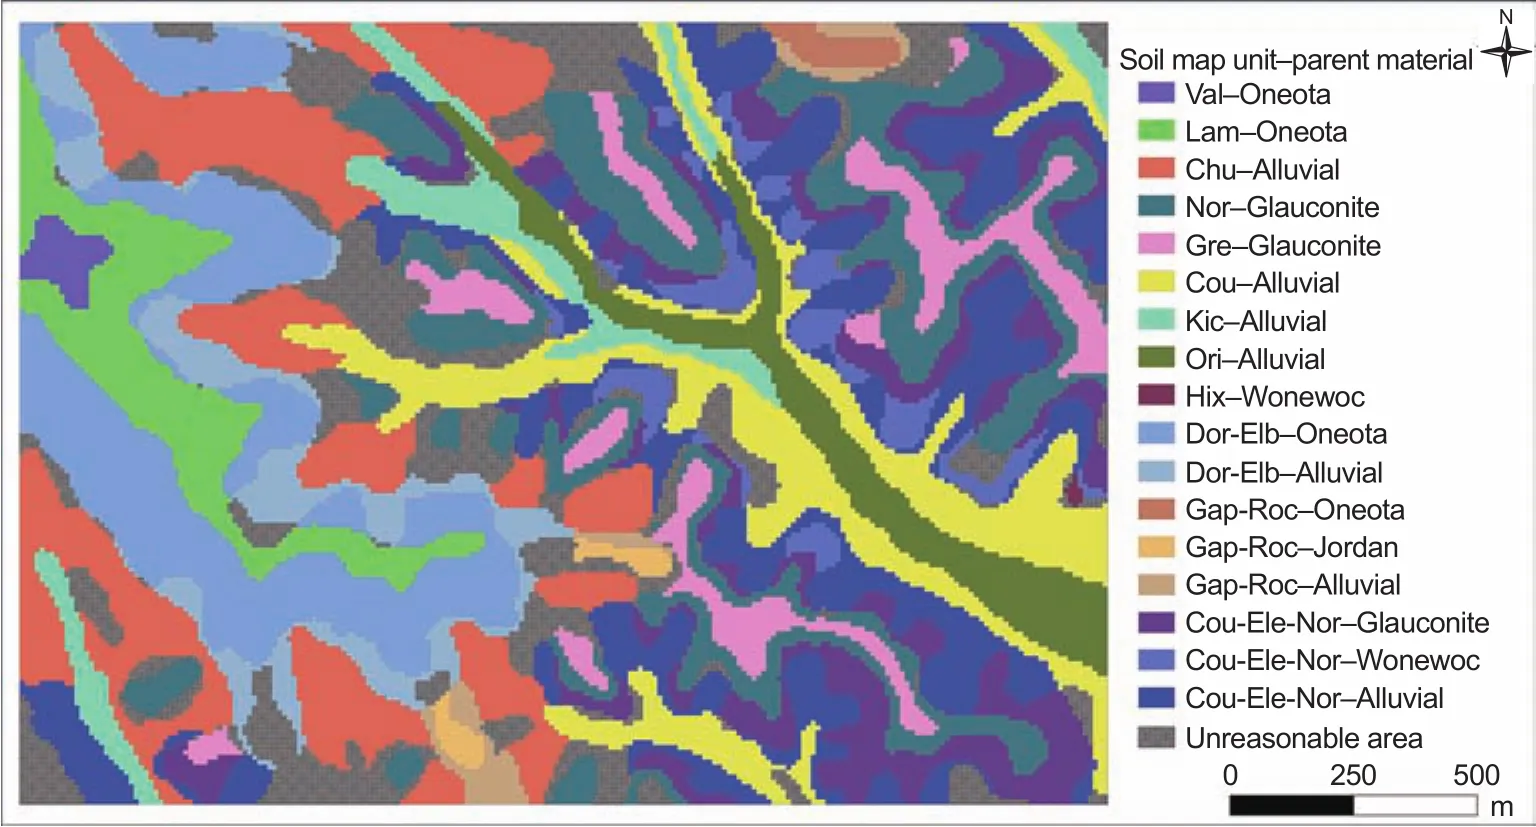
Fig. 8 Distribution of 17 pairs of map unit–parent material of the Raffelson watershed in La Crosse County, Wisconsin, United States.
The proposed method was compared to the previous method that extracts soil–environment relationship without differentiating individual polygons (called the reference method) for evaluation. To be consistent, the reference method was applied to extract environmental frequency curves for each map unit–parent material pair as well instead of just map unit.
Note that when the reference method was applied to extracting the relationship between soil and parent material in the study area, there was no soil map unit corresponding to Jordan due to its small area in this study area (Table 1).For the sake of completeness, the environmental frequency curve between soil and parent material derived with the proposed method was also used for the reference method in our comparison. With the 17 map unit–parent material pairs and 4 environmental covariates, a total of 68 environmental frequency curves were constructed with the reference method and were input to SoLIM to update the conventional soil map.
The soil map updated with the proposed method was compared to that with the reference method in two aspects.First, the difference in spatial patterns was analyzed to evaluate whether the proposed method was able to capture the detailed spatial change of soils across the study area better than the reference method. Second, the 99 independent samples (Fig. 5) were used to evaluate map accuracies. When a sample located in a complex map unit matches any of the soil types in this complex map unit, it is considered to be correctly mapped.
Under the assumption of independent classification errors, the number of correctly classi fied samples should satisfy a binomial distribution. When comparing the two methods, a null hypothesis can be that the accuracy of the soil map updated with the proposed method is not higher than that of the reference soil map. When the number of correctly classi fied samples follows the binomial distributionB(n,p),where,pis the proportion of correctly classi fied samples from the reference soil map andnis the total number of samples. The probability,P, withkcorrectly classi fied samples is calculated using the following formula:

The probability of havingkor more correctly classi fied samples is calculated using the following equation:

IfP(X≥k) is smaller than 0.05 (or 0.01), the null hypothesis should be rejected and the accuracy improvement is statistically significant at the 0.05 (or 0.01) level. Otherwise,the accuracy improvement is not significant at this statistical significance level.
3.4. Evaluation results
The soil maps updated with the proposed method and the reference method are shown in Fig. 9. The spatial patterns of map units on the two maps are consistence in general. The main differences are found in the border areas of map units.For map units with very few polygons on the conventional soil map (such as Valton and Lamoille), there is little difference between results from the proposed method and the reference method. This is natural because the environmental frequency curves for map unit–parent material pair with only one polygon are the same with the proposed method and the reference method. For those map units with multiple polygons on the conventional soil map (such as Greenridge, Kickapoo,Norden), the results from the two methods are notable. The proposed method produced more, smaller patches for these map units than the reference method did as it captured more detailed environmental conditions for local soil distribution from individual soil polygons.
Table 2 shows that the accuracy of the soil map updated with the proposed method is higher than that with the reference method, based on the 99 evaluation samples.This is an indicator that the soil–environment relationships extracted from the proposed method could capture the relationship between soil and its environmental conditions better than the reference method. However, the statistical test results (P-value) of the accuracy improvement from the conventional map to the map updated with the proposed method and that from the map updated with the reference method to the map updated with the proposed method are 0.054 and 0.117, respectively and are both not statistically significant at the 0.05 level (Table 3). In order to further improve the proposed method, we need to look into the implementation of the method for possible modifications.
4. Discussion
4.1. Comparing the environmental frequency curves extracted with the proposed and the reference methods
The number of samples correctly classi fied with the proposed method is six more than that with the reference method (Table 2). Most of the accuracy improvement occurred in the Churchtown map unit, which contains only one soil type and accounts for 13.9% of the total study area.Here, the Churchtown map unit was taken as an example to discuss the performance of the proposed method in more detail.

Fig. 9 Soil maps updated with the reference method (A) and the proposed method (B).

Table 2 Number of samples for each soil type correctly classi fied in the conventional soil map and in soil maps updated with the reference method, the proposed method, and the proposed method with two possible modifications
Churchtown was developed on the Alluvial parent material, and 10 out of the 99 evaluation samples were identi fied as this soil type (Table 2). Five and nine samples were correctly classi fied by the soil maps updated with the reference method and with the proposed method,respectively. Fig. 10 shows that the environmental frequency curve for elevation of the Churchtown–Alluvial pair extracted with the reference method has a much narrower peak value region. This curve thus represents a more centralized distribution for the elevation environmental covariate. This shows that the reference method tends to ignore or underestimate the variance among individual polygons within the same map unit–parent material pair,which is also the case with other environmental covariates.On the other hand, the peak region of the environmental frequency curve extracted by the proposed method is much broader (Fig. 10), which resembles the empirical knowledge obtained from the local soil expert (the green dotted curve in Fig. 10; Zhu 2008) and the distribution of actual elevation values of the evaluation samples recognized as this soil type.
4.2. Possible modifications to the proposed method to further improve performance
The proposed method is able to extract environmental frequency curves that have wider peak regions to re flect the distribution of soils in the feature space defined by the environmental covariates, but the so-extracted knowledge is still limited to the local situation. The optimal environmental condition for the development of a certain soil type may not be completely represented by the mapped polygons and the distribution of the optimal environmental covariate value range for the soil distribution could be even wider(Qi and Zhu 2011; also see the dotted curve of expert knowledge obtained from the local soil expert as shown in Fig. 10). Inference with a narrow environmental frequency curve could result in low membership values for large area of the soil type (also map unit) and hence possibly a restrained spatial extent for the soil type (Qi and Zhu 2011).In this section we discuss two possible modifications to the proposed method for continuous environmental covariates to address the limitation mentioned above.
4.3. The two possible modifications to the proposed method
The first possible modification is to simply extend the optimal value range of environmental covariates to make sure that the value ranges of these environmental covariates for each parent material are completely covered. Specifically, for a continuous environmental covariate, the environmental frequency curves extracted within the same parent material are first aligned along the environmental covariate axis, as shown in Fig. 11-A. It is shown that within the value range,there exist blank area and low frequency regions at both ends. This is unreasonable as besides the three curves showed on the figure, no other soil type developed on this parent material. Therefore the curves located on both endsof the value range should have optimal membership to complete the feature space. Thus we modify the leftmost and rightmost curves to be Z-shaped or S-shaped (Zhuet al.2010), respectively (Fig. 11-B). To avoid the possible situation that when both sides of a curve are modi fied it might cover other curves unintentionally, the immediate adjacent curve will be modi fied on one side instead. Furthermore, if there is only one map unit corresponding to a certain parent material, this map unit should have the optimal membership to each environmental covariate’s entire value range of that parent material. This means the original curve is modi fied into a straight line.

Table 3 P-values of the accuracy improvement of the soil map updated with the proposed method and with two possible modifications of the proposed method compared with the conventional soil map and the soil map updated with the reference method
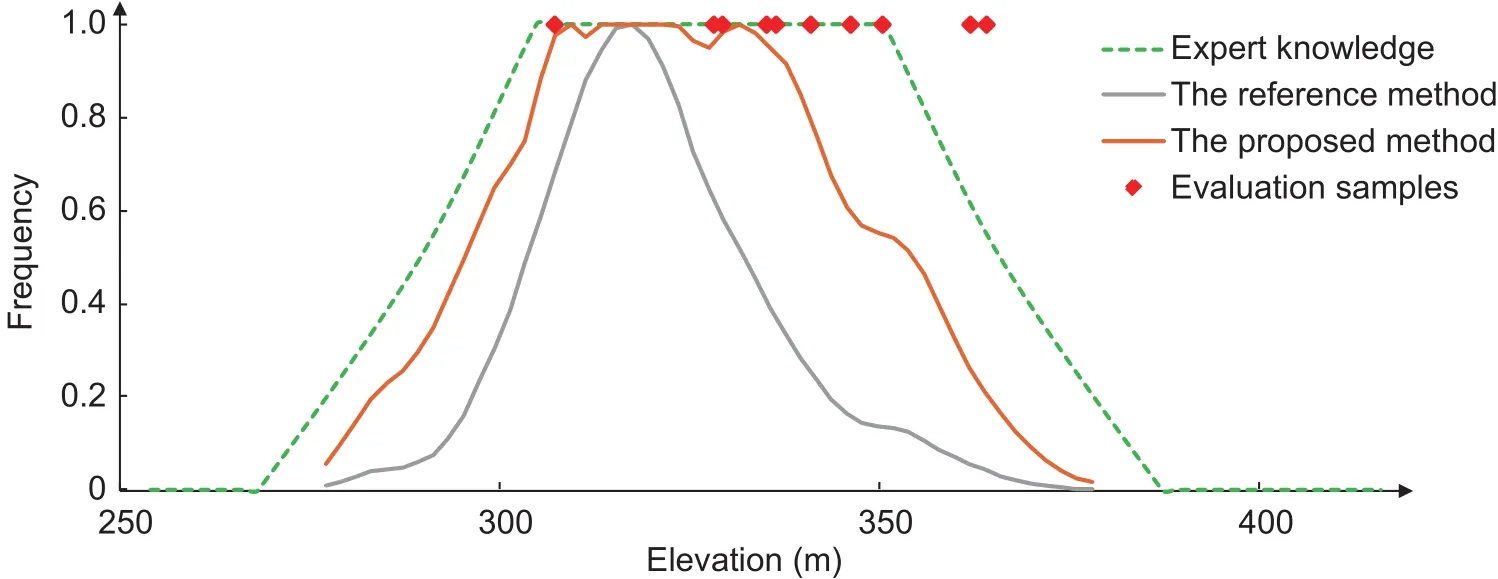
Fig. 10 Environmental frequency curves for elevation of the Churchtown–Alluvial pair extracted with the proposed and the reference methods. The dotted curve of expert knowledge is obtained from the local soil expert according to Zhu (2008), elevations for the 10 evaluation samples recognized as this soil type are also shown.
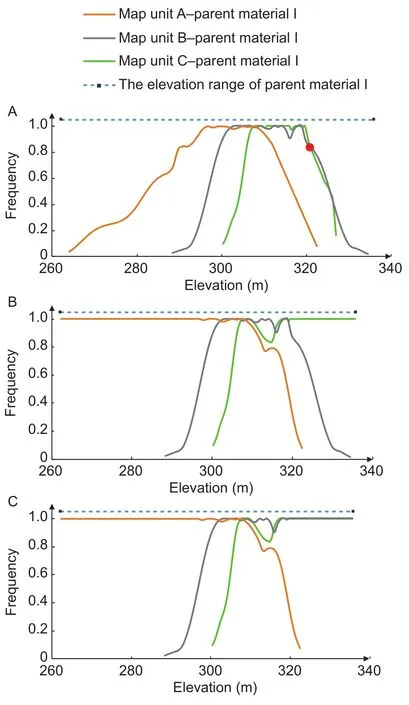
Fig. 11 Examples of possible modifications on extracting the environmental frequency curves. A, the environmental frequency curves of elevation for three pairs of soil map unit–parent material developed on the same parent material extracted with the proposed method. B, the first possible modification. C, the second possible modification.
The second possible modification is a slight variant from the first and is used when more than one curve is located very close to either end of the axis, such as the gray and green curves on the right end as illustrated in Fig. 11-A. In this case, these curves with adjacent peaks are supposed to have the same possibilities to get the optimal membership associated with those environmental covariate values.So these curves are grouped together and modi fied to be Z-shaped or S-shaped in a similar way as above. An example is shown in Fig. 11-C. More specifically, for the rightmost curve, if another curve intersects with its right downslope side and the frequency value at the intersection point is not smaller than 0.5 (see the red point in Fig. 11-A), the intersecting curve is modi fied together. The same applies to the leftmost curve.
4.4. lmprovement with the two modifications
We experimented with the two modifications following extraction of environmental frequency curves using the proposed method. Table 2 shows that the accuracy of the updated map was improved by these two modifications,with the second modification improved the proposed method more. As shown in Table 3, compared to the conventional soil map, the accuracy improvements from the proposed method with the first modification and the second modification are statistically significant at the 0.05 and 0.01 level respectively. Compared to the soil map updated with the reference method, the accuracy improvements from the proposed method with the second modification is also statistically significant at the 0.05 level.
The number of samples correctly classi fied with the proposed method plus the first modification is two more than that with the proposed method alone (Table 2). The most accuracy improvement is from the Gaphill-Rockbluff complex map unit. One of the two samples was recognized as Rockbluff and the other Gaphill in the field. Both were inferred as “NoData” on the soil map updated with the proposed method without any further modification. This is because those environmental frequency curves cannot cover the environmental covariate value range of its parent material. For those locations with uncovered environmental covariate values, the membership values to any map unit–parent material pair are 0. Thus SoLIM set “NoData” for these locations on the soil map. With the first modification,these two samples were correctly mapped to the Gaphill-Rockbluff map unit.
The second modification further improved accuracy by classifying two more samples correctly (Table 2). The two samples are found to be of the Norden map unit. This map unit accounts for 16.4% of the total study area on the conventional soil map and is mostly developed on the Glauconite parent material. A total of 14 evaluation samples were identi fied as this soil type. The two modifications to the proposed method correctly classi fied 11 and 13 of these samples respectively.
The dotted curve on Fig. 12 shows the responsible environmental frequency curve for the elevation covariate of the Norden–Glauconite pair. It also shows that the curve shape stayed unchanged with the first modification (see the gray curve in Fig. 11-B) and modi fied to S-shaped with the second modification (Fig. 11-C). The second modification made the curve cover the distribution of actual elevation values of the evaluation samples (Fig. 12), which indicates its effectiveness.
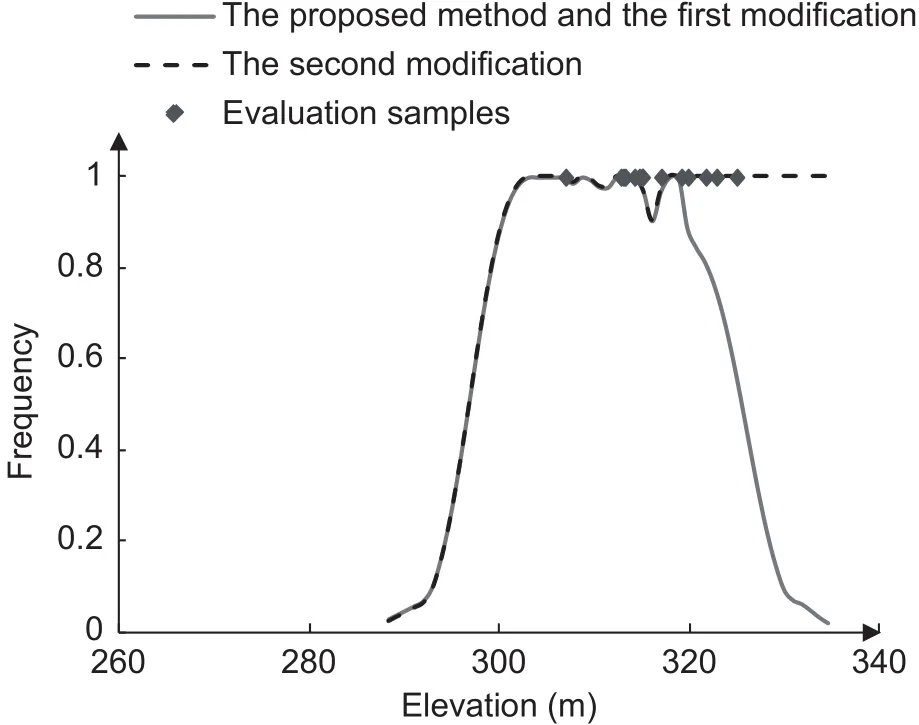
Fig. 12 Environmental frequency curves for elevation of the Norden–Glauconite pair extracted with the proposed method and two possible modifications to the proposed method(elevations for the 14 evaluation samples recognized as this soil type is also shown).
5. Conclusion
This paper proposes a method of mining soil–environment relationships as environmental frequency curves from individual soil polygons to update conventional soil maps.Compared with previous method which takes all polygons within the same soil map unit on a map as a whole during knowledge extraction, the proposed method performed better in our case study. The environmental frequency curves extracted by the proposed method approximates the expert knowledge better and can produce a more accurate soil map when used to update the conventional soil map with detailed environmental data layers. Modifications to the proposed method also showed that the performances could be further improved.
It’s worth noting that the proposed method does not disaggregate a complex map unit which contains more than one soil type. In our future work, for a complex map unit, we could try to disaggregate the synthesized soil–environment relationships into individual soil type components.
Acknowledgements
This study is supported by the National Natural Science Foundation of China (41431177 and 41422109) and the Innovation Project of State Key Laboratory of Resources and Environmental Information System of China (O88RA20CYA),and the Outstanding Innovation Team in Colleges and Universities in Jiangsu Province, China. Supports to A-Xing Zhu through the Vilas Associate Award, the Hammel Faculty Fellow Award, the Manasse Chair Professorship from the University of Wisconsin-Madison are greatly appreciated.
 Journal of Integrative Agriculture2019年2期
- Journal of Integrative Agriculture的其它文章
- Modelling and mapping soil erosion potential in China
- Spatial variability of soil total nitrogen, phosphorus and potassium in Renshou County of Sichuan Basin, China
- Spatial variability of soil bulk density and its controlling factors in an agricultural intensive area of Chengdu Plain, Southwest China
- An integrated method of selecting environmental covariates for predictive soil depth mapping
- Remotely sensed estimation and mapping of soil moisture by eliminating the effect of vegetation cover
- Automatic extraction and structuration of soil–environment relationship information from soil survey reports
