Potential tradeoffs between intraspecific and interspecific trait variations along an environmental gradient in a subtropical forest
Zhiming Zhang•Shixiao Yu
Abstract There has been growing attention to intraspecific variation in trait-based plant ecology.However,studies on these changes across ontogenetic stages and the potential trade-offs with interspecific traits along environmental gradients are rare.In this study,we measured six wood and bark traits of 1030 trees of six species(Castanopsis nigrescens;C.carlesii;Lithocarpus polystachyus;L.synbalanos;Ormosia glaberrima;O.pachycarpa)from a 10-ha plot in a subtropical forest.Mean intraspecific variation in bark thickness and bark percentage to DBH was more than twice that for wood density and bark density.Bark thickness and bark percentage showed a consistent trend with increasing tree size.Small-tree traits were more variable than the same traits in larger trees.Altitude,convexity and soil nutrients explained the majority of the variations in the six traits,while sibling species had similar relationships between traits and environmental variables.Trees with dense wood and thin bark were usually found on steep slopes at lower altitudes.Our findings show intraspecific trait variability has different spatial patterns compared with interspecific variabilities along an environmental gradient.
Keywords Environmental heterogeneity·Tradeoffs·Intraspecific and interspecific variations·Wood/bark traits·Subtropical forest
Introduction
The topic of functional traits has attracted extensive interest in plant community ecology due to the potential to improve understanding and predict community assembly and species coexistence(Ackerly and Cornwell 2007;Kraft et al.2008,2015;Kichenin et al.2013;McGill et al.2006).However,most studies have characterized species by their average trait values,relying on the assumption that intraspecific trait variabilities(competition between individuals of the same species)could be neglected relative to interspeci fic variabilities(competition between different species).Other studies have challenged this assumption,highlighting that plant traits also vary among individuals within species,depending on genetic,developmental and environmental factors(Albert et al.2011).The ability of one species to adapt to the environment,(i.e.,niche breadth),and compete with other species,(i.e.,competitive capacity),is likely to be underestimated if only mean trait values on a species level is used and intraspecific variation is ignored(Courbaud et al.2012;Laughlin et al.2012;Lepšet al.2011).Not only can trait values among species vary in response to the environment via phenotypic plasticity(Ashton et al.2010),but intraspeci fic variability can also display different idiosyncratic responses(Albert et al.2011).Therefore,intraspecific trait variation and understanding how it is structured may be more important for species coexistence strategies and community assemblies than previously thought(Albert et al.2012;Kichenin et al.2013;Violle et al.2012).
Intraspecific trait variability is species-and trait-dependent,i.e.,species respond differently to environmental constraints through two mechanisms:phenotypic plasticity,and adaptation(Albert et al.2011;Courbaud et al.2012;Kraft et al.2008,2015;Laughlin et al.2012;Lepšet al.2011;Andrade et al.2014).Individuals are sorted along environmental gradients because environmental filtering tends to increase functional similarity and influence fitness and performance(Albert et al.2011;Laughlin et al.2012).Because of hereditary influences,some gene imprinting may be found in the functional traits variability(Kraft et al.2008,2015;Laughlin et al.2012;Lepšet al.2011).Thus,the trait variability within species or amongst sibling species(species of the same genus)should be similar.Nevertheless,if influence from environmental factors were more important,the role of environmental filtering(plant phenotypic plasticity)would break gene imprinting.This would produce another kind of result:trait variation within species would be higher than among species.
Intraspecific variation can lead to incomparable results.For example,to discuss evidence for tradeoffs,functional coordination,and environment producing bark diversity,Rosell et al.(2014)sampled the base of 1-m long branches from 90 species(including trees and shrubs).Messier et al.(2010)sampled individuals with DBH<10 cm and their results were inconsistent.Therefore,ontogenetic(tree size)influence to intraspecific variation cannot be ignored(Messier et al.2010;Rosell et al.2014;Richardson et al.2013).How do functional traits vary along developmental stages or tree size classes?Do small trees with a small mean trait values have large variations,or are there other possibilities?
Intraspecific trait variation has significant effects on various community and ecosystem processes(Albert et al.2011;Laughlin et al.2012).However,research on the relationships between intraspecific trait variation and environmental factors has been rarely reported,especially the quantitative relationship between interspecific and intraspecific trait variations.These two competing hypotheses are examined in this study by sampling 1030 individual trees of four size classes from six species(three pairs of sibling species),in a 10-ha permanent plot in a subtropical forest in southern China.Six wood and bark traits were measured and interspecific and intraspecific trait variations quantified and covariation compared amongst the six traits.We tested the following:(1)whether intraspecific trait variation is smaller than interspecific variation;(2)whether intraspecific traits vary with developmental stages or with tree size classes;(3)whether the relationships between different traits and environmental factors are intraspecifically consistent.Our study will provide empirical evidence for either the phenotypic plasticity or the hereditary hypothesis for this region.
Materials and methods
Study area
The study was conducted in a subtropical,evergreen,broad-leaved forest at the Heishiding Nature Reserve(111°49′09′–111°55′01′E, 23°25′15′–23°30′02′N),Guangdong Province,China.It is a typical old-growth forest with high tree species diversity.The Reserve is approximately 4200 ha with the Tropic of Cancer passing through it;its altitude ranges from 150 to 927 m a.s.l.with the altitude of the sample plot at 464–635 m a.s.l.It has a subtropical,moist monsoon climate with a mean annual temperature and mean annual rainfalls of 19.6°C and 1744 mm,respectively.There is a pronounced dry season(October–March)and a humid season(April–September)(Liu et al.2012a,2015;Liang et al.2015).Dominant tree species in this region are mainly from the Fagaceae and Lauraceae families.
Materials
The sample plot covers an area of 10.0 ha(200 m×500 m).All standing trees with diameters of at least 1.0 cm at breast height(DBH,1.3 m above the ground)were recorded,identified and tagged.Considering the effect of genetic distance and environmental heterogeneity on trait variation,we sampled three pairs of sibling species,representing two families and three genera:Castanopsis nigrescens Chun and C.C.Huang(CN)and Castanopsiscarlesii(Hamsl.)Hayata(CC);Lithocarpus polystachyus Rehd.(LP)and Lithocarpus synbalanos(Hance)Chun(LS);and Ormosia glaberrima(Y.C.Wu)Yakovlev(OG)and Ormosia pachycarpa Champ.Ex Benth.(OP).These were approximately 12.1%of the total individuals(DBH≥10 cm)in the 10-ha plot.Each species was represented by at least 60 individuals and the DBH of the largest was 35.0 cm.
Field sampling and trait measurements
Trees with DBH≥10 cm were measured for a total of 1030 standing trees(Table 1).Using an increment borer,a core was extracted from each tree,including bark,wood,and pith,at 1.3 m above ground on the upslope side of the tree(King et al.2006).The wood and the bark were stored separately and taken to the laboratory for processing.

Table 1 Structural stand characteristics for the six studied species
Six traits were measured including wood density(WD,g cm-3),wood moisture content(WMC,%),bark percentage(BP,%),bark thickness(BT,mm),bark density(BD,g cm-3)and bark moisture content(BMC,%).Fresh weight was measured using a microbalance to 0.001 g accuracy,and green volumes of the wood cores and bark samples measured by the water displacement method within 24 h.The wood cores and bark samples were dried for 72 h in a well-ventilated oven at 80°C until a constant mass was achieved(Pérez-Harguindeguy et al.2013).Samples were weighed immediately after removal from the oven.Bark thickness was measured with Vernier calipers to the nearest 0.1 mm.Density was calculated as the ratio of dry weight and green volume;moisture content was the ratio of the water content and green weight;bark percentage was twice the bark thickness divided by wood diameter at breast height(Paine et al.2010;Rosell et al.2014).
Environmental factors
Three topographic variables of each 20 m×20 m quadrat(i.e.,average altitude,slope and convexity)were calculated from the altitude data.Convexity was the difference between the altitude of the focal quadrat and the average altitude of all adjacent quadrats.The convex and concave land surface features were represented by positive and negative values,respectively.The detailed methods can be found in Valencia et al.(2004)and Sungpalee et al.(2009).The collection and analysis of soil samples were performed according to the standard procedures provided by the Center for Tropical Forest Science(John et al.2007).Quadrats were divided into three topographic habitats,splitting the plot around median values of elevation and around zero convexity:valley(convexity<0);hillside(elevation<70.28 m, convexity>0); hilltop (elevation>70.28 m,convexity>0).
The plot was divided into 30 m×30 m grids(180 m×480 m),and this came to a total of 384 valid samples inside the 10-ha plot.Detailed information on the measurement of soil nutrient concentrations(total N,total P,and total K)can be found in John et al.(2007).Finally,we obtained three soil nutrient values for the 1030 points by ordinary kriging(Legleiter and Kyriakidis 2008;Liu et al.2012b).
Statistical analyses
All trait data were normalized by log10-transformations and tested using one-way analysis of variance(ANOVA,Table 2).We fitted linear-mixed models to partition the trait variances into two ecological scales(intra-and interspecific variation),nested one into another(with random effects,Auger and Shipley 2013;Messier et al.2010).The 95% confidence intervals(CIs)around the mean variance at each scale were calculated by bootstrapping with 800 runs with randomly sampled data points with replacement(Table 3).The coefficient of variations(CV)of wood and bark traits were calculated from the individual trait values within each species.We completed the Tukey’s pairwise post hoc tests for the wood and bark trait values of the three habitats.Pearson’s correlations were run both for each trait-topography;each tree’s topographic values were equal to its quadrat topographic values and each trait-soil nutrient concentrations(total N,P and K).We performed all statistical analysis in R 3.0.1(R Development Core Team 2015).
Results
Intraspecific trait variation
Intraspecific variation differed significantly regardless of the diameter class(Fig.1;Tables 2,4).Both wood density and bark density showed the lowest amount of variation,and the values were conservative within species.The mean CV for wood density and bark density across species were 11.3 and 9.3%,respectively,(Table 2).The total intraspecific variation in bark thickness and bark percentage(CV:26.5–57.7%)was the highest,followed by the WMC and BMC(CV:15.1–22.8%,Fig.1;Table 2).We also found the trait of the smallest DBH class always hadlarger coefficients of variation than other DBH classes.The CV of traits in the smallest trees of Castanopsis and Lithocarpus were often larger than for the older trees.
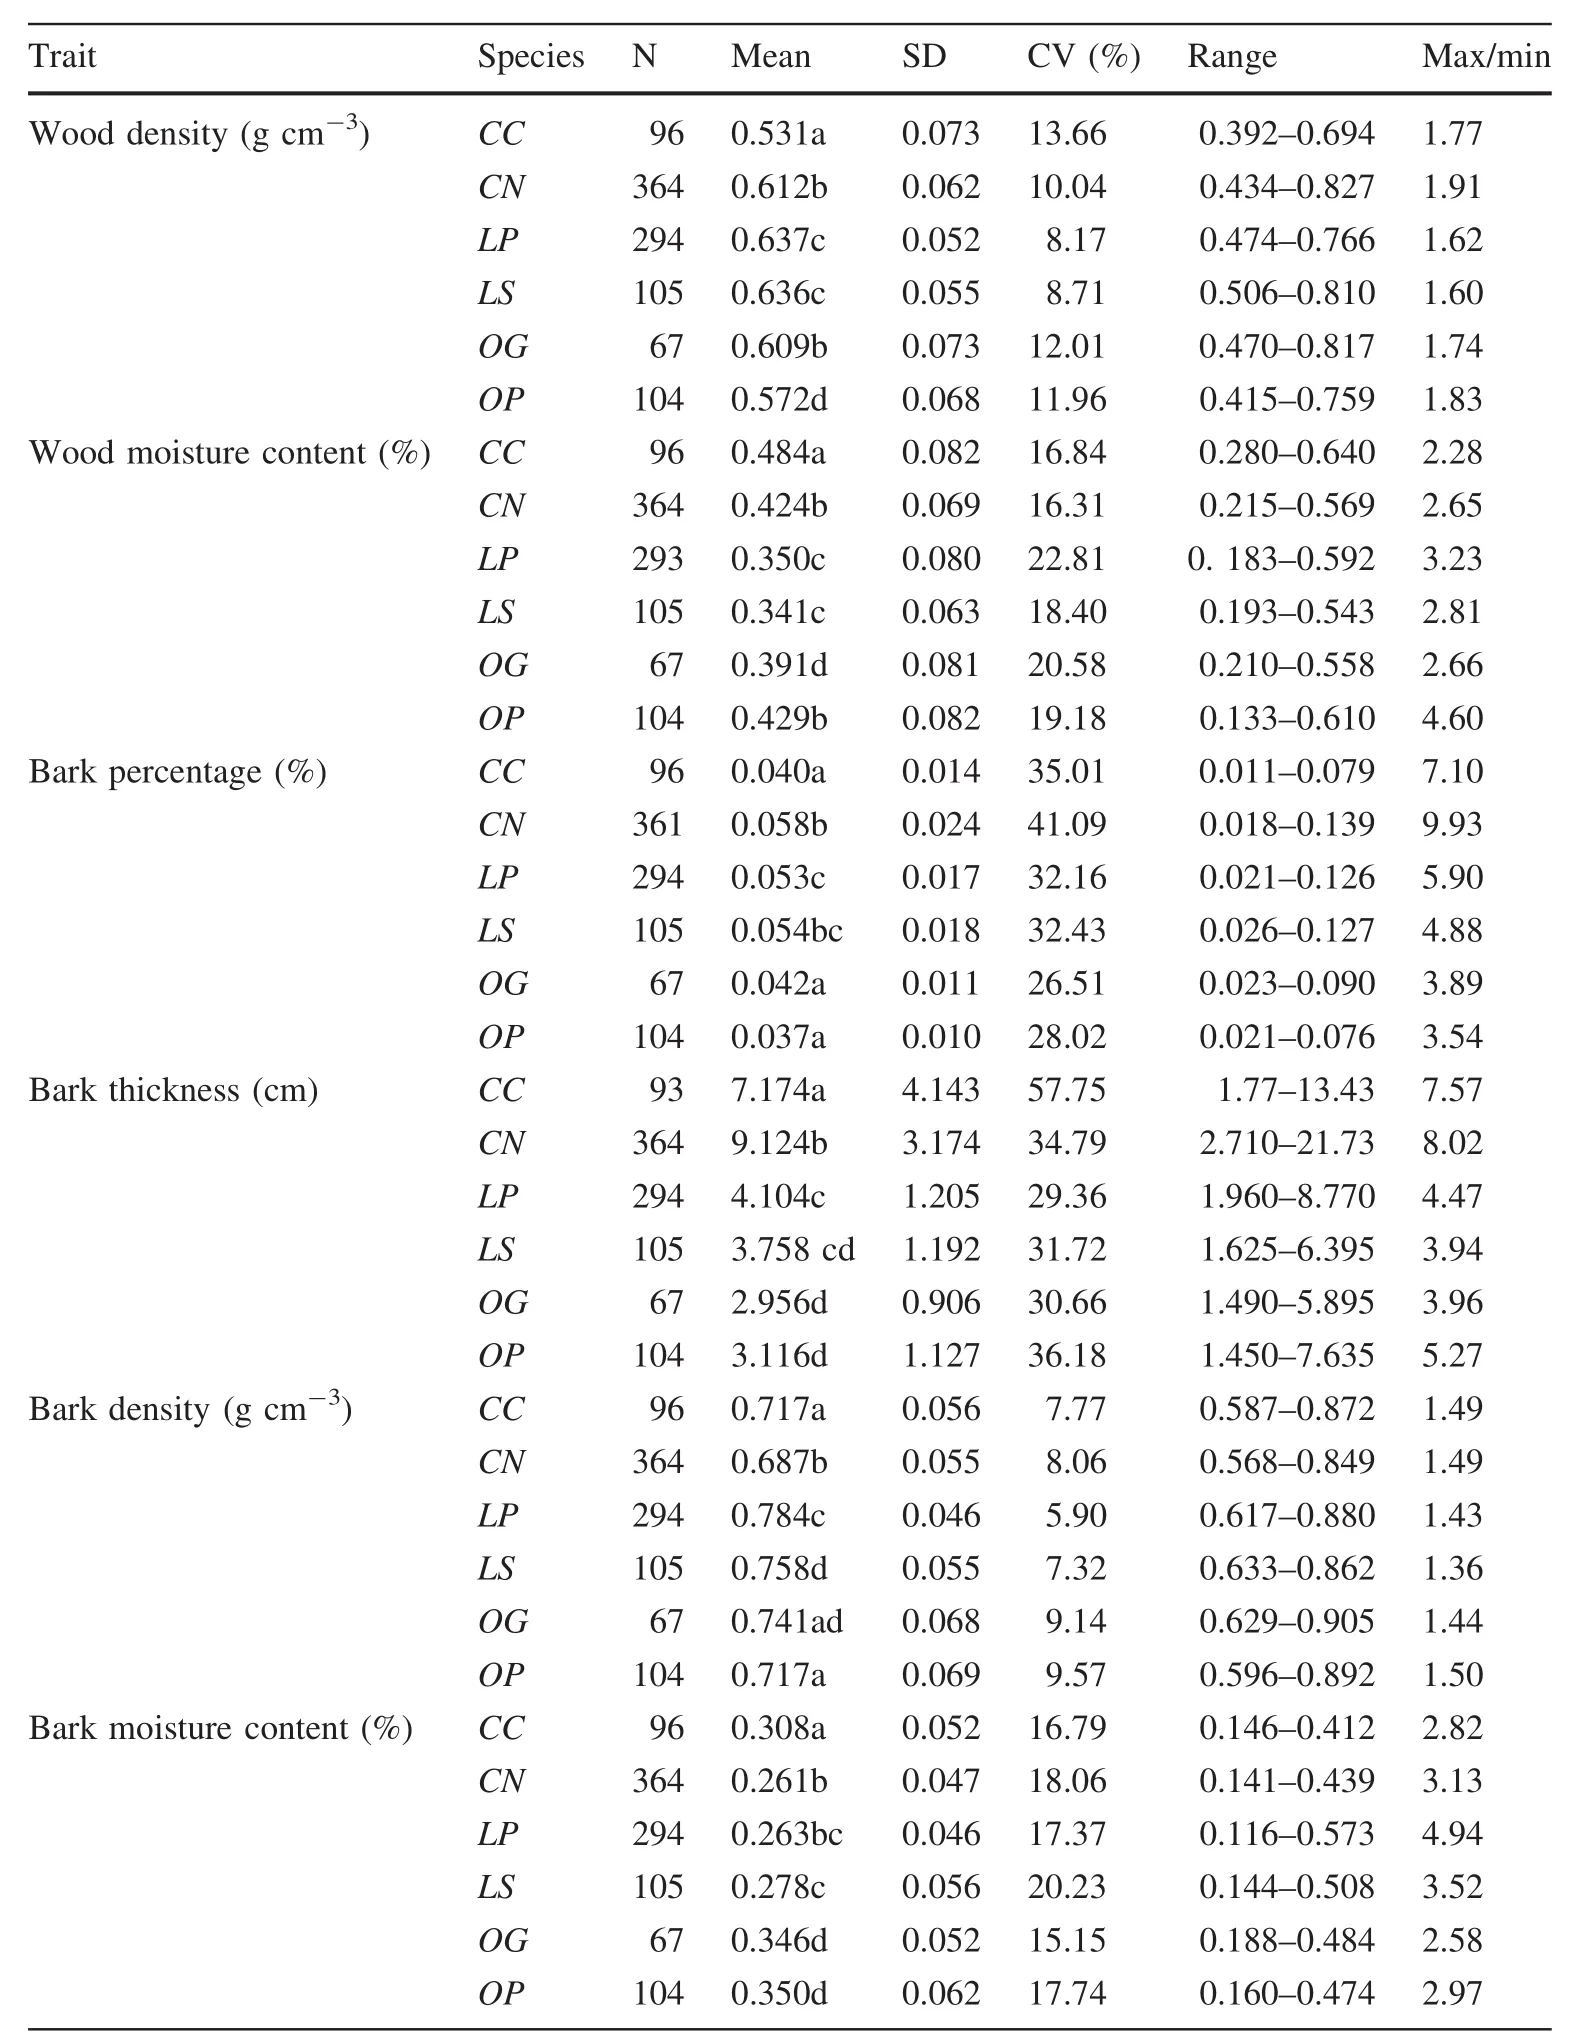
Table 2 Summary statistics of the six traits of each species from the 10 ha plot
For the six traits measured, five varied more within species than among species.The intraspecific variation of BT was less than the interspecific variation(Table 3).The intraspecific variation in wood density and WMC showed a weak decreasing trend with increasing size classes,while there were positive correlations between bark trait and tree size(Table 4).
The correlations between environmental factors and functional traits
The sibling species had similar relationships between traits and environmental variables(Tables 5,6).Among the sixenvironmental factors,altitude,convexity and total soil phosphorus had more significant correlations with wood and bark traits than with other environmental factors(Fig.2;Tables 5,6).The correlations between traits and topography across the six species were variable:more than one-third of the relationships(45–126)were significant,and the number of negative and positive correlations was roughly equal(61–65,Table 5).Convexity was positively correlated with most of the wood and bark traits for all six species(Table 5).There were also significant correlations between total soil phosphorus and bark density across the species,except for Castanopsis carlesii(Table 6).The response of the measured traits to slope,total soil nitrogen and potassium was relatively conservative(Tables 5,6).Five out of six traits were significantly correlated with habitats(P<0.05,Table 7).The trait values of trees on the hilltop had significant differences to those in valleys and on the hillside(Table 7).
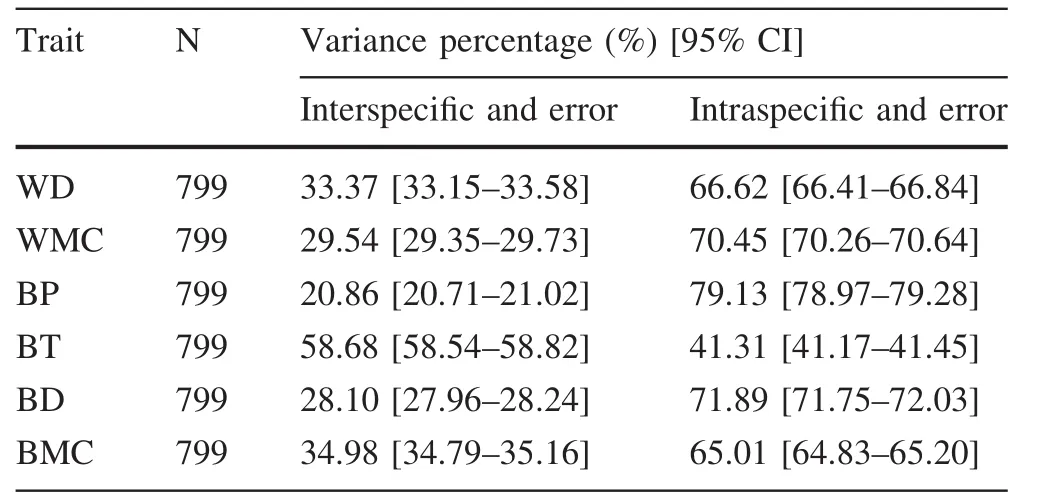
Table 3 Partitioning of variance in six traits
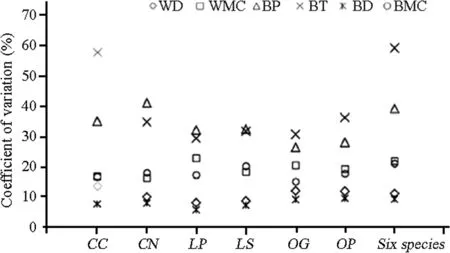
Fig.1 The coefficient of variation of each trait among six species.WD wood density,WMC wood moisture content,BP bark percentage,BT bark thickness,BD bark density,BMC bark moisture content.CN:Castanopsis nigrescens,CC Castanopsis carlesii,LP Lithocarpus polystarhyus,LS Lithocarpus synbalanos,OG Ormosia glaberrima,OP Ormosia pachycarpa
The correlation coefficients suggest that WMC,bark density,and BMC shared similar responses to the environment as wood density(Fig.2a,d,e).The relationship between bark density and the environment was positively correlated with the relationship between wood density and the environment(Fig.2d),whereas the relationship between BMC and the environment and between WMC and the environment were negatively correlated with the relationship between wood density and the environment(Fig.2a,e).The results show that trees with dense wood also had dense bark,and wood and bark had similar responses to topographic and edaphic environments(Fig.2).

Table 4 The correlation between traits and diameter at breast height in six species
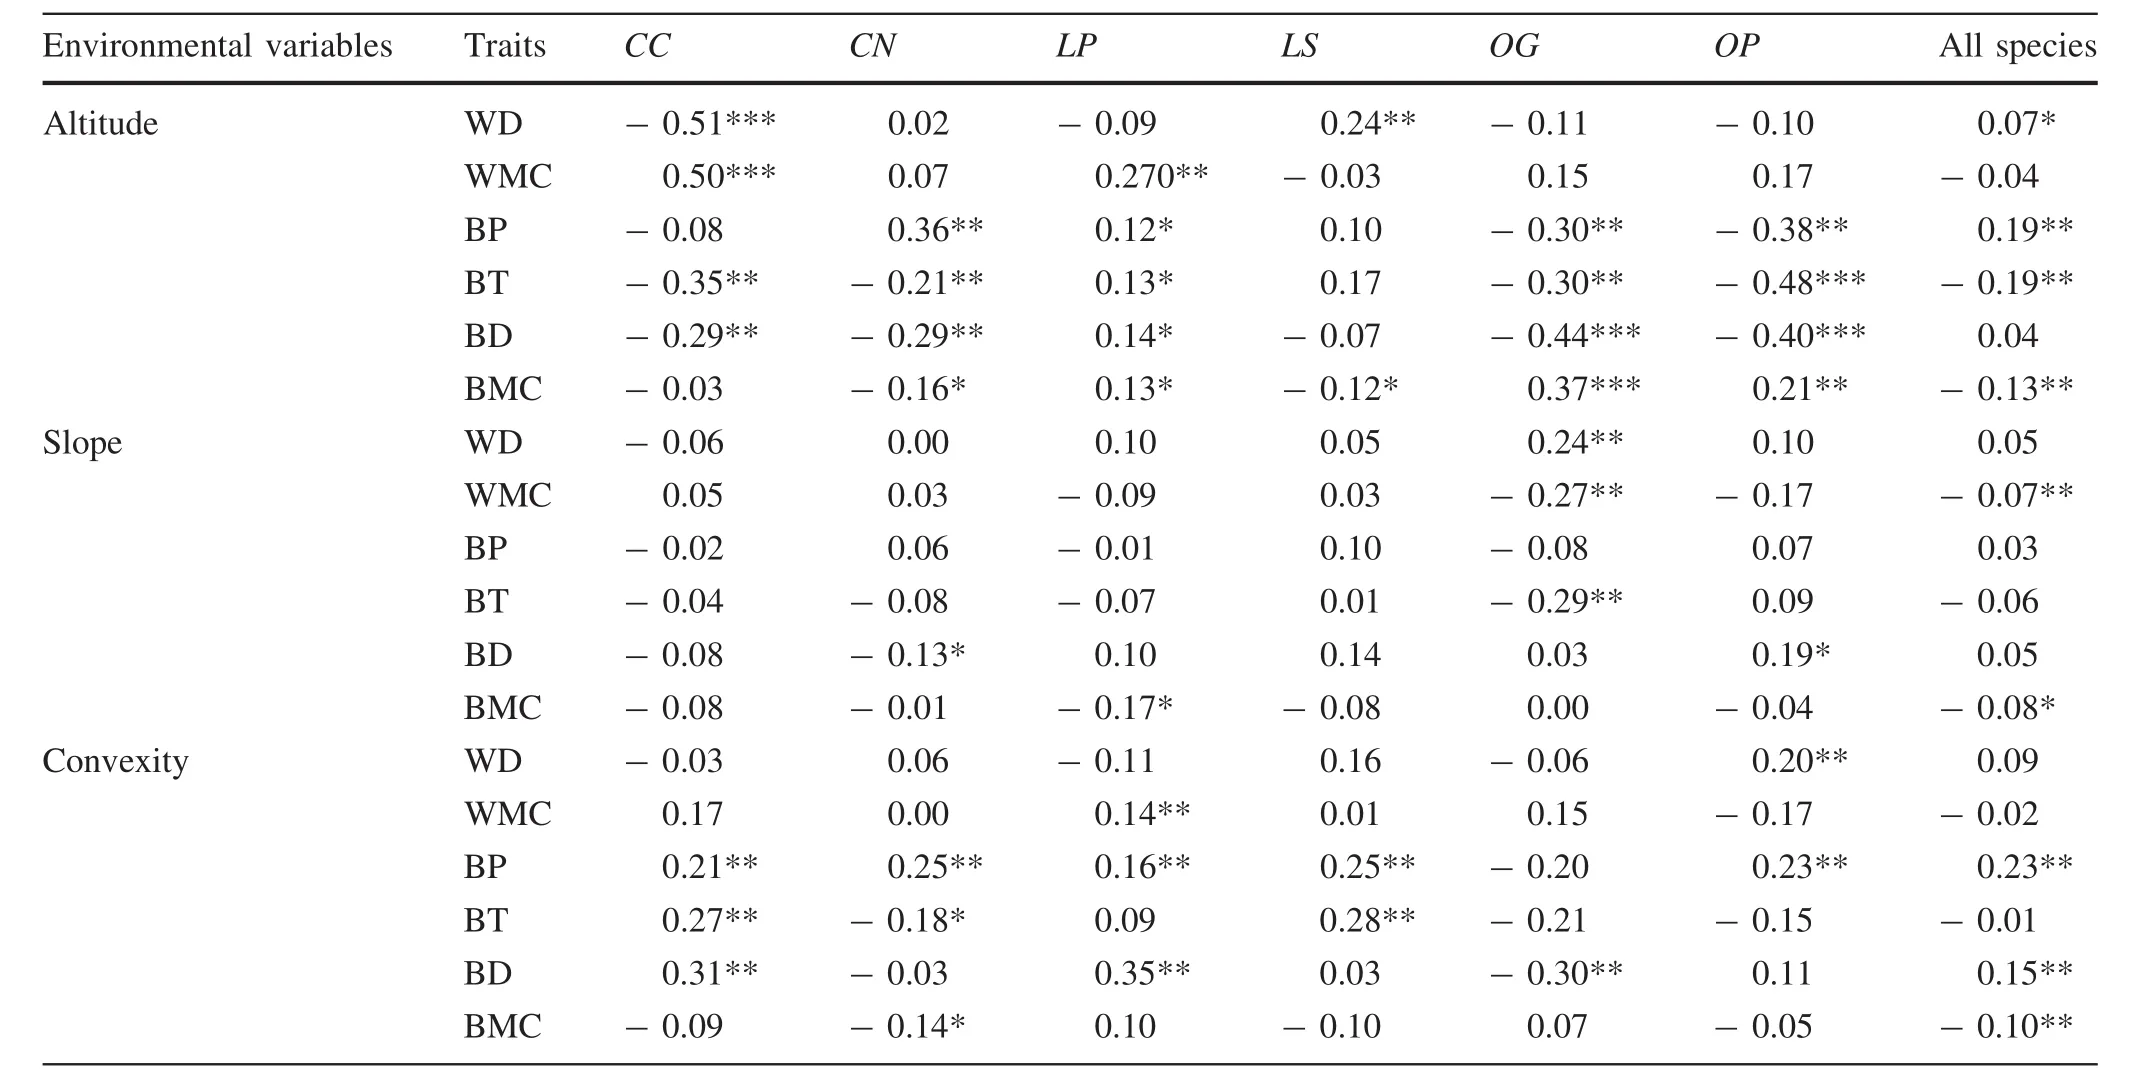
Table 5 The correlation between intraspeci fic traits and topographic variables in six species
Discussion
Intraspecific and interspecific variation
By measuring wood and bark traits of 1030 individuals belonging to six subtropical tree species,the interspecific and intraspecific variations of functional traits and how they correlated with topographic factors were evaluated.Intraspecific variation was larger than interspecific variation in most size classes(Table 3),which suggests that the processes that individual trees underwent to adapt to their local environment could play important roles in community assemblage and impact on the nature of interspecific interactions(Messier et al.2010;Fajardo and Piper 2010;Kang et al.2014;Paine et al.2010;Pruitt and Ferrari 2011).However,other researchers have found interspecific variation to be much larger than intraspecific variation in wood and bark traits(Rosell et al.2014).
The relative contributions made by intra-and interspecific variation were affected by species richness,age(or diameter classes),sample position,sample size,scales,and season of the sampling(Albert et al.2011;Auger and Shipley 2013;Jung et al.2010;Kang et al.2014;Paine et al.2010;Pruitt and Ferrari 2011;Violle et al.2012).The relative performance of various intra-and interspecific trait compositions appears to depend on the presence of heterospecifics(i.e.,an aspect of the biotic environment)and habitat structure(Pruitt and Ferrari 2011;Modlmeier et al.2014).We also found that the influence of environmental factors to most traits were more than genomic imprinting at lower DBH classes.We should realize that the results pertaining to the comparison of interspecific and intraspecific variation were not the same under different conditions in different studies;the results merely reflect the diversity of phenotypic plasticity and the adaptability of plants to environmental heterogeneity (Albert et al.2011,2012;Kang et al.2014;Kichenin et al.2013;Kraft et al.2008,2015;Laughlin et al.2012).
Intraspecific variance in wood density and BMC showed a decreasing trend along growth stages,an increasing trend for bark percentage and bark thickness,and remained relatively constant for bark density and BMC.This is consistent with the explanation of Iida et al.(2012)that there should be a trade-off between functional traits at different growth stages or between species.Using a hierarchical Bayesian framework,they found that wood density was negatively correlated with DBH,the same found in our study.Paine et al.(2010)noted that mean bark thickness oftrees with DBH≥20 cm was significantly less than for trees with DBH≥10 cm.Similarly,in a recent study which worked with wood and leaf traits in a subtropical evergreen broad-leaved forest in the Ningbo area,researchers found that the relative contributions made by intra-and interspecific variation varied at different sample scales(Kang et al.2014).
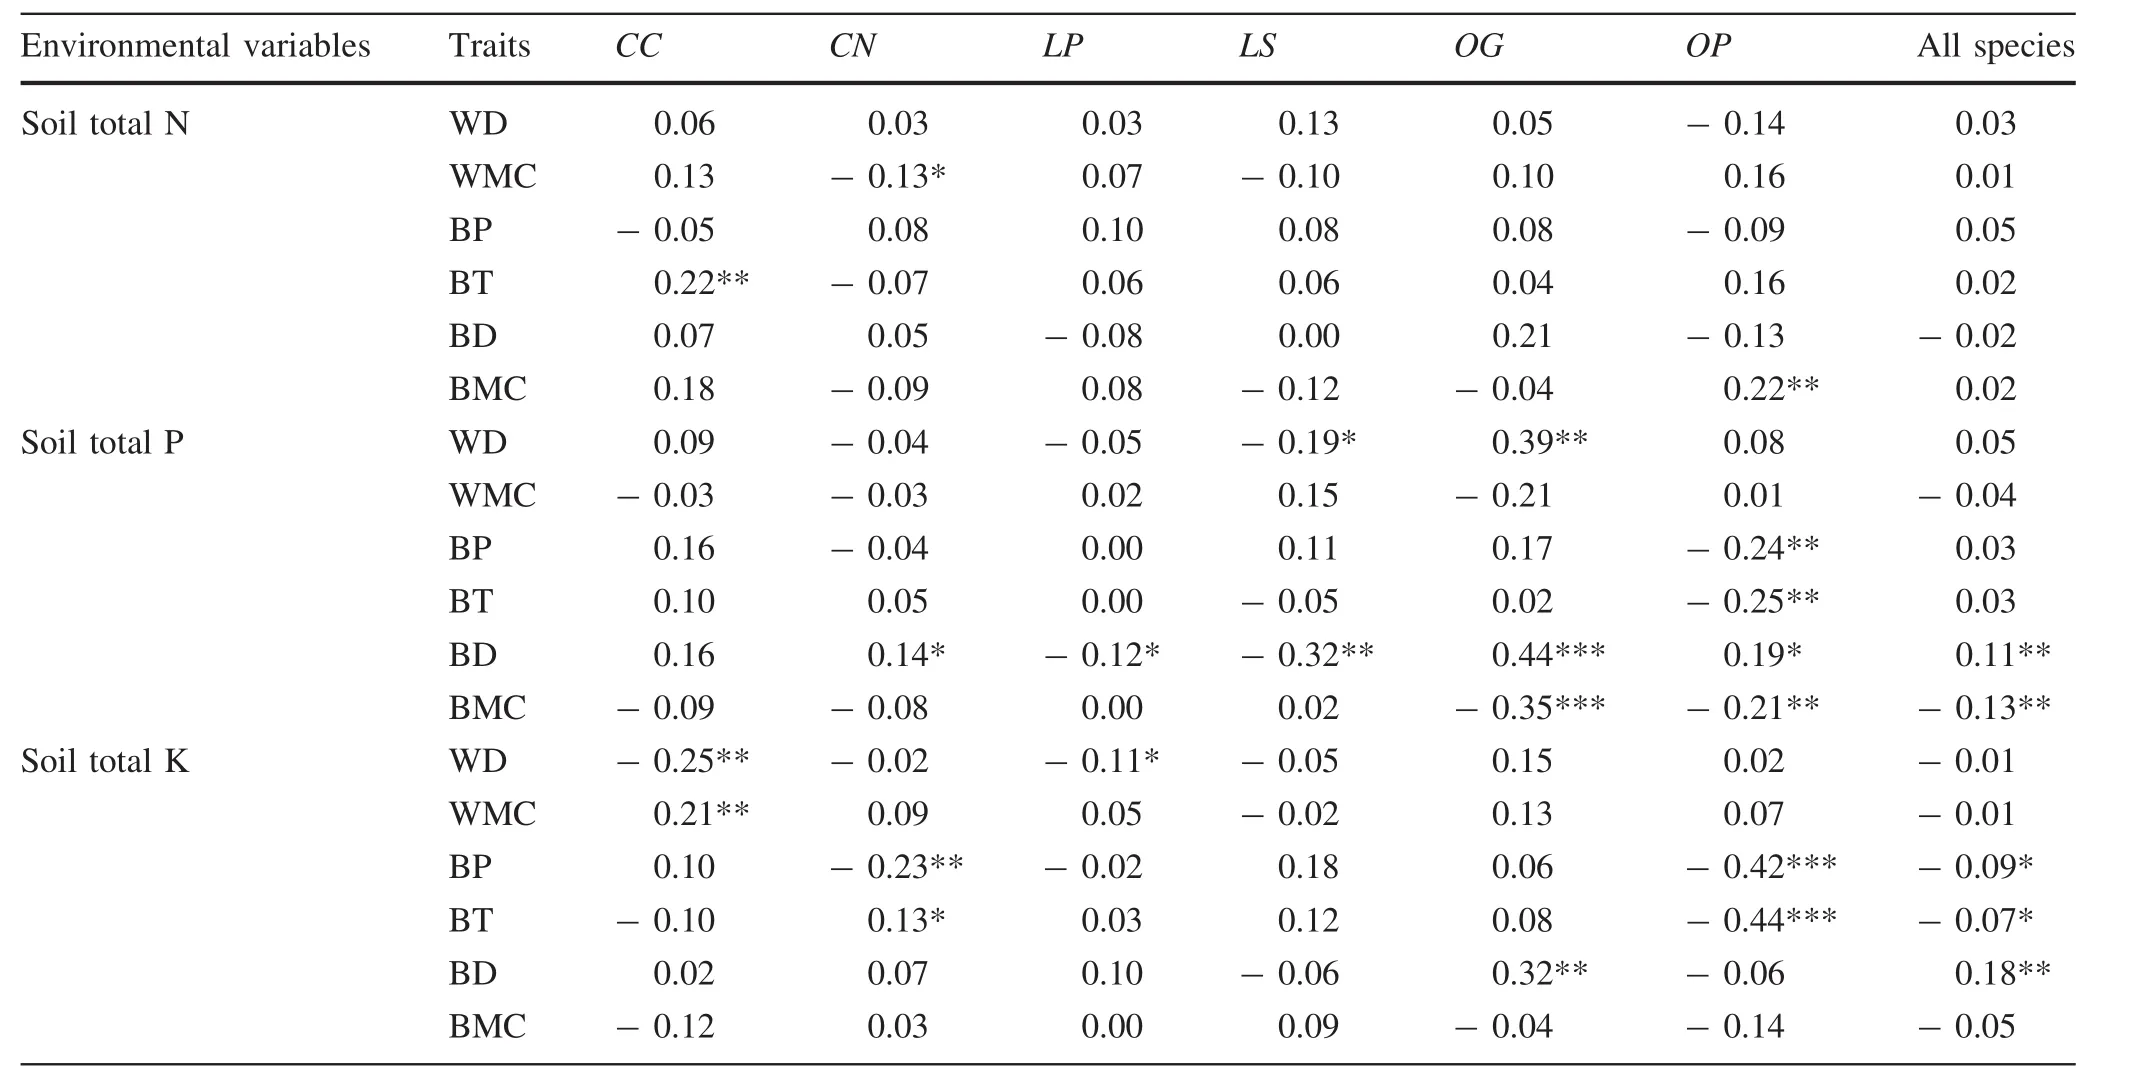
Table 6 The correlation between intraspecific traits and soil nutrients in six species
Trait-trait correlations within species
We detected a strong correlation between wood and bark traits which may con firm the existence of different ecological strategies or trade-offs between traits(Chave et al.2009;Courbaud et al.2012;Fajardo and Piper 2010;Iida et al.2012;Reich 2014;Richardson et al.2013;Rosell et al.2014;Violle et al.2012).Species with dense wood may have good mechanical stability(Chave et al.2009),but this does not necessarily mean they also had thicker bark and lower BMCs(Lawes et al.2011;Paine et al.2010).That bark thickness was significantly and positively correlated with bark density and BMC suggests that thick bark and high bark moisture content occurred in the same tree(Paine et al.2010).Bark traits were often closely associated with wood traits.Poorter et al.(2014)found that there was a trade-off between water content and density of bark and wood.Species with low wood densities often were relatively taller in order to attain better light conditions on one hand while on the other hand,species with high wood densities had efficient horizontal crowns to enhance light interception(Iida et al.2012).The different trait–trait relationships for each species may reflect species-specific architecture and defense strategies(Fajardo and Piper 2010;Iida et al.2012;Paine et al.2010;Reich 2014;Rosell et al.2014;Violle et al.2012).
In our study,there was a trend of increasing in average bark thickness with increasing DBH,and the trends were consistent for all species.This conclusion is similar to that of Paine et al.(2010).At least two of the six traits were strongly and positively correlated with diameter at breast height.The smaller trees,Lithocarpus polystachyus and L.synbalanos,had small mean trait values but had higher coefficients of variation.With Castanopsis,the older trees always had higher coefficients of variation.These intraspecific trait variations were close to intraspecific trait acclimation or phenotypic plasticity (Albertetal.2011,2012;Kichenin et al.2013).
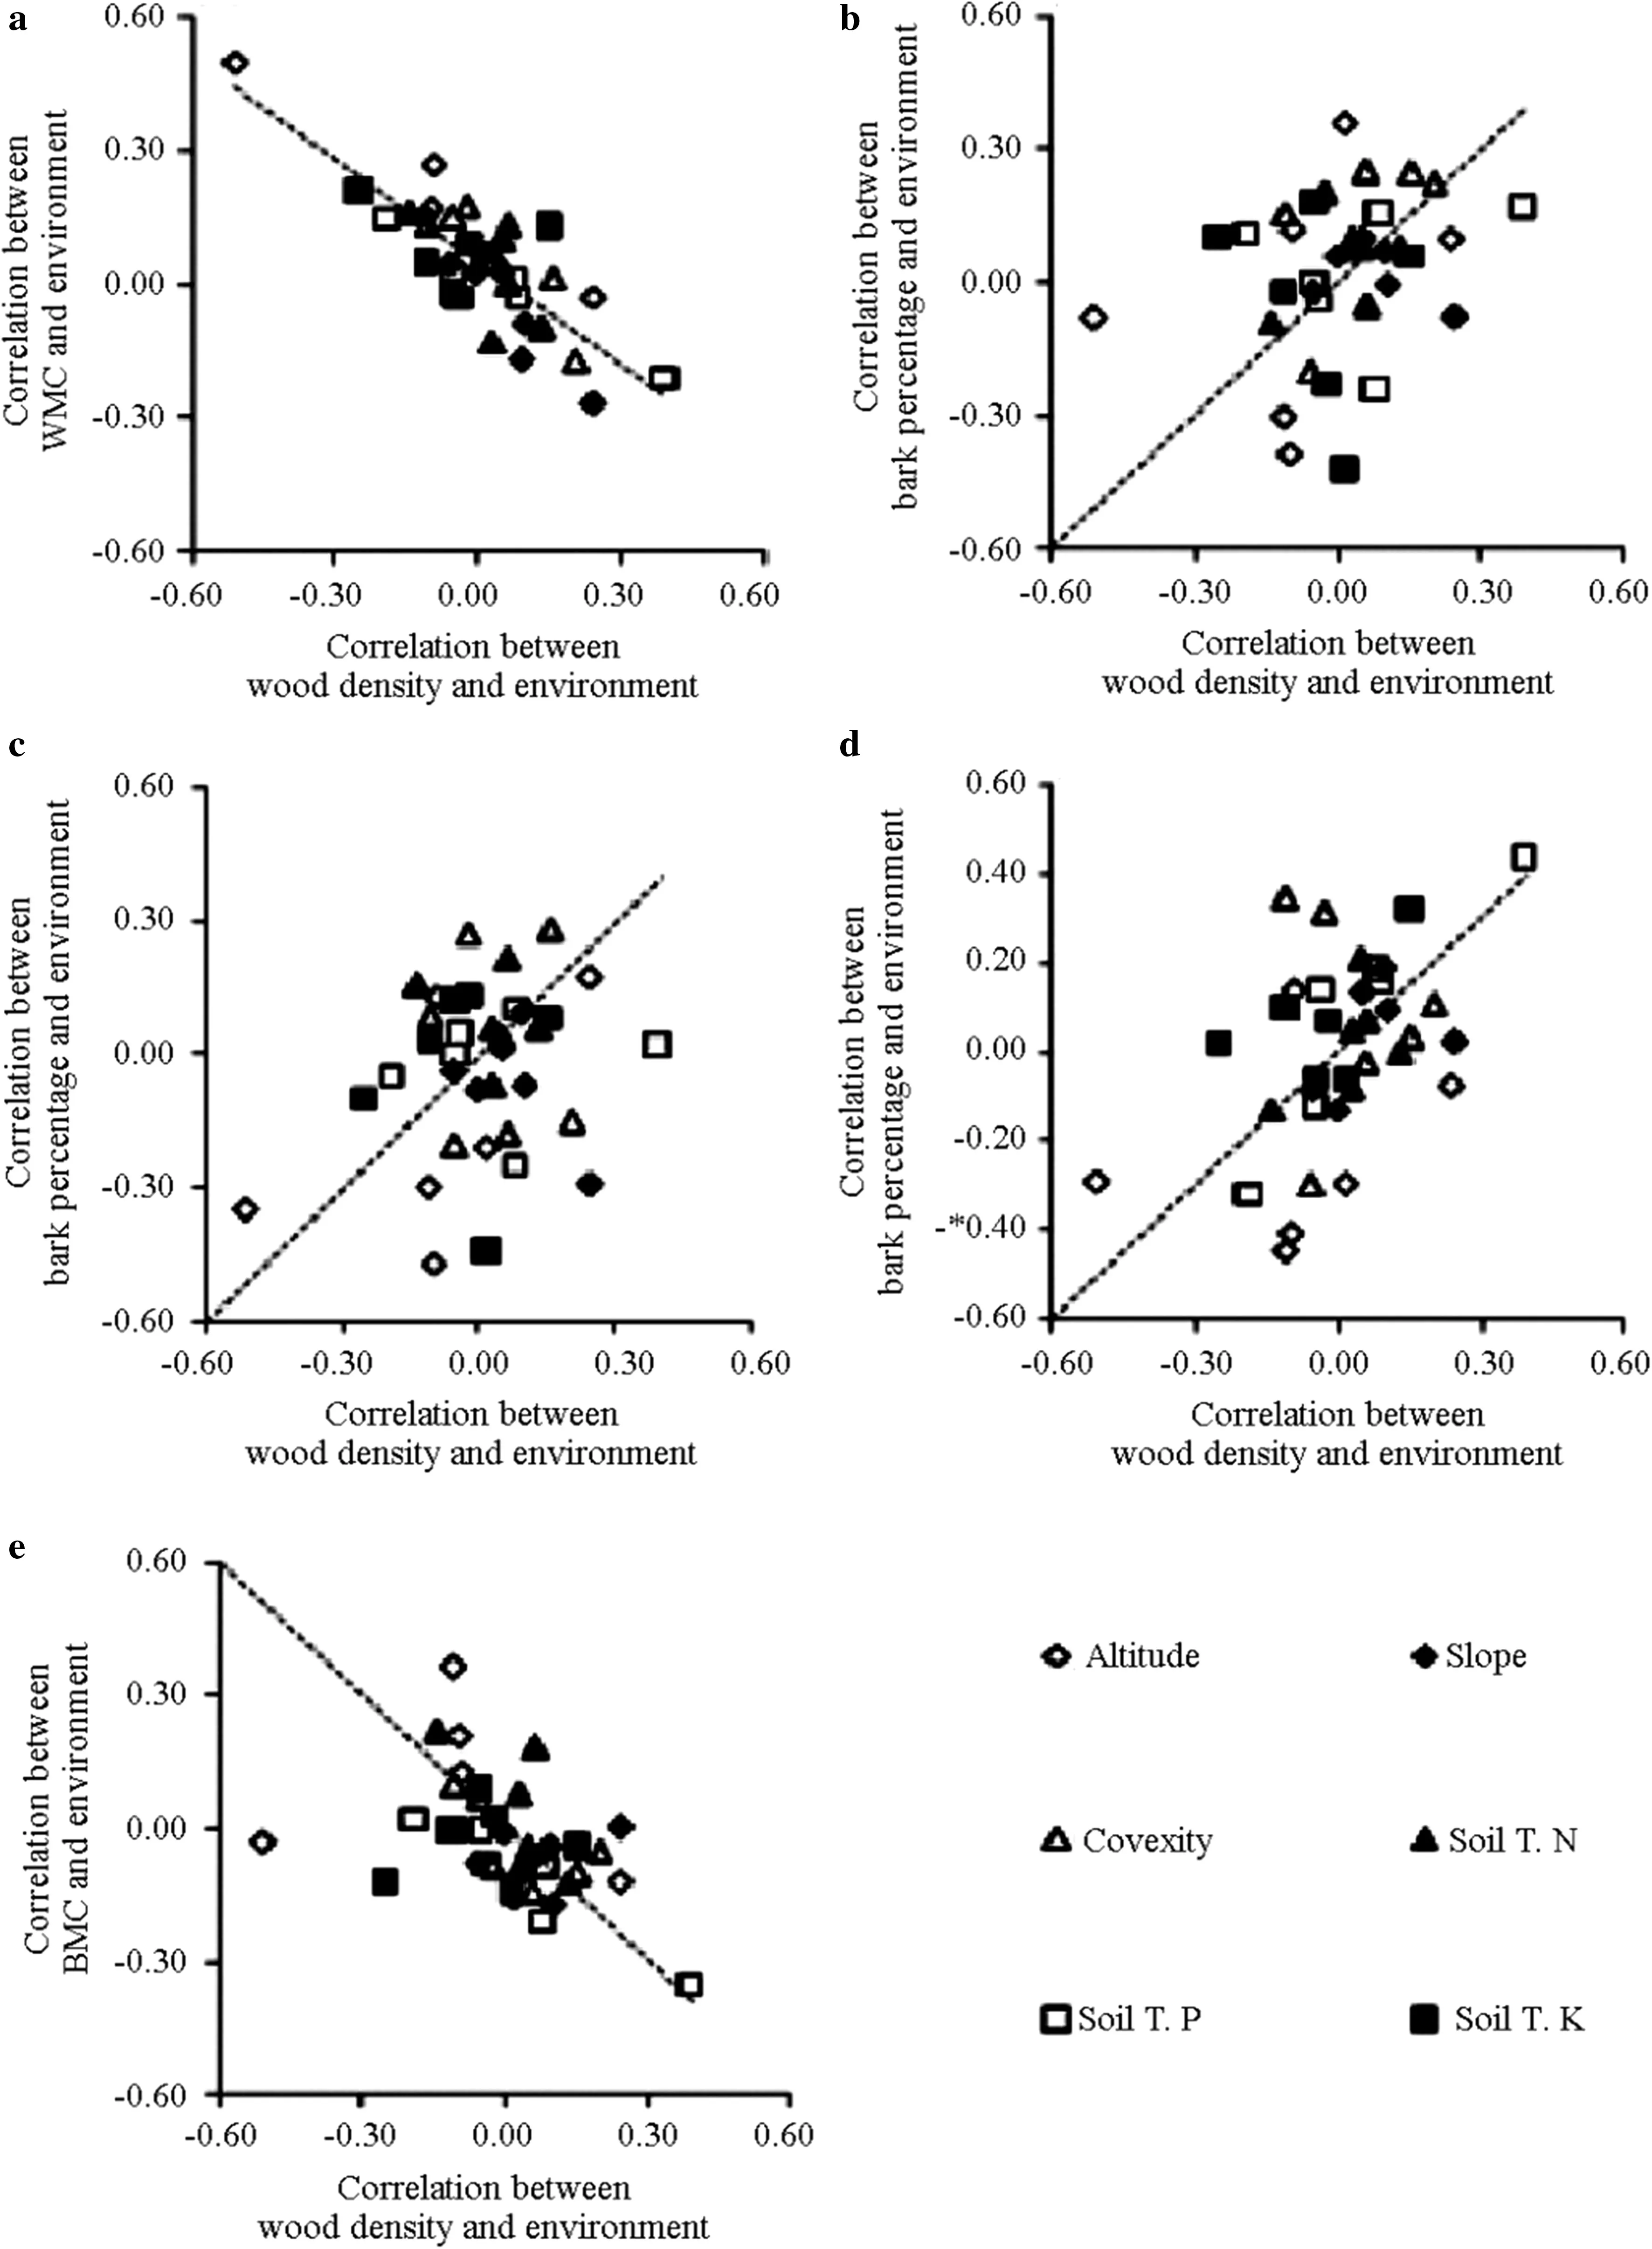
Fig.2 The relationships between correlation coefficients of environmental factors with wood density and the other five traits.Coordinate axis show the correlation coefficients between traits and six environmental factors across six species.Each data point stands for a pair of the correlation coefficients for wood density and bark trait with the same environmental factors within a species.Dashed lines show the 1:1 relationship expected from interspecific trait correlations
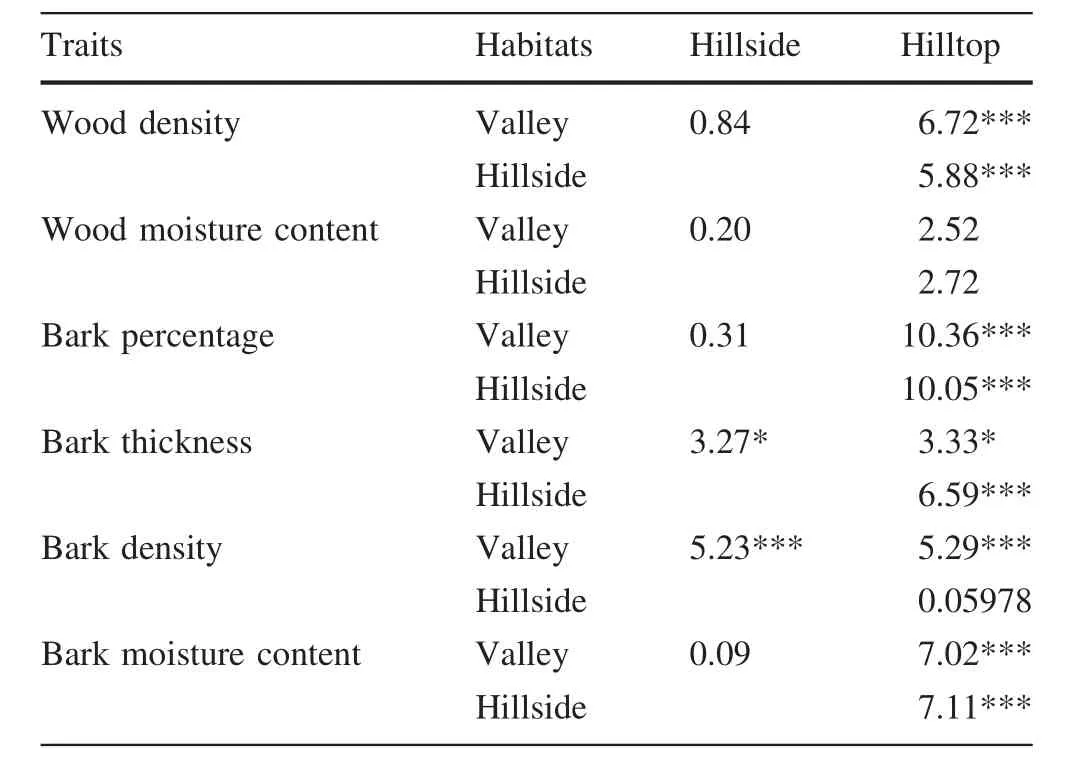
Table 7 The analysis of variance between traits and habitats in six species
Relationships between trait and environmental factors
These were more consistent than those of species belonging to different genera(Table 5).Our results show that altitude,convexity and total soil phosphorus concentrations were more important to wood and bark traits than other environmental factors(Table 5).Dense wood and thin bark are often found with species on steep slopes at lower altitudes(Chave et al.2009;Swenson and Enquist 2007;Richardson et al.2013).In this study,wood density was slightly higher on ridge tops and valleys than on gentle slopes,and the density of C.nigrescens and L.synbalanos increased with altitude.These results were similar to dense wood species which tended to be on ridge-tops(Kraft et al.2008).Sungpalee et al.(2009)found that stand-level wood density was higher at lower altitudes,and that altitude and latitude were more important for predicting the trait variation than mean annual temperatures and rainfall.This might be due to the differences in the species’niches and their adaptation strategies(Courbaud et al.2012;Kraft et al.2008,2015;Violle et al.2012).
Plant traits are strongly and consistently correlated with resource acquisition strategies and population size,and can be classified along important resource axes(Liu et al.2012b;Reich 2014).The variation in soil nutrients has an important effect on plant growth,especially to light-demanding species(Baker et al.2004;Muller-Landau 2004).Our results also show that wood density is negatively correlated with soil nutrients as previously reported(Baker et al.2004;Liu et al.2012b).Relationships between bark traits and environmental factors were similar in the sibling species.Trees with denser bark grew in soils with higher nitrogen and phosphorous.This might explain why phosphorus levels were higher in the bark than in other parts of the trees(Benner 2011).
In this study,wood and bark traits varied widely within species but the relationship between trait and environment were inconsistent among co-occurring species,even along short environmental gradients.This suggests that species have unique solutions to optimizing traits along environmental gradients and hence promote niche partitioning and species coexistence.Our results demonstrate that,when considering variation within species along environmental gradients,the intraspecific variability in each trait does not necessarily follow the same spatial pattern as interspecific variability.This study emphasizes that the distribution of functional trait variations at the individual level is more complex or even disordered than that based on a species and a quadrat level.The analyses of intraspecific variations in wood and bark traits in subtropical forests helps to understand the idea that suites of intraspecific traits develop because of shared responses to strong environmental factors.The influence from a species’development stage on trait variation should be taken seriously in plant functional ecology.Further studies are needed,especially on the trade-offs between traits and on spatial patterns of soil nutrition and light conditions in order to understand the causal processes producing the observed relationship between phenotypic plasticity and environmental heterogeneity.
AcknowledgementsWe would like to thank Fangliang He and Yuxin Chen for their assistance in writing this manuscript.We also thank Weinan Ye,Buhang Li,Xubing Liu and Meng Xu for their assistance in the field.
 Journal of Forestry Research2018年6期
- Journal of Forestry Research的其它文章
- Black locust(Robinia pseudoacacia L.)as a multi-purpose tree species in Hungary and Romania:a review
- The impact of the environmental factors on the photosynthetic activity of common pine(Pinus sylvestris)in spring and in autumn in the region of Eastern Siberia
- Osmoregulators in Hymenaea courbaril and Hymenaea stigonocarpa under water stress and rehydration
- Effect of nitrogen levels on photosynthetic parameters,morphological and chemical characters of saplings and trees in a temperate forest
- Free amino acid content in trunk,branches and branchlets of Araucaria angustifolia(Araucariaceae)
- Exogenous application of succinic acid enhances tolerance of Larix olgensis seedling to lead stress
