Effect of environmental factors on species diversity of the Yenice Hot Spot Forests in Turkey
Sevda Türkis¸ •Emire Elmas
Abstract We quantified the diversity of vascular plant species and described soil properties and topographical and climatic conditions of the C¸itdere and Kavakli Nature Reserves in the Yenice Forest of Turkey.We used the Shannon–Weiner and Simpson’s indices of diversity,Margalef’s index of species richness and Pielou’s evenness index to quantify the structure of vascular plant assemblages.We measured soil parameters(NO3-,NH4+,available P,Mg++,K+,Na+,Ca++,organic matter,pH,soil moisture),elevation,slope gradient and aspect and their correlations with plant community parameters.In total,we recorded and identified 207 species and subspecies in the study area.Species cover,richness and diversity indices varied significantly by vegetation type(P<0.01).Available NO3-and Ca++in the soil were important factors for the area and species representation in the species-environment correlations estimated for the Kavaklı area.Available NO3-,pH,organic matter,Ca++and K+in the soil were important factors for the area and species representation in the species-environment correlations analysed for the C¸itdere area.
Keywords Diversity ·Forest ecosystems·Yenice hotspot·Species richness
Introduction
In 1999,the World Wide Fund for Nature(WWF)identified the Yenice Forests,which includes the C¸itdere and Kavaklı Nature Reserves,as one of 100 global forests that need urgent protection and one of nine such forests in Turkey.These areas,identified as ‘Hotspots of European Forests’,are among the most biodiverse forests on earth.Turkey is the only country with three phytogeographical regions that are part of the 34 biodiversity hotspots identified in the world(Conservation International 2005;Mittermeier et al.2005).The Yenice Forest,located along the northwestern section of Anatolia,Turkey,contains nine different biodiversity hotspots.In 1999,Yenice Forest,which includes the C¸itdere and Kavaklı Nature Reserves,was identified by the WWF(World Wildlife Fund)as one of 100 intact forests found worldwide and one of nine forests in Turkey that need urgent protection.Specifically,protection is needed to preserve the number of arboreal species,monumental trees,deep valleys,rivers and the rich animal diversity that they harbour,plant diversity,old natural forests,lack of settlements/housing,scenic value and the range of endangered species found there(Lise 2005).Areas recognized as ‘European Forest Hotspots’’are forests identified as having the highest levels of biodiversity in the world.To date,some areas of Yenice Forest are protected by law under different statutes:Kavaklı Nature Reserves,an area of 334 ha,and C¸itdere Nature Reserves,an area of 721 ha,were declared protected areas in 1987 by the Turkish government.The Kavaklı area has also benefited from the natural protection found in its steep slopes that inhibit human activities and it is referenced as one of the rarest forests within Yenice Forest.In 2010,concern for the European hop-hornbeam(Ostrya carpinifolia Scop.),a vulnerable species in this region,led the Ministry of Forestry to label this area a Genetic Resources Conservation Forest.
Aksoy(1985)conducted a study in this region,entitled‘Oak and Yew Forest Remnants and Forest Reserves in Yenice Forest Management Land’.In addition to the importance of this type of research in general,the study examined the Strandzha oak(Quercus hartwissiana Steven)and a yew(Taxus baccata L.),virgin forest remnants,with respect to their habitat and silvicultural properties and the number,size and conservation of forest reserves were also mentioned.As a result of the study,it was suggested that the status of these two forest remnants should be changed to Forest Reserves(Nature Protection Areas)and that a ‘forest reserves network’should be established that speci fically protects virgin forest remnants(forest vegetation types that do not include virgin forest remnants would be covered as natural forests)that represent all-natural forest vegetation in Turkish forests.Özalp(1993)conducted a study entitled ‘Forest Communities in the C¸itdere(Yenice-Zonguldak) Region and their Silvicultural Assessment’,which identified 14 different forest populations in a sample of 134 areas of a vegetation survey in the C¸itdere Region in Yenice Forest Management Land.In the publication, ‘Turkey’s122 Important Plant Areas’,Ö zhatay et al.(2005)stated that ‘Yenice Forest is one of the 122 Important Plant Areas in Turkey,with its pristine views and mostly undisturbed humid forest communities,monumental trees and deep valleys’.
Our study objectives were to quantify the diversity of plant communities in old and natural forests,to describe ecosystem dynamics and to identify the factors that influence the diversity of old forest land.The study aimed to contribute to the development of conservation strategies for the Yenice Forest and for other protected forests in Turkey.
Materials and methods
Vegetation sampling
Sampling was conducted in 24 forest plots during 2014–2016 in the Kavakli and C¸itdere Nature Reserves of the Yenice Forest(Fig.1).Continuous sampling plots were selected according to their successional stage:pioneer(grass),intermediate(shrub)and mature(forest).A grand total of 120 sampling points were examined,consisting of quadrats of 20 m×20 m for trees,10 m×10 m subplots for shrubs and 1 m×1 m for grass.The percentage of cover was recorded for each species within continuous sampling plots(Braun-Blanquet 1932).Collected specimens were identified according to Davis(1965–1988)‘Flora of Turkey’.Slope gradient was measured in the field using a clinometer and is reported here as a percentage.Slope aspects at sampling plots were taken as linear values between 0(225°azimuth)and 2(45°azimuth)and were transformed(transformed aspect=cos(45-aspect degree)+1)(Beers et al.1966).Thus,aspect values were digitized.
Climate of the study area
According to data obtained from a climate station established in the study area within the scope of the project,the mean annual temperature is 10.34°C.The maximum mean temperature of the warmest month,July,was 33.9°C and the minimum mean temperature of the coldest month,January,was-9.9°C(Table 1).According to the diagram drawn using climate station data,there is no dry period within the forest(Fig.2).The annual precipitation regime includes winter,spring,autumn and summer seasons:an Eastern Mediterranean Precipitation Regime(type 2)prevails within the forest.We used Emberger’s formula to determine general drought intensity.The S value of the forest was determined as 5.86 and according to this value,the inner forest has a sub-Mediterranean climate.
Diversity statistics
The Shannon–Wiener index of species diversity was calculated as Eq.1:

where H′is the Shannon diversity index,s is the total number of recorded species,piis the proportion of percentage cover of the ith species to the sum of the percentage cover of all species and ln is the natural logarithm.
Margalef’s index of species richness was calculated as Eq.2:

where Da is Margalef’s index of species richness,S is the number of recorded species and N is the recorded number of individuals of all species.
Evenness was quantified using Shannon and Simpson’s(Dominance index)indices.Shannon’s equitability(EH)takes a value between 0 and 1 and was calculated as shown in Eq.3.

where E is Evenness;H’is Shannon’s diversity index.
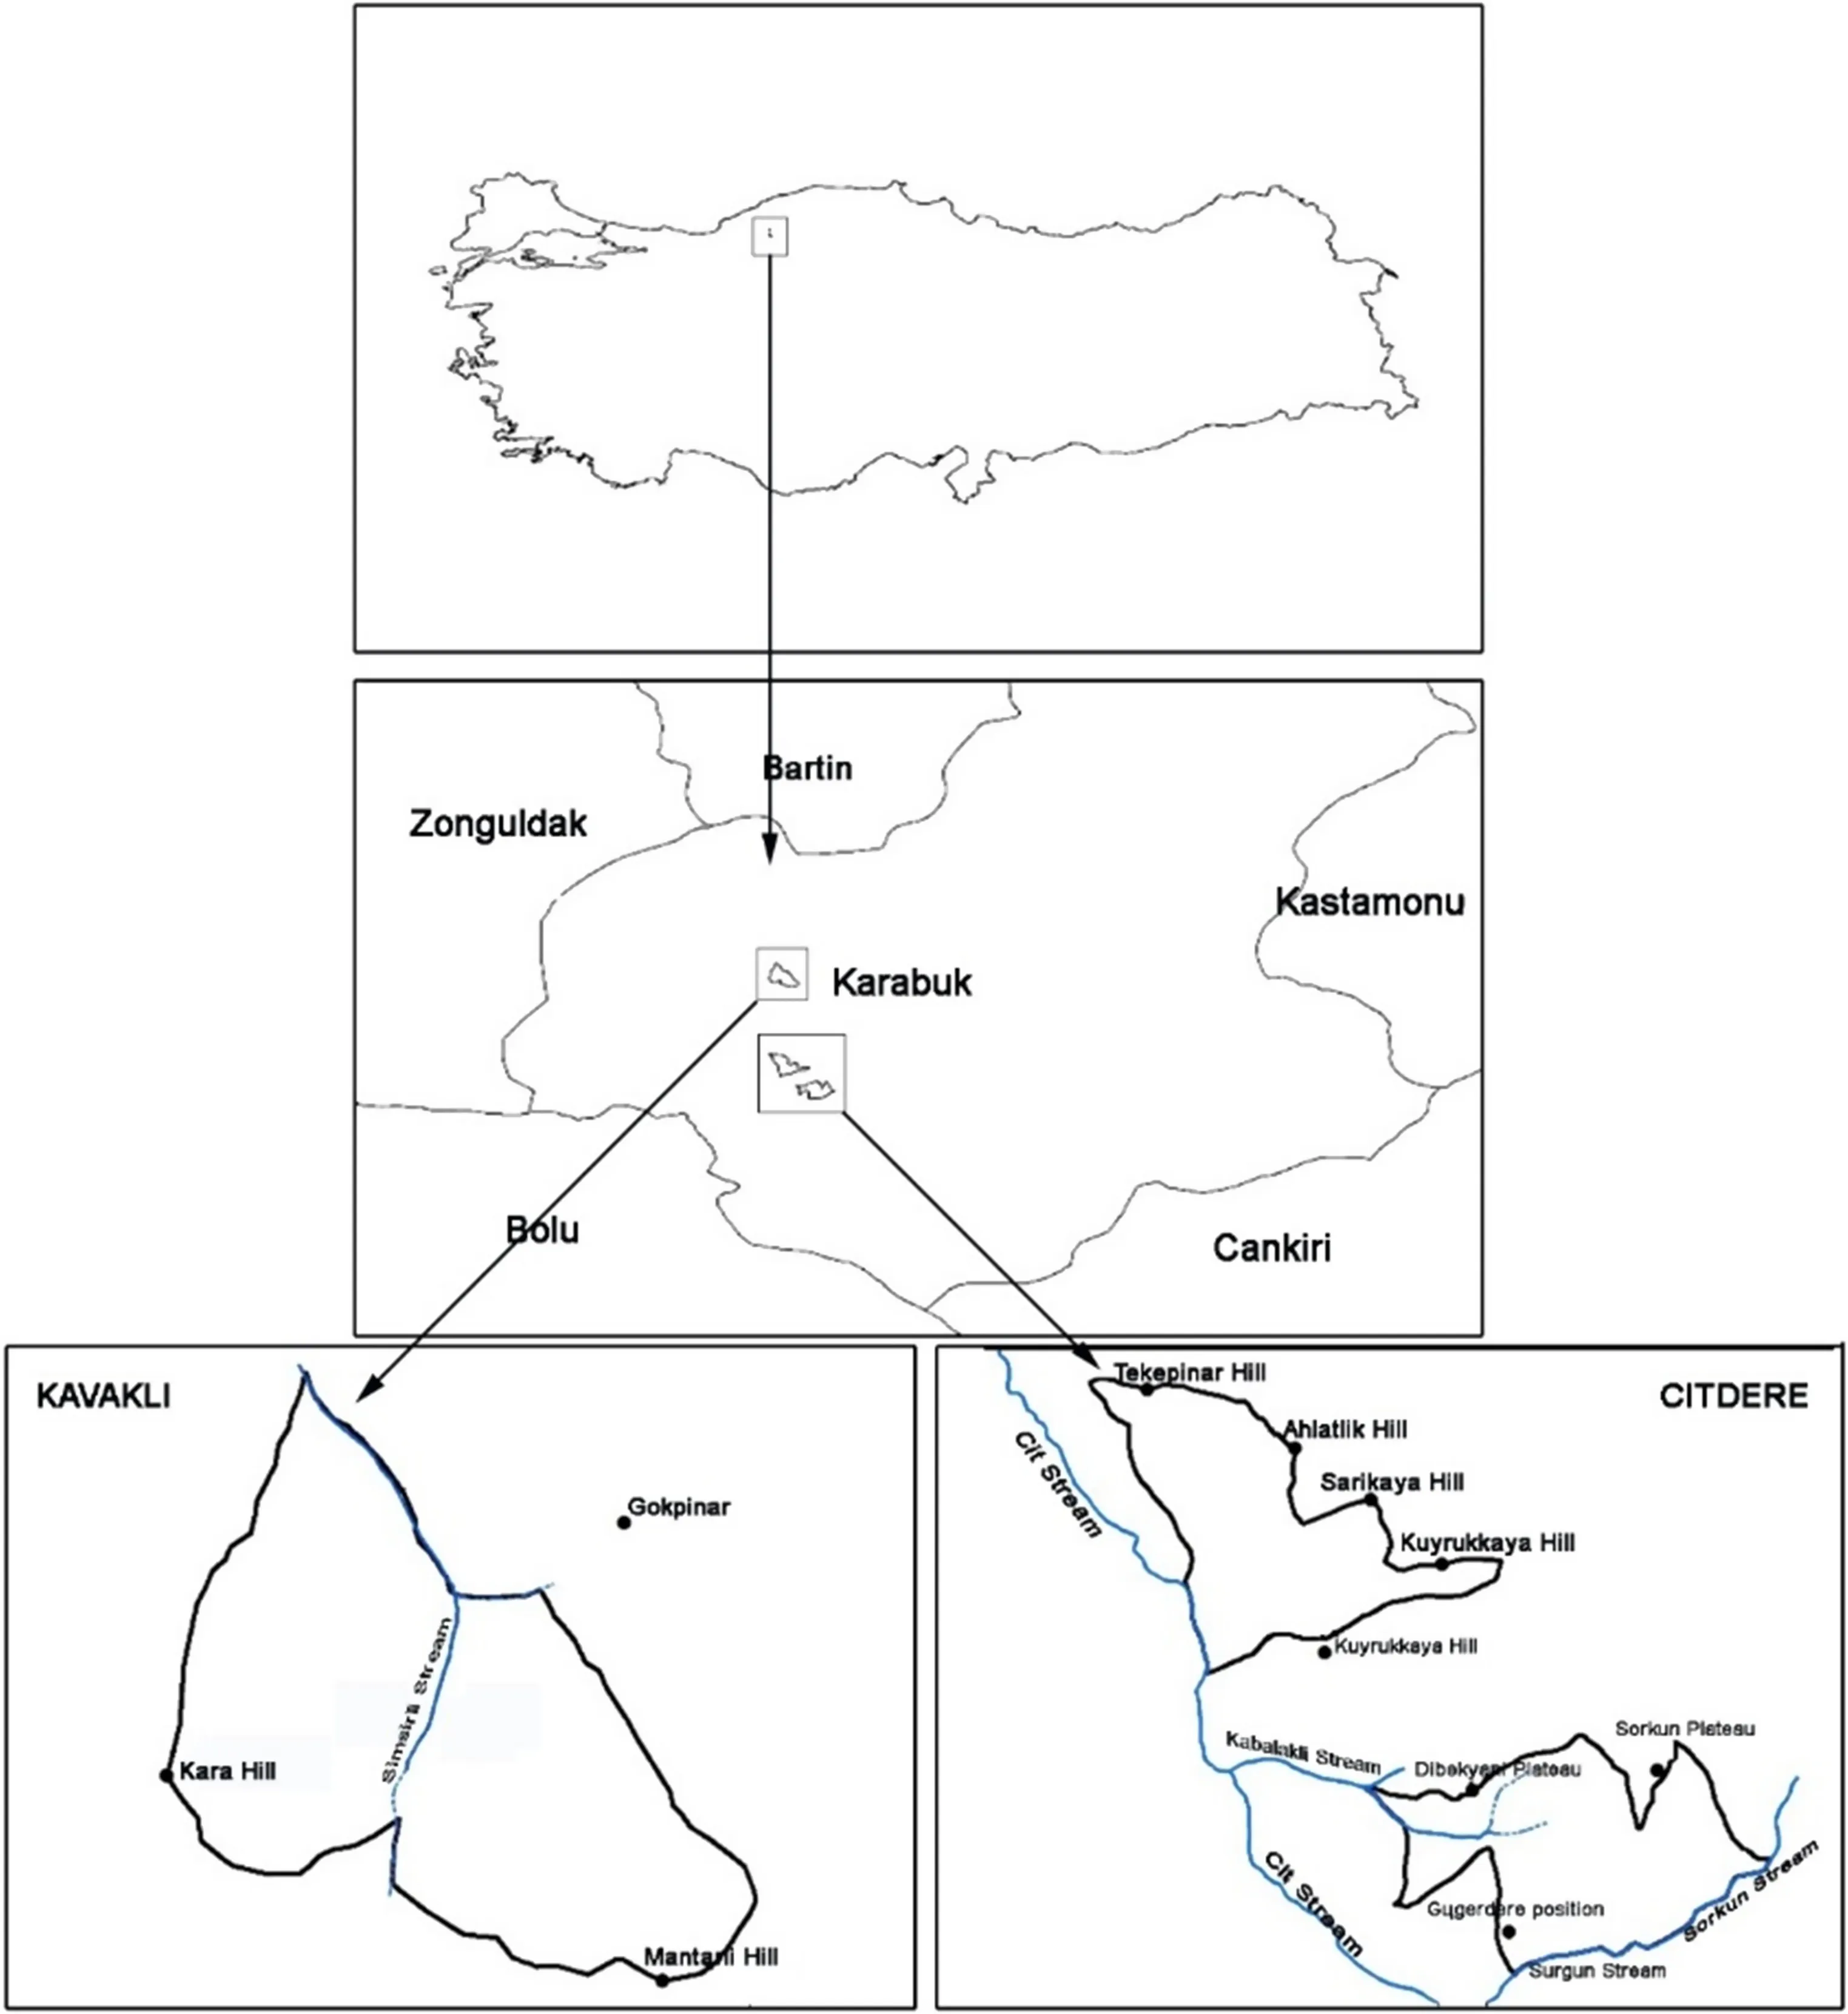
Fig.1 Location of study area
The Simpson index of the concentration of dominance is used to quantify the biodiversity of a habitat(Rashid et al.2000)and was calculated in Eq.4.

where D is Simpson’s biodiversity index,pi is the proportion of individuals of species I,and S is the total number of recorded species.
Beta(β)diversity index
Beta(β)diversity was used to index the differences in species diversity of two or more regions or ecosystems and compares species similarities.Beta diversity was calculated as shown in Eq.5.

where S is the total number of recorded species,and α is mean species richness(Whittaker 1977).
Soil analysis
A total of 24 soil samples were taken from our two study areas(Kavaklı and C¸itdere Nature Reserves Areas)for analysis.Soil samples were taken from horizon A at a depth of 55–65 cm where there were the dense roots of dominant trees.Soil samples were air-dried,crushed and sieved through a 2-mm mesh in preparation for analysis.Moisture,pH,EC(electric conductivity),Na,Mg,Ca,available P,CEC(Cation exchange capacity),NH4,NO3and organic matter were quanti fied.Both the soil pH and EC were measured in a 1:2.5 soil/water extract(Richards 1969)using 20 g of soil in 50 mL of distilled water and shaken on a horizontal shaker for 15 min.The soil solutions were transferred to 100 mL beakers and left to stand for 15 min.A conductometer electrode was then soaked inthe clear upper phase and electrical conductivity(EC)was recorded once the reading had stabilized.The macro elements Mg,Ca,K and Na were determined using the 1 N ammonium acetate(NH4OAc)extraction method via Atomic Absorption Spectrophotometry(AAS).The Modified Walkley–Black method was used to quantify organic matter(Walkley and Black 1934).The method proposed by Olsen et al.(1954)was used to determine the available phosphorus.The ammonium and nitrate contents in the KCl(Potassium Chloride)-processed soil were determined using the micro-Kjeldhal method(Kacar 2009).
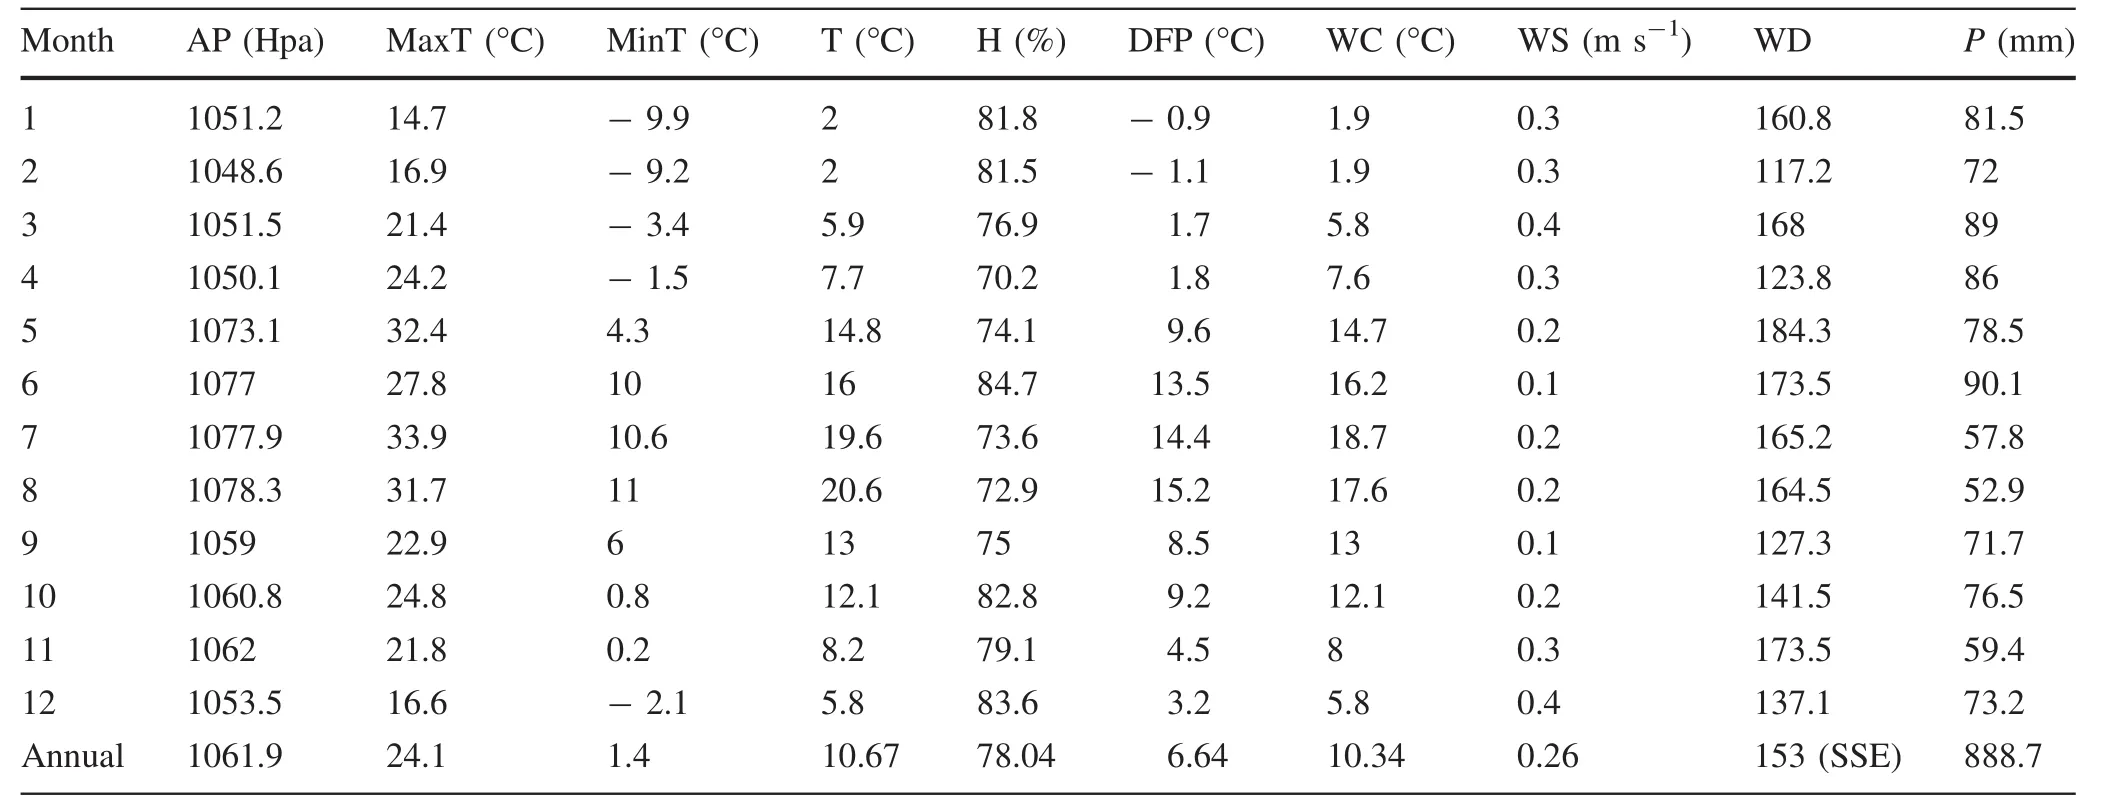
Table 1 Yenice forest area climate data for 2014–2016
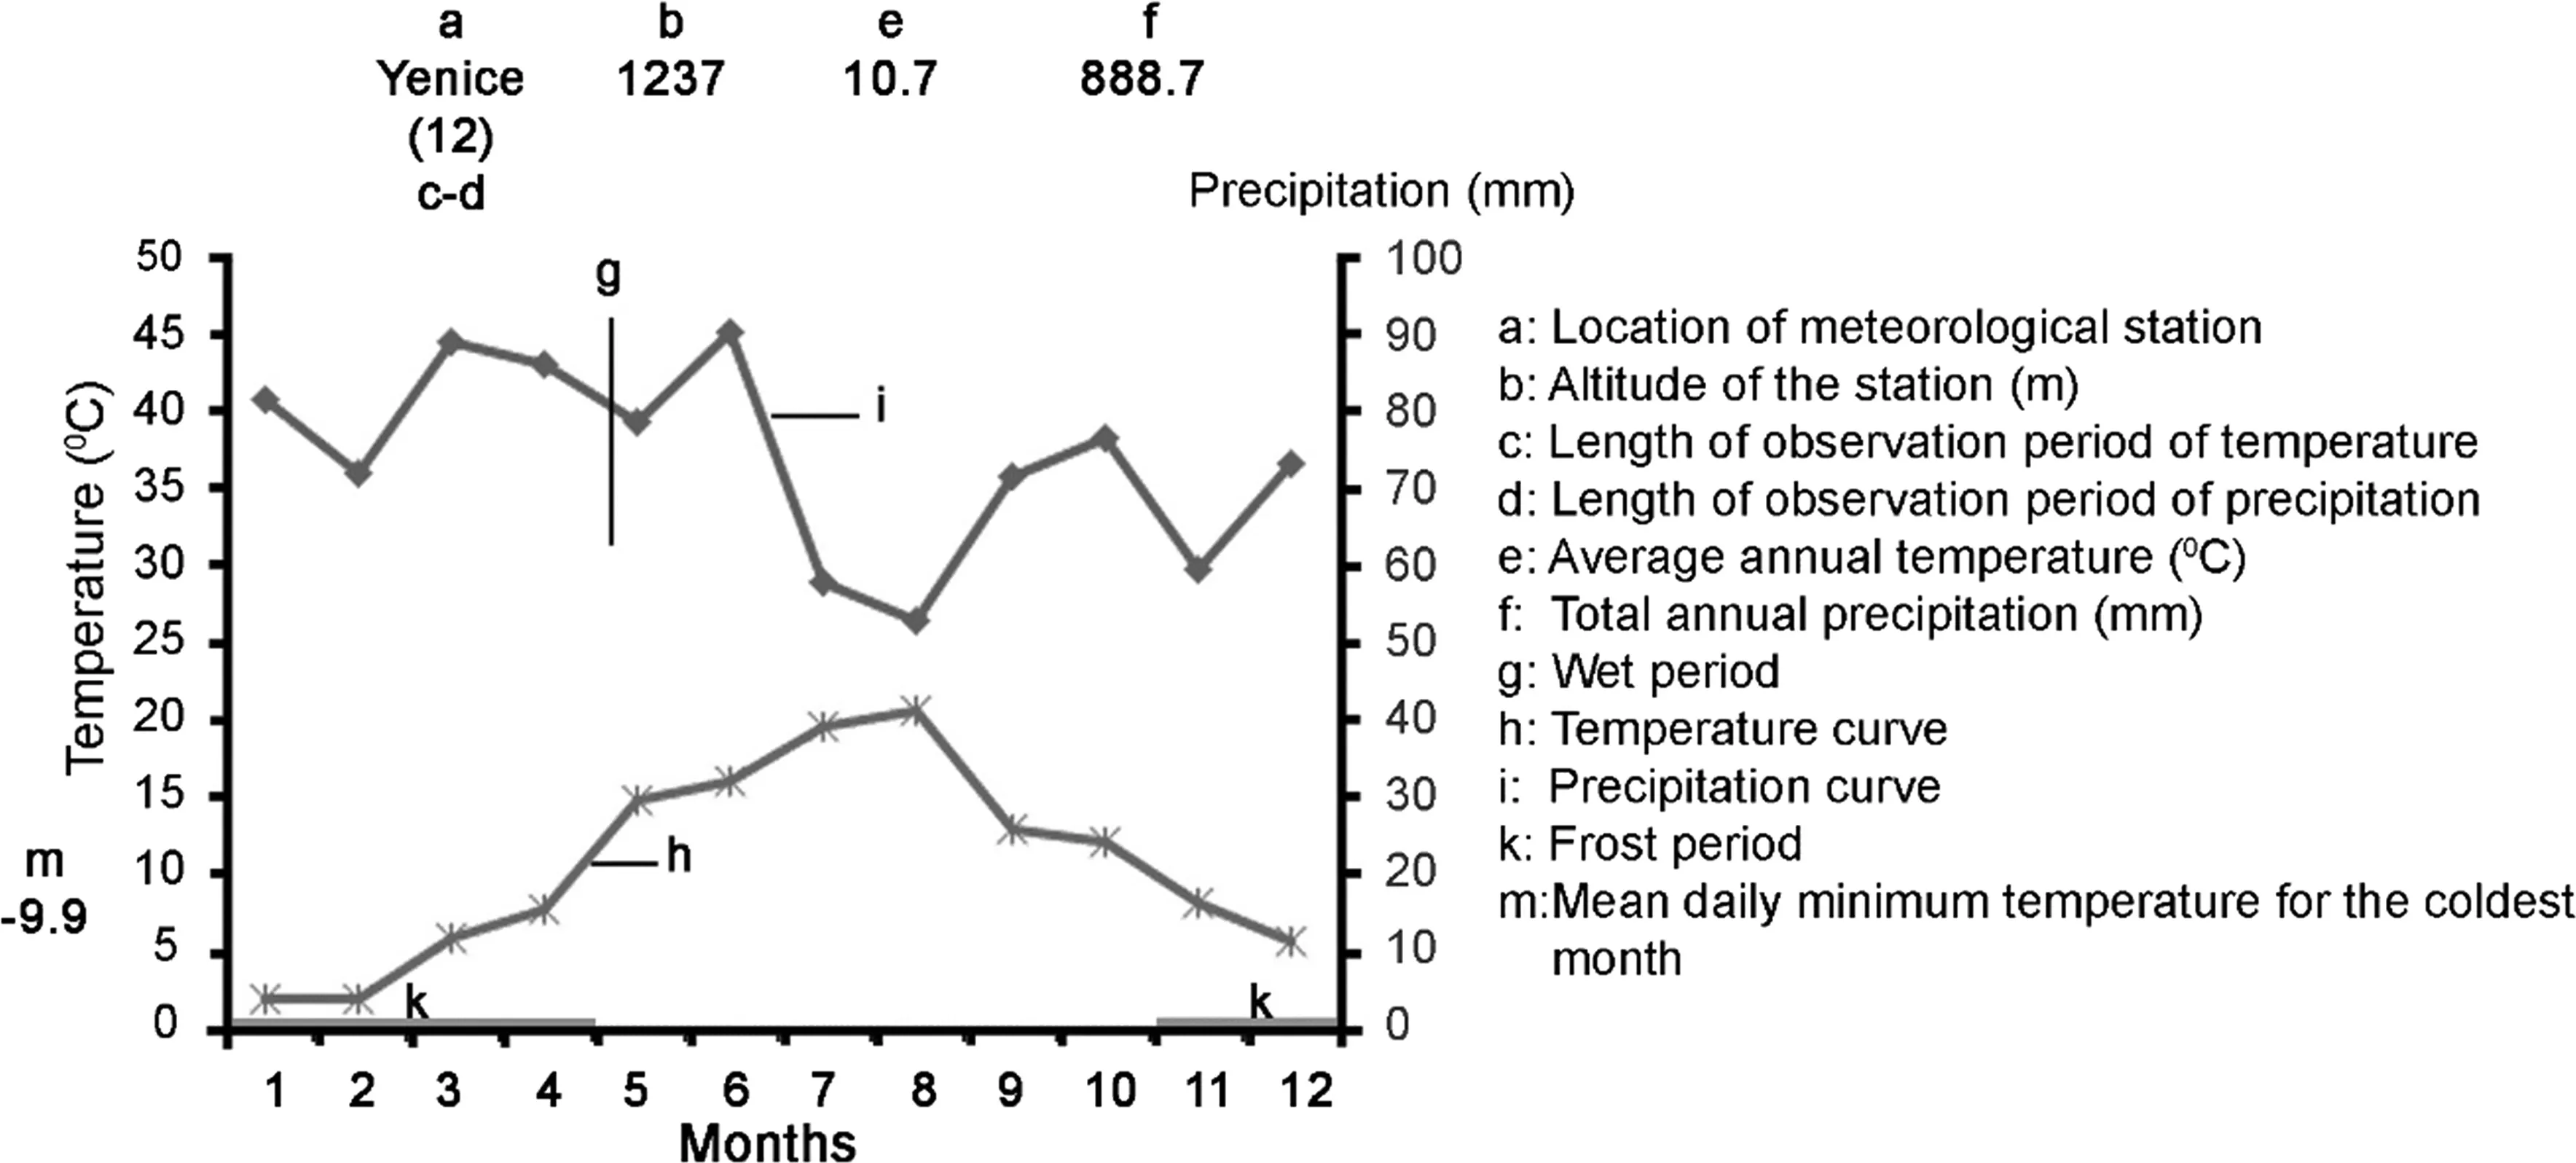
Fig.2 Climatogram of Yenice Forest
Statistical analysis
Vegetation and environmental data were analyzed using canonical correspondence analysis(CCA)(ter Braak 1986).PC-ORD software was used for ordination analyses.SPSS v.22.0 was used to compare means,as well as for correlation analysis between species diversity and ecological parameters.ANOVA was used to compare means for plant data and ecological parameters.Tukey’s separation tests were performed if F-values from the ANOVA were significant at either P<0.05 or P<0.01 level.
Results
A total of 207 species and sub-specific taxa were identified in the protected areas of Yenice Forest.Thirty-one of these taxa were trees,10 were shrub forms,and 166 were herbaceous forms.The diversity index values of different successional layers(tree,shrub and herb)in each protected area were identified(Figs.3,4).The diversity varied according to the number of species in the different forest communities(Figs.5,6).
Beta diversity varied by elevation in the Kavaklı and C¸itdere areas(P<0.05)(Table 2)and the numbers of species declined with increasing elevation.Fagus-Abies mixed forest areas had the highest species number(156)among the different forest layers at Kavaklı and Fagus-Taxus forest had the fewest species(76).In both protected areas,the number of species declined with increasing elevation and beta diversity(Fig.7).
According to the species diversity index and the correlation results of the ecological characteristics,the species diversity in Kavaklı forests shows a positive correlation with slope,nitrate content and K amounts and a negative correlation with aspect(transformed).At the same time,the number of species and the aspect,and the nitrate amount and pH show a positive correlation.In the C¸itdere forests,diversity shows a negative correlation with slope and a positive correlation with aspect.The number of species shows a negative correlation with slope (Table 3).According to these results,the diversity index decreases in places where the slope increases and at a southwesterly aspect.
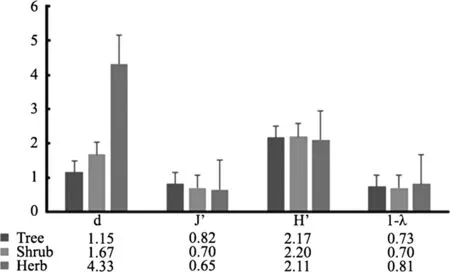
Fig.3 Diversity index graph for tree,shrub and herb layer in Kavakli Nature Protection Area(d:Margalef index;J′:Evenness index;H′:Shannon–Wiener index;1- λ:Simpson index)
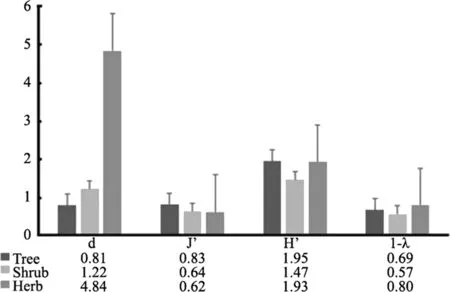
Fig.4 Diversity index graph for tree,shrub and herb layer in C¸itdere Nature Protection Area(d:Margalef index;J′:Evenness index;H′:Shannon–Wiener index;1- λ:Simpson index)
In respect of forest type,aspect,elevation and slope,the differences between the Kavaklı and C¸itdere Nature Reserves were significant(P<0.01 and P<0.001)for different forest types;the difference in soil moisture content,Mg++and Na+values are due to pure Fagus orientalis forest areas in the Kavaklı Reserves.In these areas,the soil moisture is lowest,whereas Mg++and Na+content is the highest.In Fagus-Abies mixed forests,pH values are highest,while available P is at the highest contents in Fagus-Carpinus mixed forests.The reason for the difference in NH4+,pH,Ca++and K+ion contents is due to the northerly aspects where they are at the highest concentrations.pH is highest(near neutral)at an elevation of 1.400 m and soil moisture content and Mg++contents are highest at 1.000 m.The pH value,NH4+,NO3-and Ca++contents are highest on slopes(9–17%)and Mg++ion contents are highest in areas that are slightly steep(17–36%)(Table 4).
In C¸itdere Nature Reserves,pH,EC and organic matter show significant differences between different forest types and these differences are due to pure Quercus forest areas.In Quercus forests,pH and organic matter amounts are at their lowest and electrical conductivity is at its highest.NO3-,Ca++,K+and CEC values were significantly different in Quercus-Fagus mixed forests and the moisture content of the soil is highest in Fagus-Abies forests.NH4+contents were highest at southerly aspects,NO3-was highest at northwestenly aspects and Ca++and Na+amounts were highest at easterly aspects.Available P is highest at an elevation of 1.250 m,while NO3-,K+,Na+and CEC values are highest at 1.450 m elevations.With regard to slope,NO3-is at its highest contents in areas that are slightly steep and Ca++is at its highest contents on very steep slopes(Table 5).
According to canonical correlation analysis,the eigenvalues of four canonical axes are restricted by environmental variables and the first two axes explain 53.7%of the total variance.The gradient lengths of soil variables in ordination space are shown in Table 6.
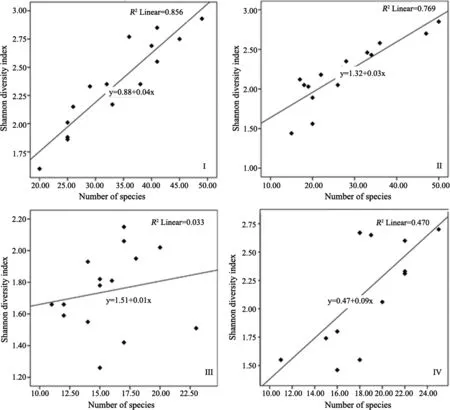
Fig.5 The variation of Shannon–Wiener diversity index values as to the number of species for different forest communities(I:Fagus-Abies Forest;II:Fagus-Carpinus Forest;III:Fagus Forest;IV:Fagus-Taxus Forest)in Kavakli Nature Protection Area
The species-environment correlations of the Kavaklı area showed that the available NO3-in the soil is 0.77 and Ca++is-0.523 and both are identified as important factors for the formation of areas and species(Fig.8).The species-environment correlations of the C¸itdere area showed that the available NO3-,pH,organic matter,Ca and K were important factors for the formation of areas and species(Fig.9).
Discussion
The species diversity and correlations of the ecological characteristics between different forest communities were examined in two nature protection areas in Yenice Forest.In general,in the beech and mixed beech forests in the Kavaklı area,species diversity and species richness increased with increasing slope and decreased in southerly aspects.In the oak and mixed oak forests of the C¸itdere area,species diversity and richness decreased with increasing slope.This shows that variations in the different species in these areas can cause variations in the mechanisms of ecological processes.
The balance between nitrogen providers and biological nitrogen demand is controlled by the separation of NO3-and cations(Tamm 1991).A high NO3-concentration in a soil solution under a root zone is generally accepted as an indicator of a high NO3-demand by plants(Gundersen et al.1998).In the context of this study,the most important ecological factor influencing the distribution of plants in the areas was the amount of nitrate.This was especially true of the C¸itdere Nature Reserves where a significant difference was found in nitrate concentrations and the Quercus-Fagus forest was responsible for this difference.In general,only NH4and NO3are accepted as nitrogen sources and the availability of these two forms is important for species distribution(Nordin et al.2001).In our study,NH4and NO3amounts were also estimated to identify available NO3amounts.
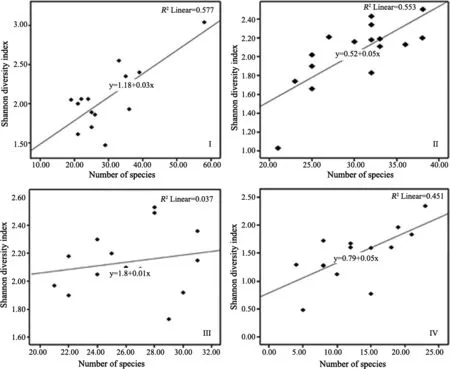
Fig.6 The variation of Shannon–Wiener diversity index values as to the number of species for different forest communities(I:Quercus-Fagus Forest;Community II:Quercus Forest;Community III:Quercus-Carpinus Forest;Community IV:Abies-Fagus Forest)in C¸itdere Nature Protection Area

Table 2 Results of Beta(β)diversity index according to elevation gradient in the Kavakli and C¸itdere areas
Soil moisture supports nitrogen mineralization by affecting microbial activity.According to Singer and Donald(1999),the soil moisture level that is suitable for plant growth is also suitable for microbial activity.In this study,the variations in soil moisture were due to variations in forest layers.Soil moisture was lowest in the areas with pure Fagus orientalis communities in the Kavaklı area.In the C¸itdere Nature Reserves,soil moisture was identified to be highest in Fagus-Abies forests.Compared to conifers,Fagus species have their roots in deeper soil and,thus,more water can be absorbed from lower layers.In addition,and especially in summer,high transpiration rates decrease the soil moisture in these stands(Augusto et al.2002).
In both study areas,pH values are near neutral and these values are within a suitable pH range for establishing necessary interactions for nutrient absorption(Abourouh and Najim 1990).In this study,the lowest level of organic matter content was found in the pure Quercus forest in the C¸itdere area.In this forest,pH values were determined to be the lowest(weakly acidic).In oak forest,the top soil layer is more acidic because oak leaves include tannin and their roots include tannic acid and this acid is washed from the top soil by rain together with metallic cations(Ca++,Mg++,Fe++etc.),forming chelate or protective colloid and causing the loss of these buffering cations(Karaöz 1988).In the Kavaklı area,Fagus-Abies forest that has near neutral pH is the cause of a significant difference in pH values.
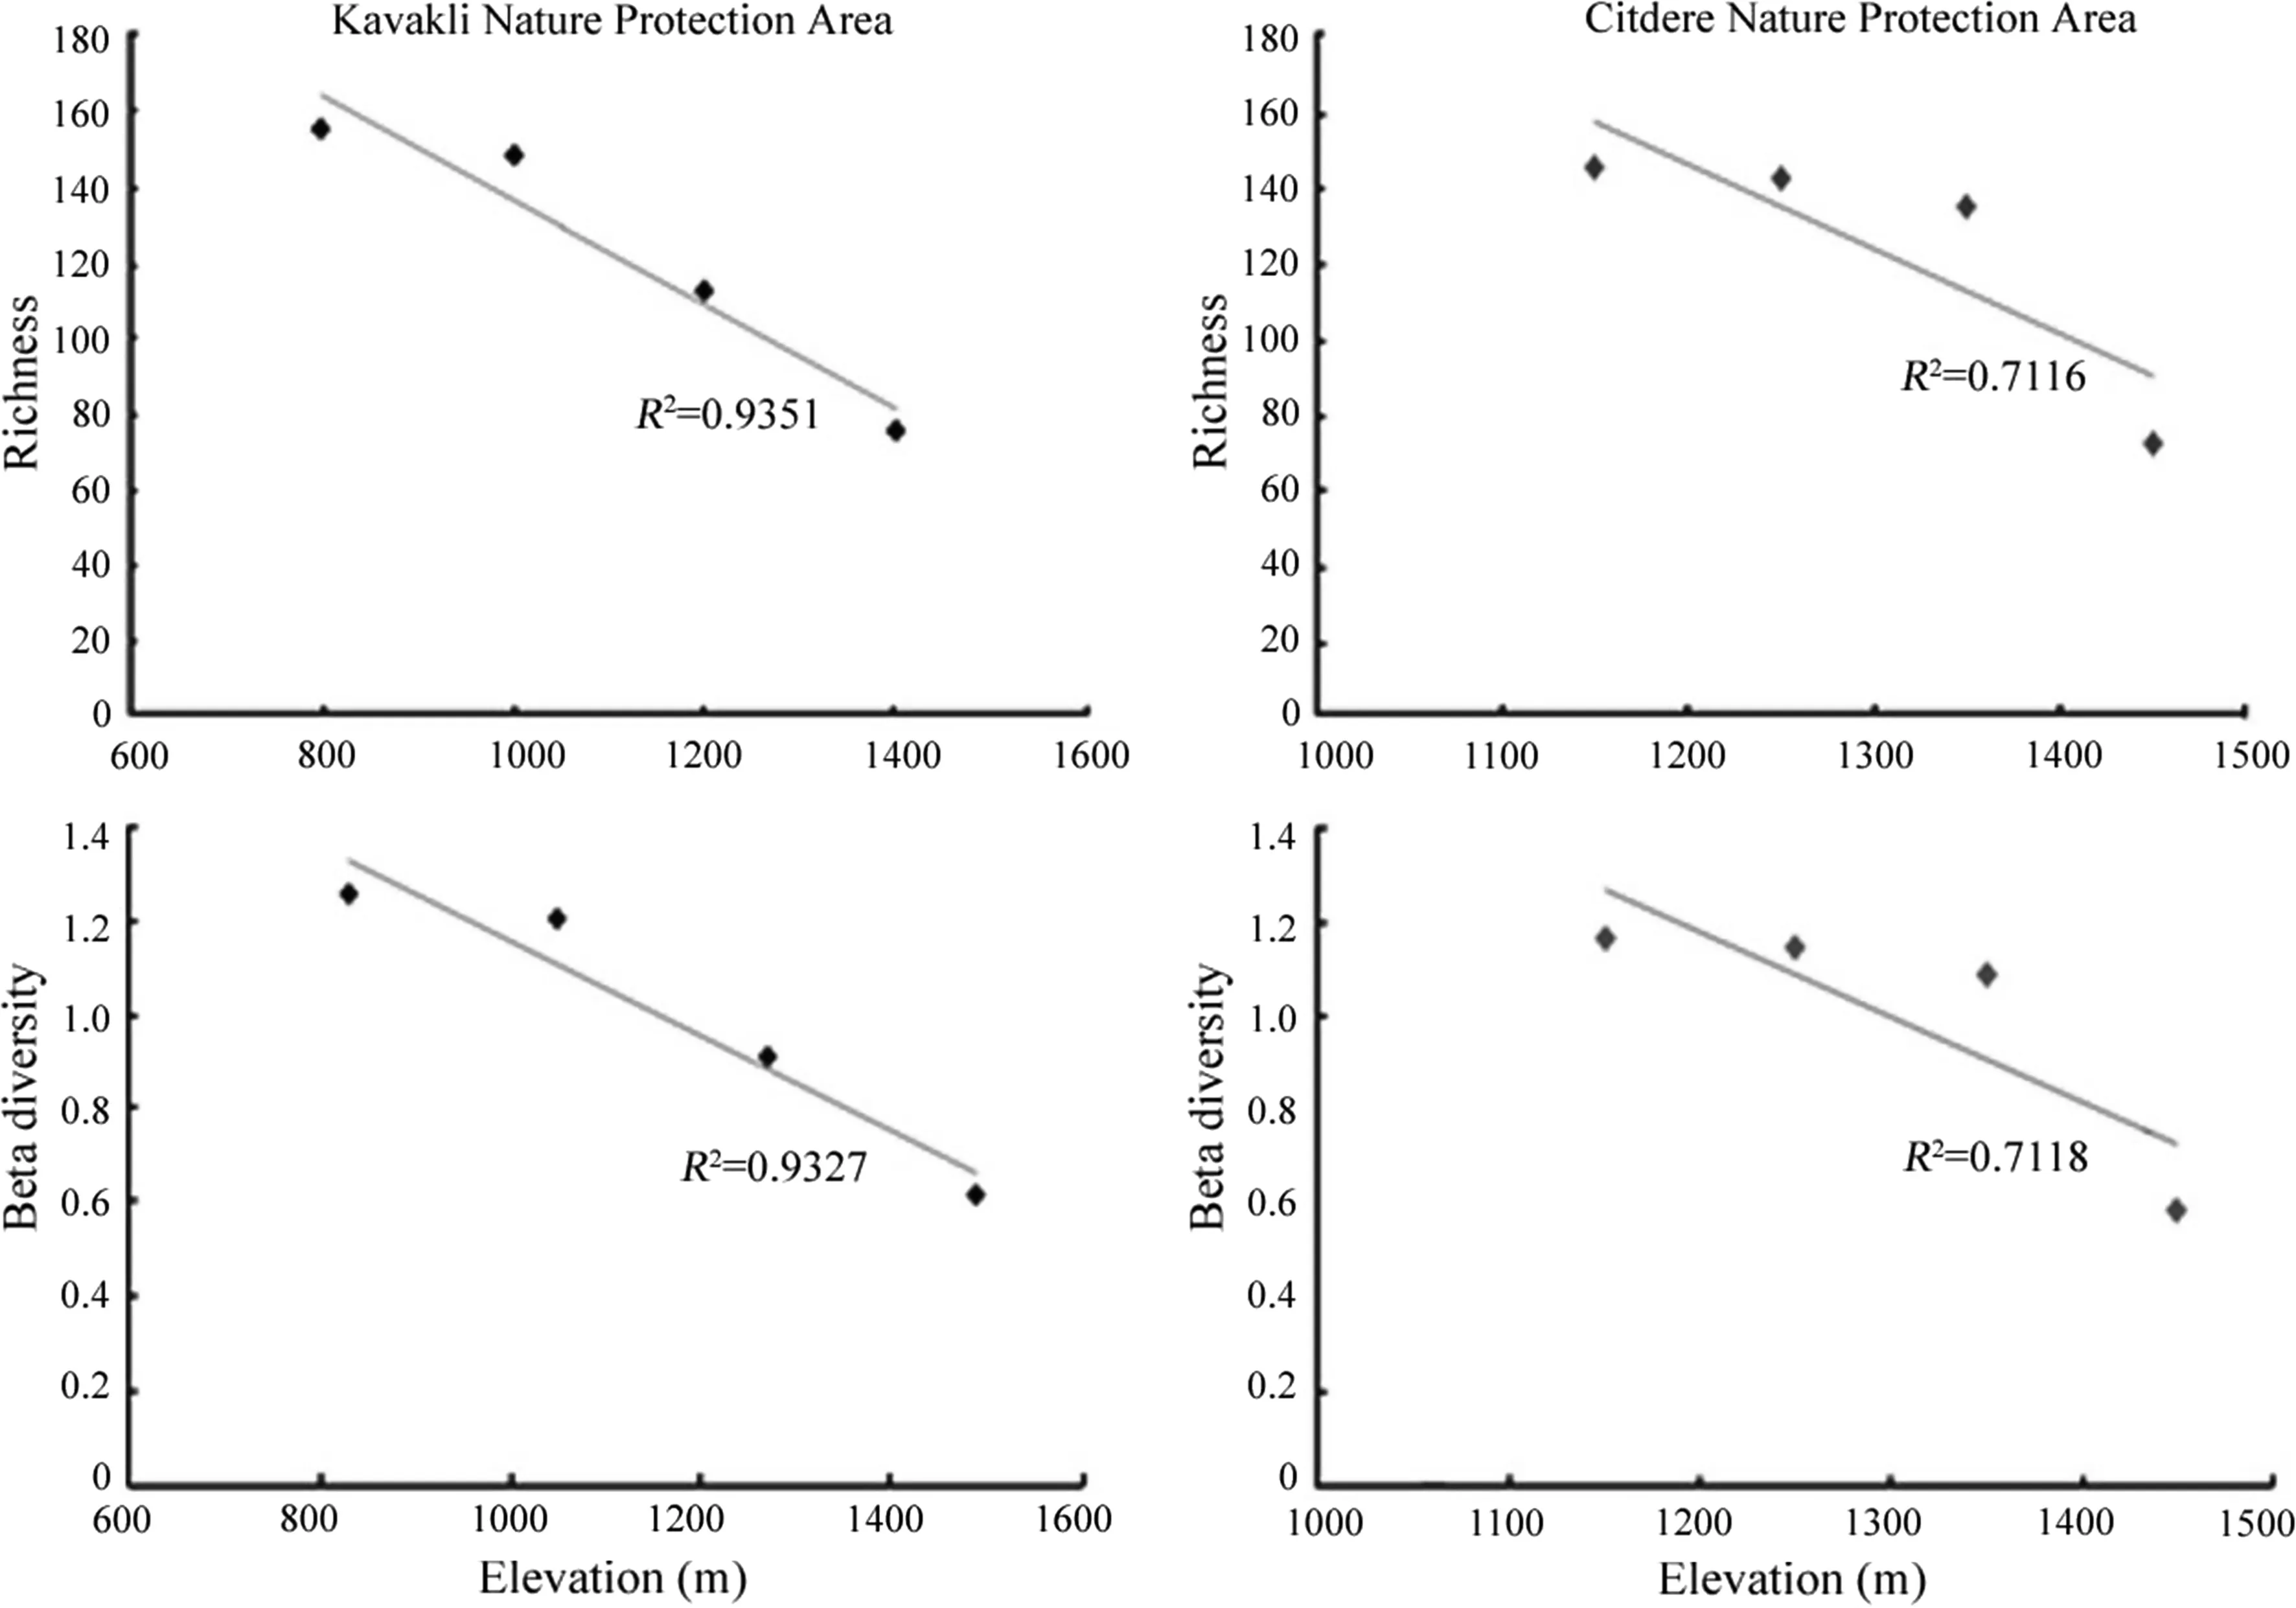
Fig.7 Number of species(Richness),beta diversity and elevation gradient in Kavakli and C¸itdere Nature Protection Areas

Table 3 Pearson correlation results between diversity index values and some ecological characteristics in the Kavakli and C¸itdere Nature Conservation area
Augusto et al.(2002)stated that the acidifying ability of Fagus sylvatica and Quercus species is higher than other deciduous species in the temperate forests of Europe.Trees are capable of changing the acidity and the cation exchange capacity of soil by Ca++and Mg++ions in their litter(Noble and Randall 1999;Reich et al.2005).Similar results were observed in our study areas.Significant differences in the soil chemical content between the communities were caused by nitrate,Ca,K,Na concentrations and CEC,which was highest in the Quercus-Fagus communities.In different plant communities,different leaves cause different litter structure that supports mineralization.
According to species-environmental factor correlations,the most important ecological factors that affect species settlement and distribution in both study areas are the nitrate ions absorbed from the soil,organic matter,Ca++,K+and pH,while nitrate and Ca++concentrations are important cofactors that influence species settlement in the area.
Recent studies have concluded that interspecies difference in nitrogen resource use is a result of niche differentiation for nitrogen use(Chapin et al.1993).In this study,available nitrate ion use varies primarily depending on habitats.Nitrate ion concentrations were identified to behighest in pure deciduous and coniferous mixed communities,along with Quercus-Fagus forests with less inclined areas.This is especially true of the northwestern sections of the C¸itdere area.
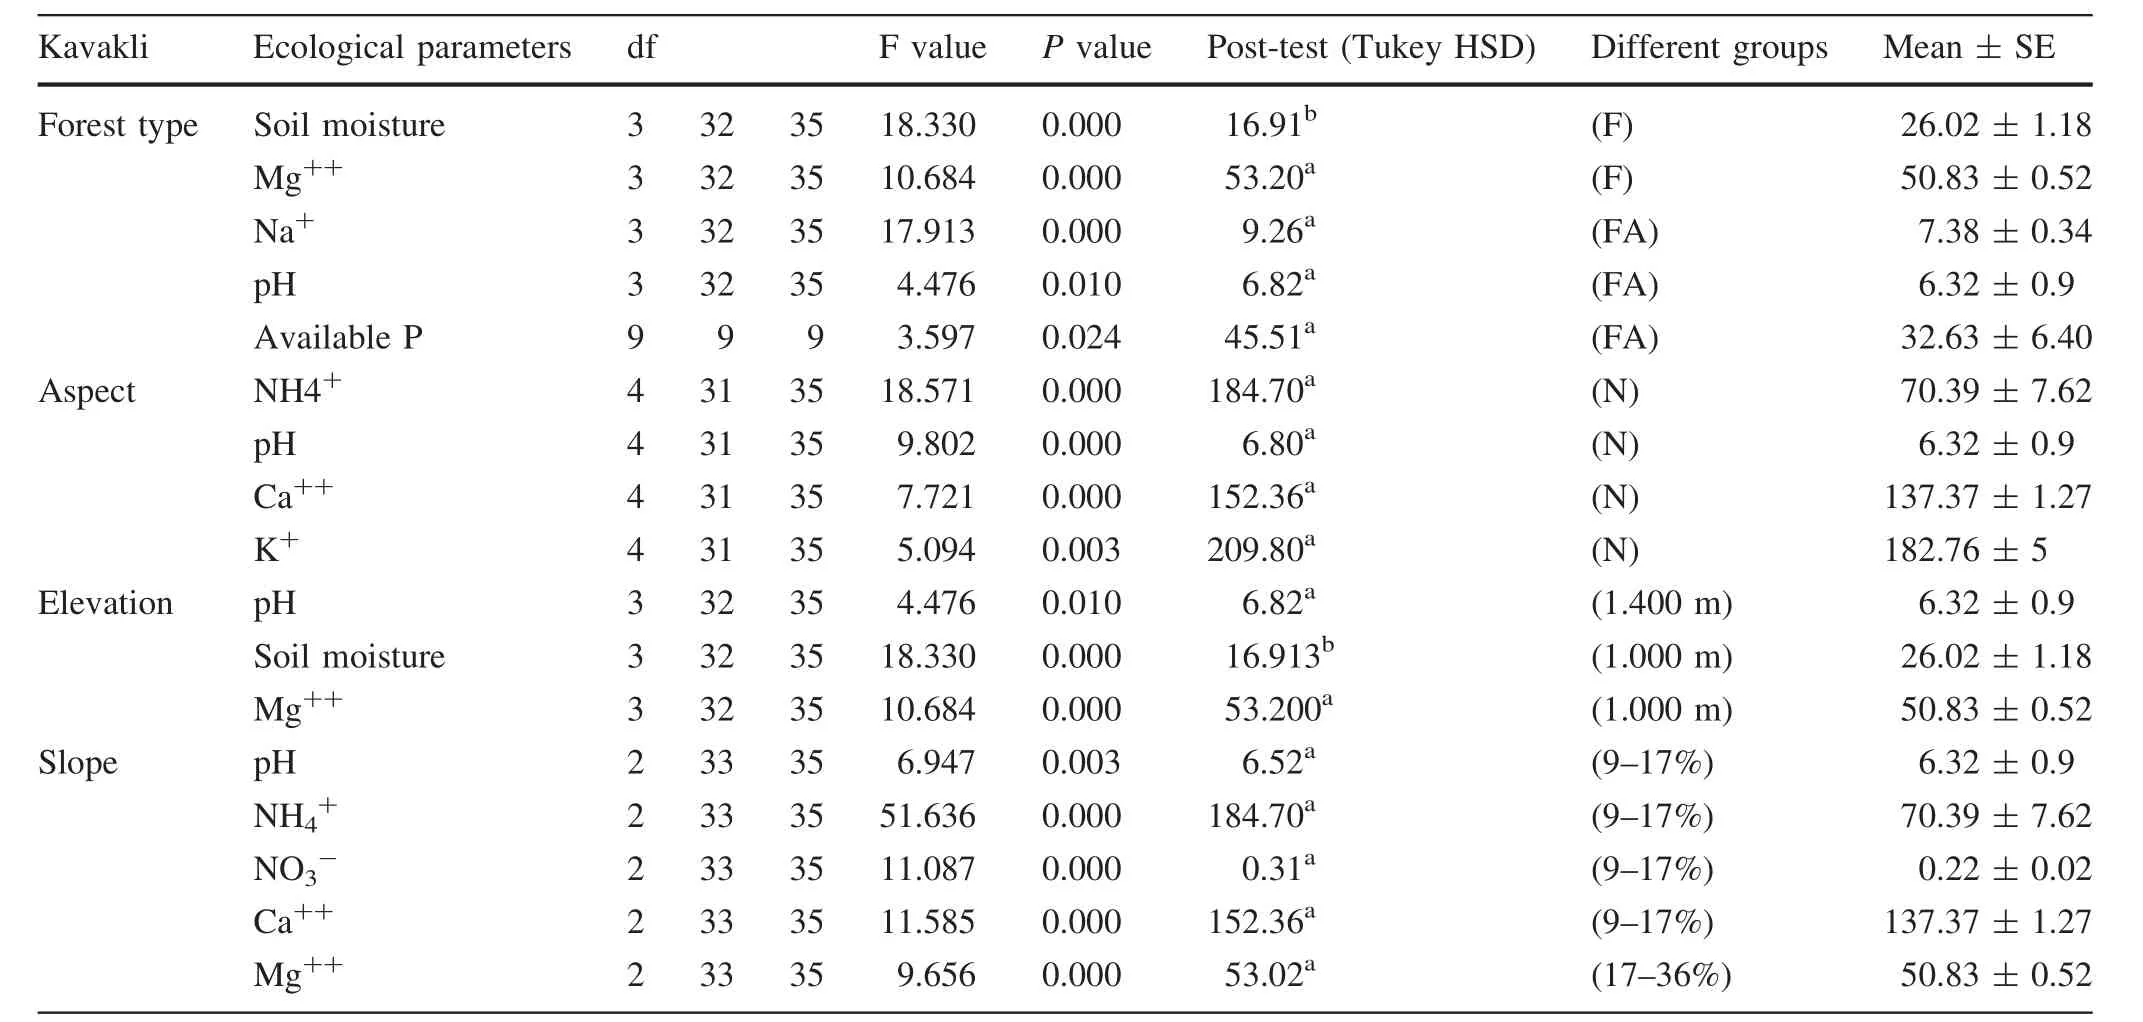
Table 4 The results of forest type(F-Fagus,FA-Fagus-Abies),aspect,elevation and slope of soil parameters according to ANOVA and Tukey test in Kavakli Nature Protection Area
In general,nitrate accumulation in a deciduous forest is fast;net nitrification in coniferous forests is slower.An increase in nitrate concentrations over time is an indicator of well-settled nitrifier populations in deciduous plantations(Ste-Marie and Paré1999).Tree species influence nitrification and it is suggested that some tree species influence nitrification by producing inhibitor compounds(Ahokas 1997;Hobbie 2015).Plants are not able to absorb nitrogen directly from the soil;specifically,conifers,oak,beech,hornbeam,ash tree,linden tree and birch species absorb nitrogen through mycorrhizas(Abourouh and Najim 1990;Franklin et al.2014).Many soil organisms contribute to the process of transforming organic matter into inorganic nitrogen.Therefore,nitrogen mineralization determines productivity and the continuity of ecosystems by affecting nitrogen availability in the soil(Runge 1983).Under natural conditions,the available inorganic nitrogen concentration that can be absorbed by plant roots depends on environmental conditions such as the soil type,climate,latitude,season and microbial activity(Runge 1983).Therefore,nitrogen mineralization in soil and absorption by plants are used as important indicators to determine ecosystem productivity.
High biodiversity,high decomposition and abundance of quality litter,support a high diversity of soil fauna and,therefore,nutrient release is higher in mixed forests compared to pure beech forests(Jacob et al.2009).Further,in our study,higher diversity was found in mixed beech forest areas,as compared to pure beech forest areas.
Conclusion
Different plant groups form different microhabitats have a balancing effect on trophic levels.Despite the fact that it does not present detailed combinations of all forest types,this study is important with regard to nutrient use in old forests,the identification of groups with high species diversity and ecological groups that can be used as references.Organisms in a system coordinate the formation of necessary factors that the system needs by ‘cycle timing’,e.g.,fast or slow decomposition.In this study of forest systems,the number of species increases with an increase in slope and at northern aspects in the Kavaklı Nature Reserves and increases with a decreasing slope in the C¸itdere Nature Reserves.We are able to explain this situation by the differences in forest layers,slope-aspect,soilmoisture depending on forest layers(coniferous forests are more humid than deciduous forests)and the decomposition rates in the Kavaklı and C¸itdere areas.These factors affect the fast or slow decomposition,mineralization level,pH and organic matter content and form the intrinsic factors of these forests.
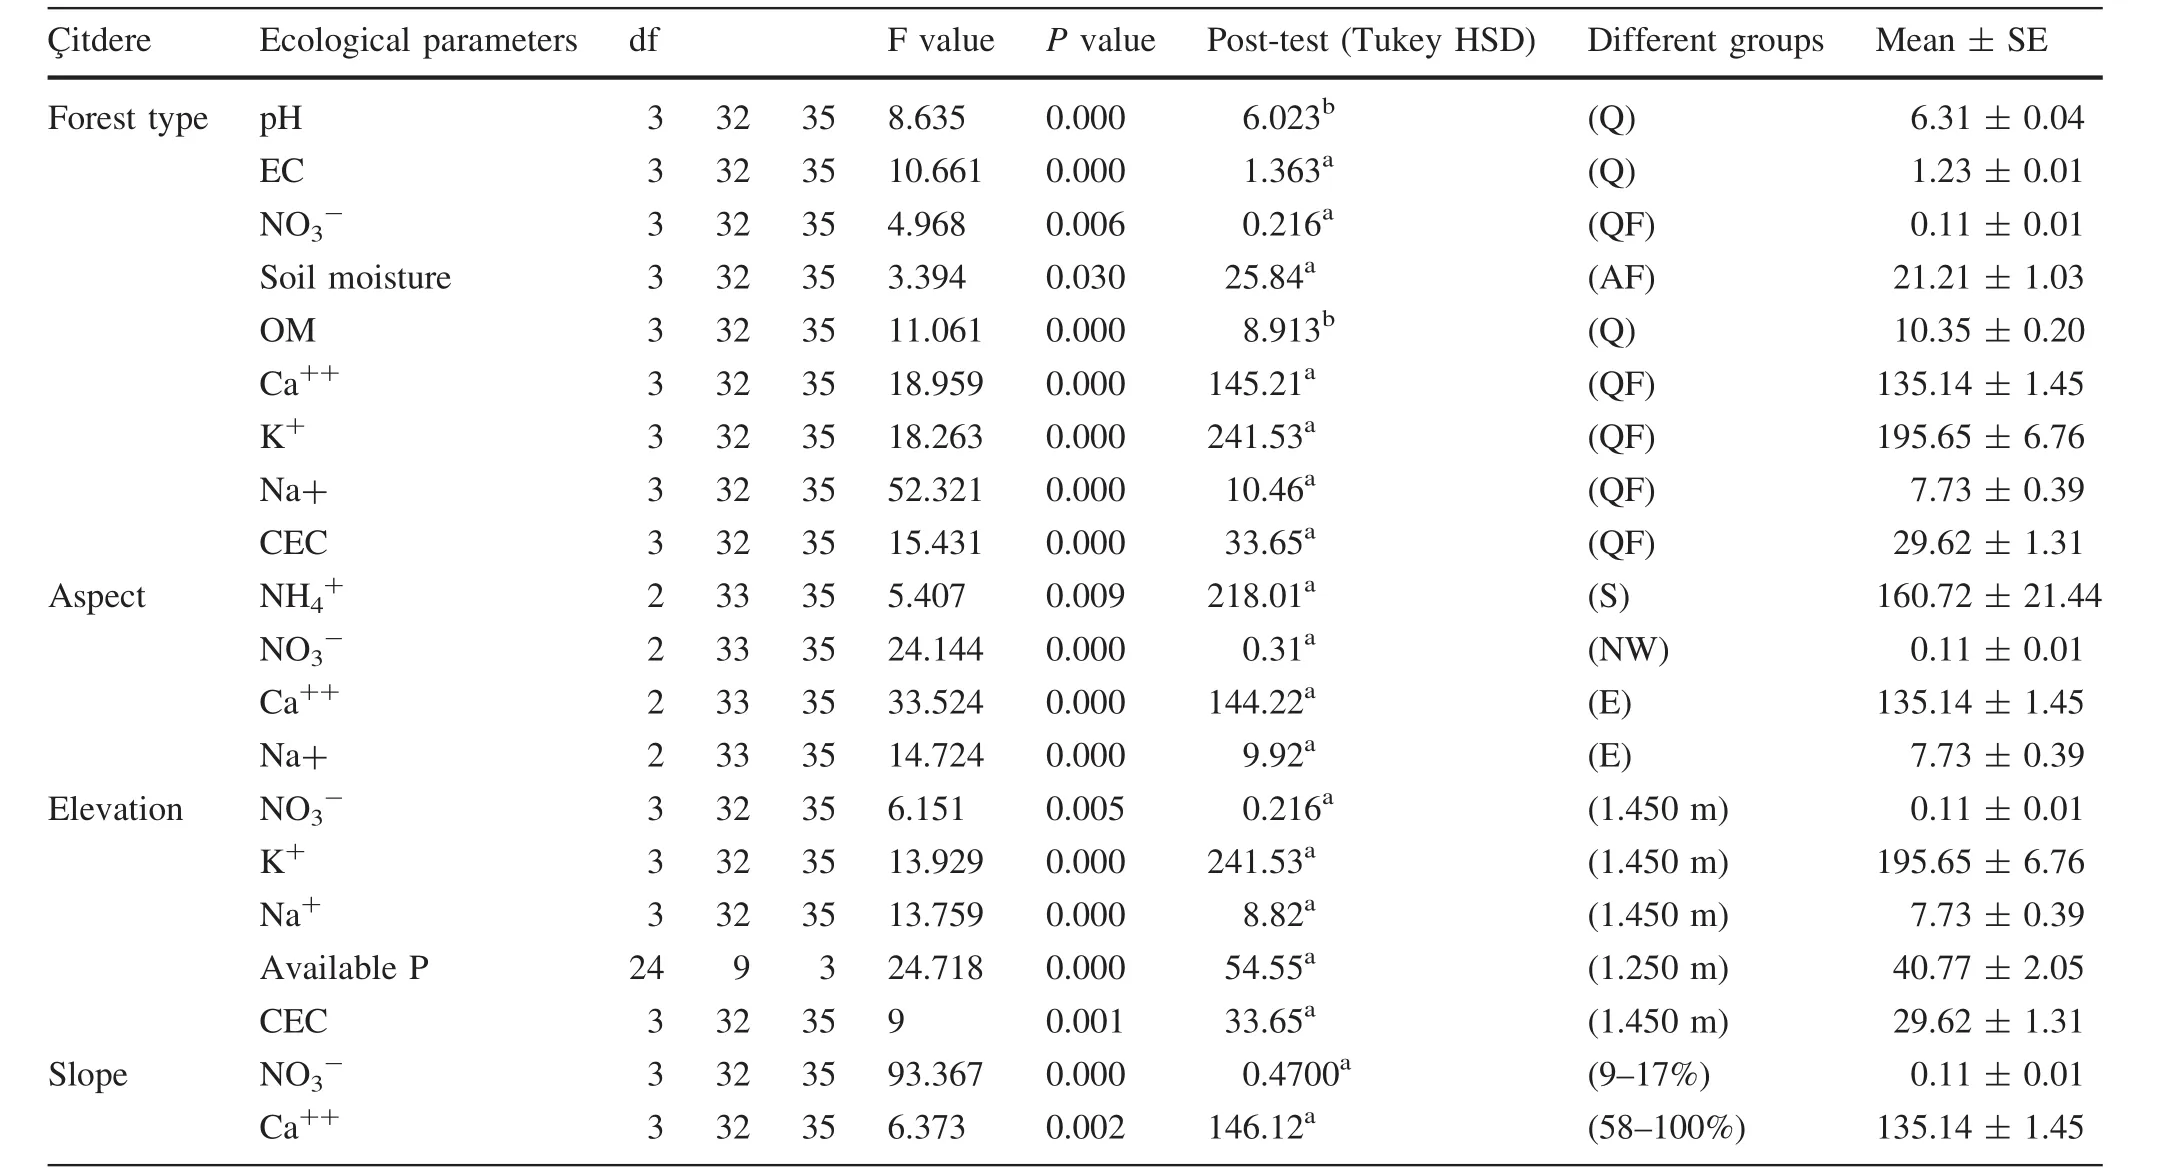
Table 5 The results of forest type(Q-Quercus,QF-Quercus-Fagus,AF-Abies-Fagus),aspect,elevation and slope of soil parameters according to ANOVA and Tukey test in C¸itdere Nature Protection Area
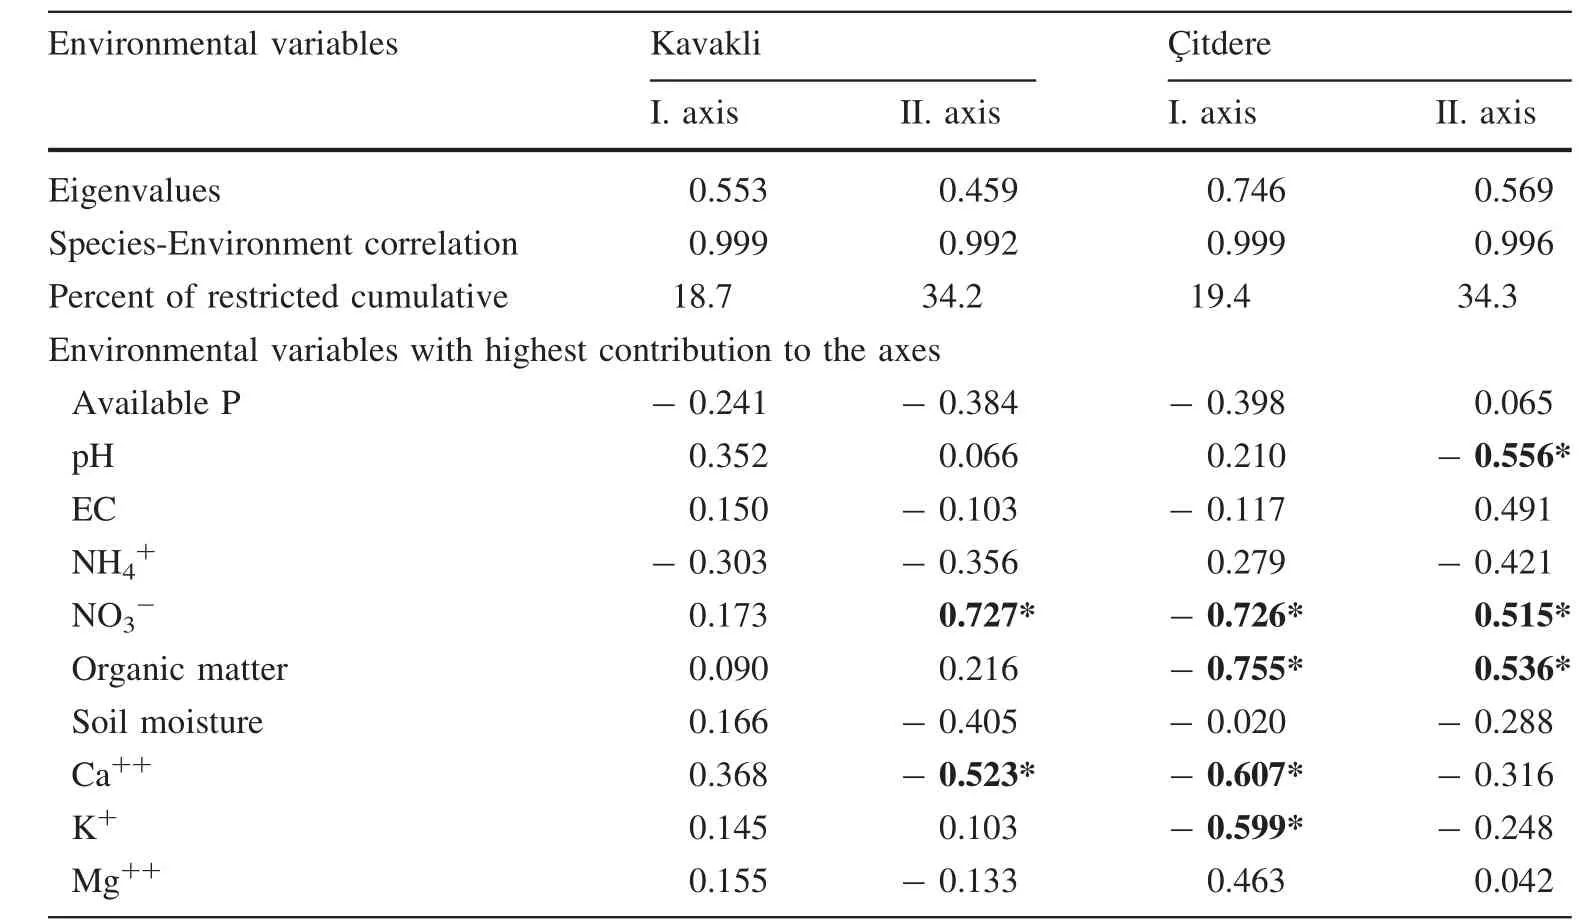
Table 6 Results for the first and second canonical correlation analysis based on plant and environmental data for Kavakli and C¸itdere areas
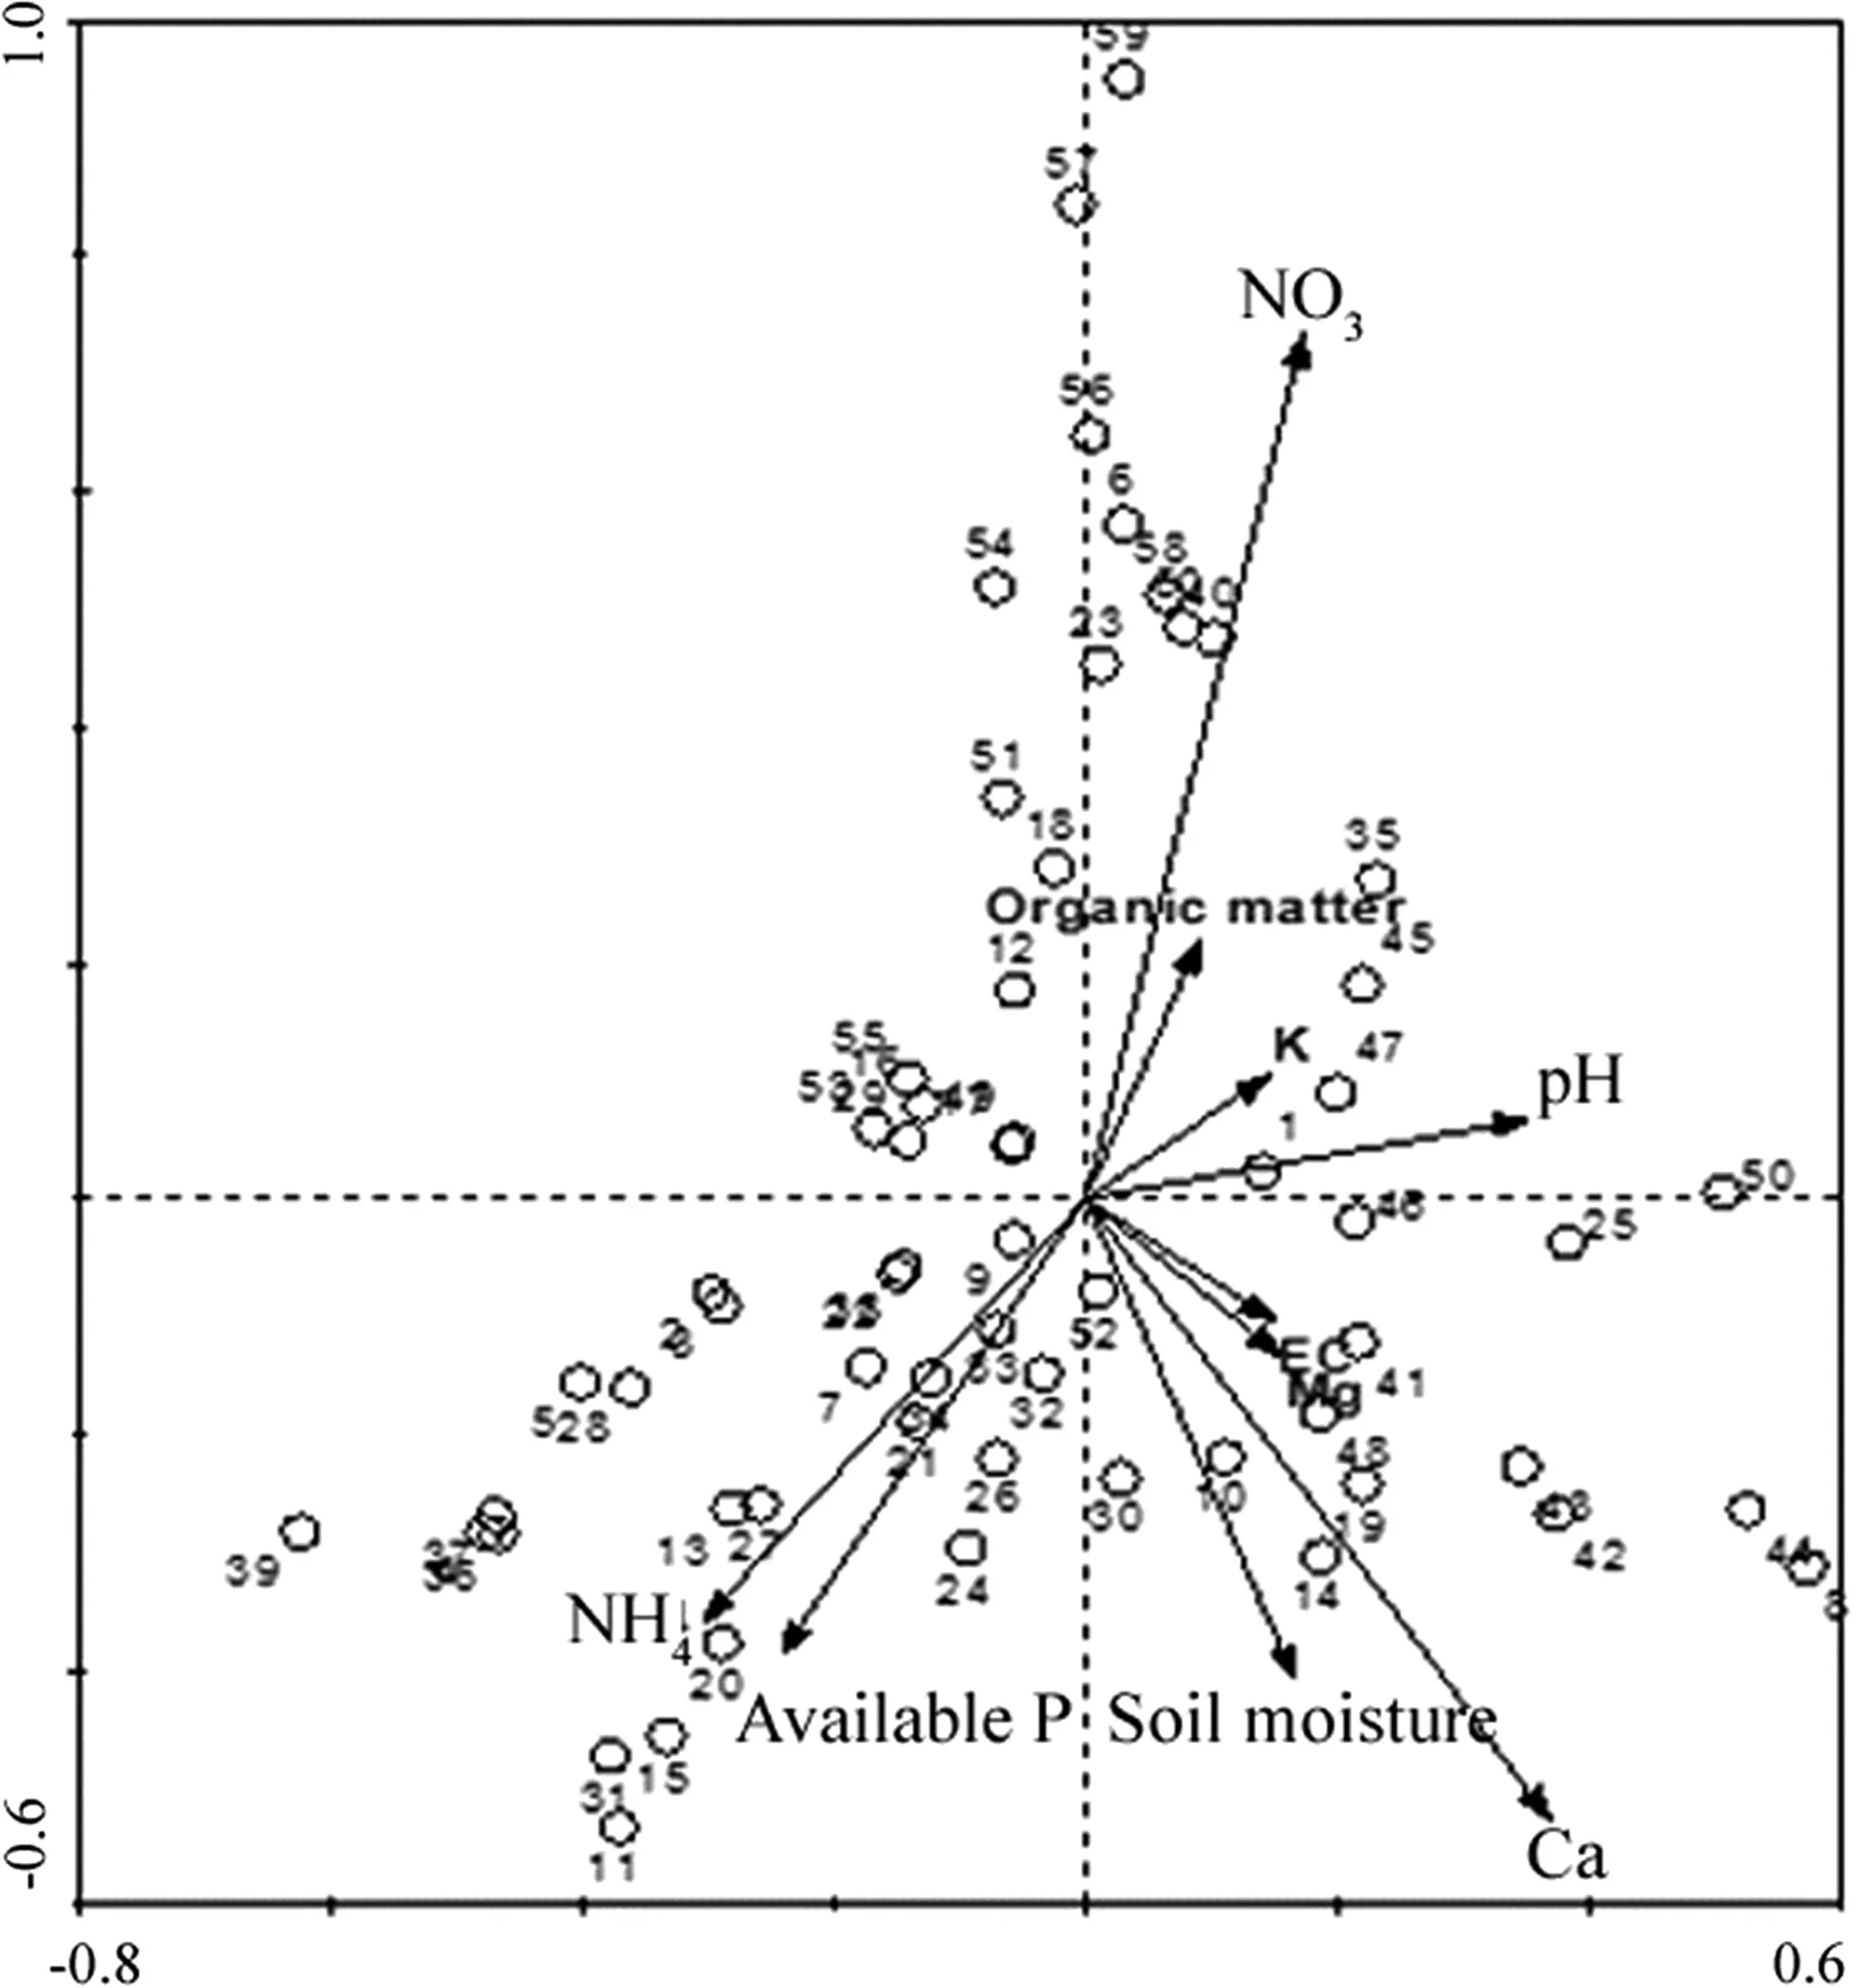
Fig.8 Species and environmental features of ordination in Kavakli area
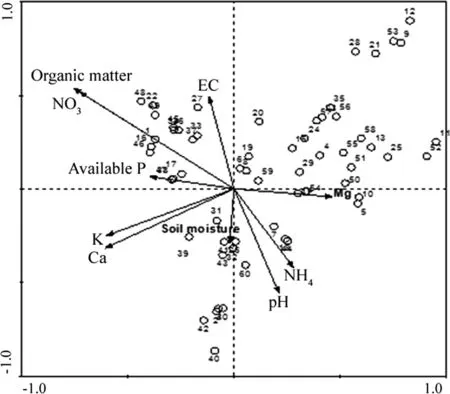
Fig.9 Species and environmental features of ordination in C¸itdere area
 Journal of Forestry Research2018年6期
- Journal of Forestry Research的其它文章
- Black locust(Robinia pseudoacacia L.)as a multi-purpose tree species in Hungary and Romania:a review
- The impact of the environmental factors on the photosynthetic activity of common pine(Pinus sylvestris)in spring and in autumn in the region of Eastern Siberia
- Osmoregulators in Hymenaea courbaril and Hymenaea stigonocarpa under water stress and rehydration
- Effect of nitrogen levels on photosynthetic parameters,morphological and chemical characters of saplings and trees in a temperate forest
- Free amino acid content in trunk,branches and branchlets of Araucaria angustifolia(Araucariaceae)
- Exogenous application of succinic acid enhances tolerance of Larix olgensis seedling to lead stress
