Allometric models for estimating aboveground biomass and carbon in Faidherbia albida and Prosopis africana under agroforestry parklands in drylands of Niger
Massaoudou Moussa•Larwanou Mahamane
Abstract This study developed allometric models to estimate aboveground biomass and carbon of Prosopis africana and Faidherbia albida.The destructive method was used with a sample of 20 trees per species for the two parkland sites.Linear regression with log transformation was used to model aboveground biomass according to dendrometric parameters.Error analysis,including mean absolute percentage of error(MAPE)and root mean square of error(RMSE),was used to select and validate the models for both species.Model 1(biomass according to tree diameter)for P.africana and F.albida were considered more representative.The statistical parameters of these models were R2=0.99,MAPE 0.98%and RMSE 1.75%for P.africana,and R2=0.99,MAPE 1.19%,RMSE 2.37%for F.albida.The average rate of carbon sequestered was significantly different for the two species(P≤0.05).The total amount sequestered per tree averaged 0.17×10⁻³Mg for P.africana and 0.25×10⁻³Mg for F.albida.These results could be used to develop policies that would lead to the sustainable management of these resources in the dry parklands of Niger.
Keywords Aboveground biomass·Agroforestry·Allometric models·Carbon ·Niger·Soudano-sahelian
Introduction
The estimation of aboveground biomass is a topical subject in ecology.It is a parameter indicating functional and structural attributes of forest ecosystems(Chave et al.2005).In the Sahel,it expresses economic,agronomic,and biological productivity as shown in many studies(Cisse 1980;Breman and Kessler 1997;Larwanou et al.2010).In the arid and semi-arid zones of sub-Saharan Africa,woody biomass provides information on soil status and production(Breman and Kessler 1997;Bernoux and Chevallier 2013).Its estimation is essential for the quantification of atmospheric carbon sequestered by vegetation through photosynthesis(Brown 1997;Chave et al.2005;Pearson and Brown 2005).Since the Kyoto Protocol,agroforestry has been identified as a mitigation and adaptation strategy for climate change,and agroforestry systems have attracted particular attention(IPCC 2000).Some studies have demonstrated the sequestration potential of agroforestry systems and their benefits to populations(Nair and Nair 2003;Takimoto et al.2008;Nair et al.2009).Thus,it is necessary in this context to be able to understand the contribution of Sahelian agroforestry parklands in mitigating the effects of climate change,particularly through woody biomass.
The central south of Niger straddles two distinct geographical areas,northern Sudanian dominated by savanna shrub woody vegetation,and the south Sahelian region dominated by Combretaceae and other species typical of the steppes(Sâadou 1990).Due to the advancement of the agricultural front,these formations have been gradually transformed to parklands(Mahamane et al.2007;Issiaka et al.2012).Depending on the predominant woody species,several agroforestry parklands may be recognized,including mixed and specific parklands,and thus play important agro-ecological and economic roles for local populations(Larwamou et al.2006;DraméYayéand Berti 2008).Faidherbia albida(Delile)A.Chev.and Prosopis africana(Guill.&Perr.)Taub are two species of socio-economic and agronomic importance and are widely distributed over the area(Kho et al.2001;Garrity et al.2010;Laouali et al.2014;Weber et al.2015).In south central Niger,F.albida is wide-spread at varying densities in agrosystems,whereas P.africana is mainly located in the Sudanian and northern Sahelian parts(Weber et al.2008;Moussa et al.2015a;Laouali et al.2016).These two species are well-established in the production systems of rural populations in this area.The management of these agroforestry parklands necessarily involves improving knowledge of their main woody species.
In order to determine the woody biomass of ecosystems,two methods most often used are the direct or destructive method,and the indirect method(Pearson and Brown 2005).In most cases the direct method involving the cutting and weighing different parts of the tree has been used in most manuals because it achieves a higher level of precision(Pearson and Brown 2005;Picard et al.2012).Thus,allometric models can be developed linking forest biomass to dendrometric parameters such as diameter,height and width of crowns(Rondeux 1999;Picard et al.2012;Jara et al.2015)or a species intrinsic parameter such as wood density(Chave et al.2005,2014).The models thus developed will allow,from simple measurements of dendrometric parameters,the estimation of the standing woody biomass of a given stand.Generic allometric models for estimating aboveground biomass for tropical forests(Brown 1997;Chave et al.2005;2014)and for forests in sub-Saharan Africa(Henry et al.2011)have been developed.In the Sudanian zone of West Africa,some specific models exist(Sawadogo et al.2010;Mbow et al.2013).However,for the Niger drylands few studies on biomass estimation of woody species are available.The use of generic and specific models in Sahelian vegetal formations is not without consequence in the reliability of results,when we know that the performance of a model depends first on the range of parameters and the geographical area which enabled it to be developed(Rondeux 1999;Henry et al.2011).Different model formats are available depending on the regression type and number of input parameters(Rondeux 1999;Picard et al.2012;Sileshi 2014).For example,the regression may be linear or nonlinear and hence the choice of either method should be based on explicit error analysis,with the main objective being reducing residual heterogeneity(Xiao et al.2011).The power model y=axb,is one of the most commonly used in biology,where y is the explained variable,x is the explanatory variable, ‘a’and ‘b’are coefficients of the equation(Zianis and Mencuccini 2004).The overall significance of the equation and its coefficients ‘a’and ‘b’’are some of the important elements of the reliability of this type of model(Zianis and Mencuccini 2004;Sileshi 2014).However,multiple predictive variable models have also been developed to improve the performance of prediction and to broaden selection possibilities.Multiple predictive variable models result from the integration of several explanatory variables and the analysis must emphasize respect for the non-collinearity of variables.Multicollinearity is inevitable when two or more variables are used for biomass and volume prediction(Graham 2003;Sileshi 2014).When multi-collinearity is pronounced,model parameterization is incorrect,model statistical power decreases,and significant predictive variables can be excluded(Graham 2003).
The objective of this study was to develop allometric models for estimation of the aboveground biomass and carbon sequestered in Faidherbia albida and Prosopis africana agroforestry parklands in south-central Niger.To achieve this objective,the hypothesis is that the aboveground biomass of F.albida and P.africana are related to dendrometric parameters,in particular diameter at breast height,total height and/or diameter of the crown.
Materials and methods
Study sites
Parklands of P.africana and F.albida are located at 13°25′N–006°58′E in the south,and 13 54′N-007 18′E in the northeast 15 and 75 km from the town of Maradi,respectively(Fig.1).Soils are tropical ferruginous,slightly leached and clayey under P.africana and ferruginous and leached with coarse sands in dry valleys of F.albida(Gavaud and Boulet 1964).Climatic data from 1970 to 2013 are those of the synoptic station at Maradi airport,proximate to each of the two sites.The climate is Sudano-Sahelian type in P.africana parkland and Sahelian in the parkland of F.albida.Annualaverage rainfallis(477.7±103.9)mm.The annual averages of maximum and minimum temperatures are (35.0±0.7) and(20.8 ± 0.6)°C.There are three seasons:a cold,dry season from November to March;a warm dry period from March to June;and,a wet season from July to October.
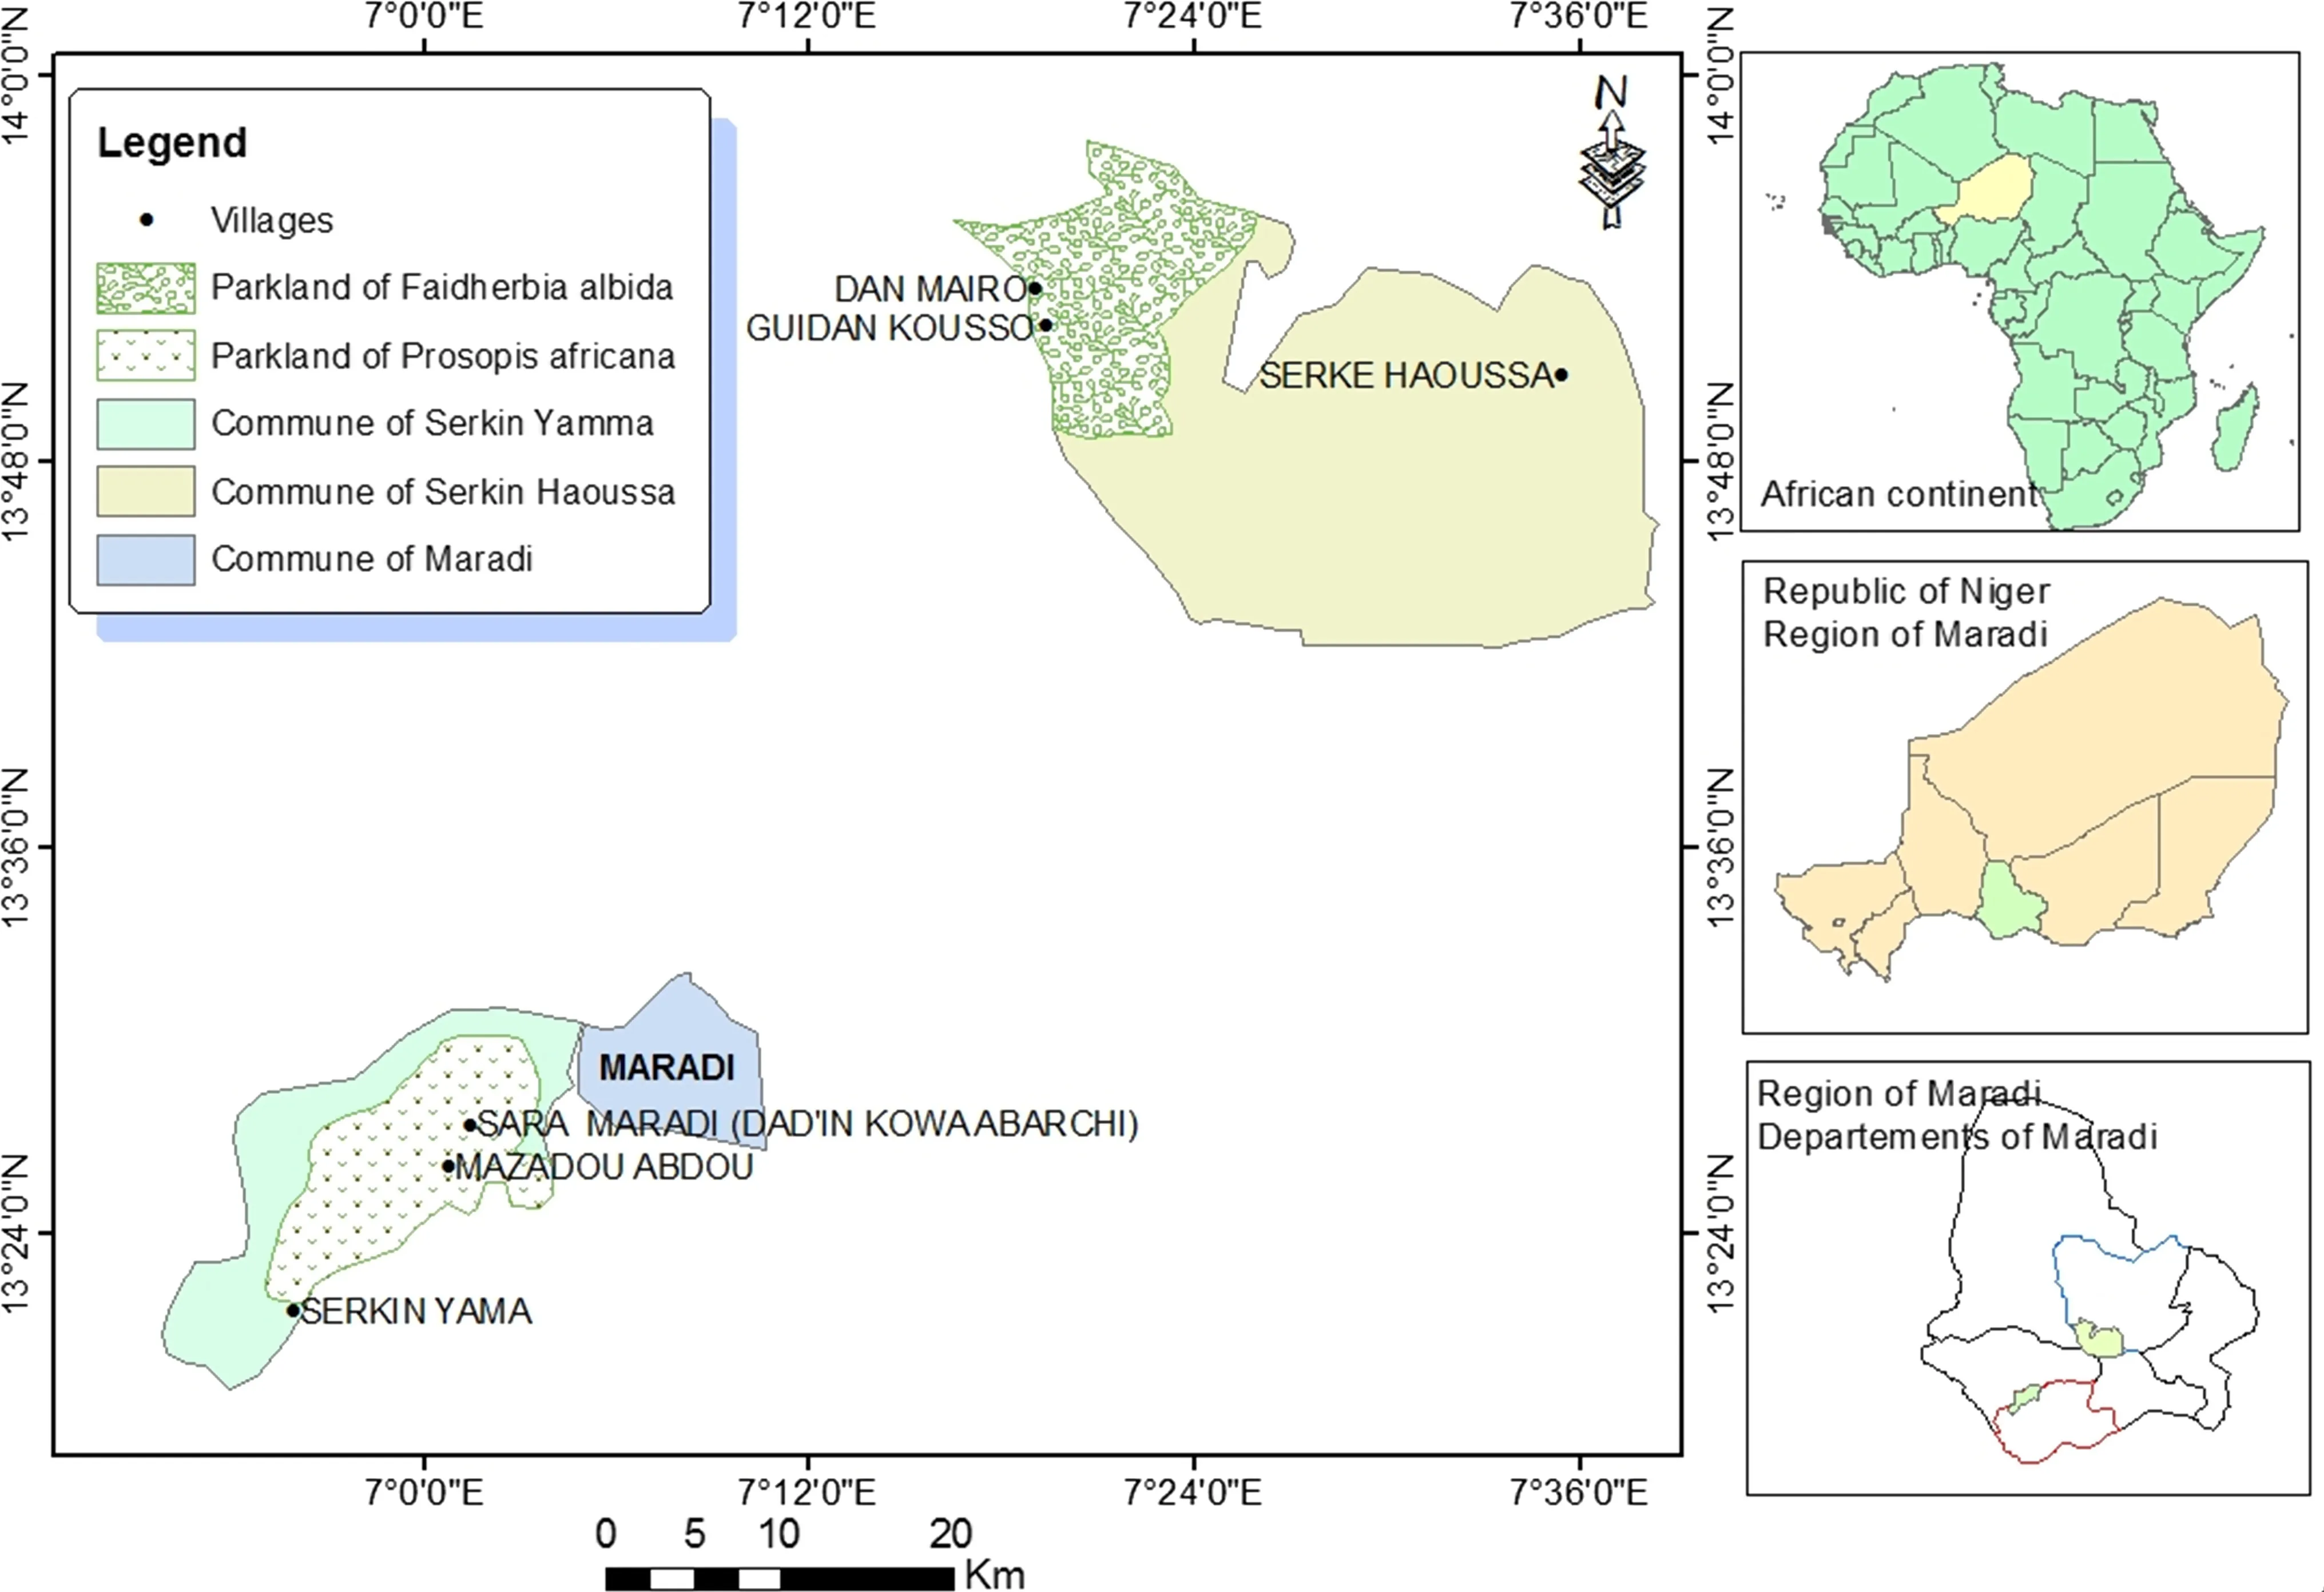
Fig.1 Location of study sites in south-central Niger
Sampling
Inventory results of 2014 of both parklands were used to establish a sampling of P.africana and F.albida trees for the development of allometric models.A total of 69 square plots were established,30 in Dan Mairo and 39 in Sarkin Yamma(Moussa et al.2015a).The area of each plot was 2500 m2as recommended by Thiombiano et al.(2015).Within each plot,a systematic counting of trees and measurements of diameter at breast height(DBH)and diameter of crowns(Dc)using measuring tapes;total heights were measured using stakes.The trees were divided into three diameter classes with 20 cm amplitude to facilitate sampling.For each diameter class,the number of trees to be cut was proportional to its diameter in order to improve the representativeness of samples(Picard et al.2012;Jara et al.2015).Twenty trees for F.albida and 20 trees for P.africana were selected;the 40 trees belonged to the two sites by reason of 10 trees per species.
Data collection and analysis
Biomass
The direct sampling method involving the cutting,measuring and weighing of the different aboveground biomass parts was used because of its precision(Rondeux 1999;Picard et al.2012;Jara et al.2015).Cutting was carried out during February–March 2015 when F.albida is in full foliage in the Sahel(Gassama-Dia et al.2003).The trees were cut with a chainsaw and divided into trunk,branches(large,medium and small)and leaves.The trunks were cut into ridges to facilitate weighing.Fresh biomass(Mf)of the trunk,branches and leaves of each tree was weighed using a 100 kg spring balance.On each part of the tree,samples were taken and weighed.For each trunk,a disc of the cross-section was taken.The samples were bagged,transported and oven-dried at 100°C for 1 week to obtain a constant mass.The dry biomass(Ms)of each component was determined.
Wood density
The graduated cylinder method was used to determine the density(ρ)of each species.This approach is similar to methods of Peltier et al.(2007)and Henry et al.(2010).Small samples of trunks and branches were weighed to determine biomass(M).The samples were then immersed in water in a graduated cylinder(250±2)mL to give the fresh volume(V).This volume corresponds to the sample volume.Density was calculated by the following:

where,ρ is wood density(g/cm3),M is dry biomass,and V is fresh volume
Determination of aboveground biomass
For each component,the rate of conversion of organic matter was calculated by:

where,Cris the conversion rate,Msis dry biomass and Mfis fresh biomass.Dry biomass of each component was calculated by multiplying the conversion rate by fresh biomass.For each tree,total dry biomass was the sum of the dry biomass of trunk,branches and leaves.Pearson correlation tests were applied to determine the degree of relationship between biomass and dendrometric parameters.
Determination of the amount of carbon
The incineration method was used to determine carbon content in biomass of these two species as described by Chavan and Rasal(2011)and Bayen et al.(2016).The analysis was carried out at ICRISAT soil laboratory in Niamey.The 40 samples distributed as 20 for P.africana and 20 for F.albida were reconsidered.After oven drying,leaves,branches and trunk samples were ground separately into powder and packaged in plastic bags.Crucibles were used to incinerate powder.Each crucible was weighed using an electronic precision scale to determine its empty weight(W0)and 0.5 g of powdered biomass then placed in the crucible to give the weight(W1)of the sample.After passing through the furnace for 5 h at 550°C,each crucible containing ash was cooled and weighed to give the ash weight(W2).Carbon content was calculated according to Allen et al.(1986):


where,Aris ash rate,BDis dry biomass,C is carbon rate(%),Csis sequestered carbon,W0is empty weight of crucible,W1is weight of crucible and sample and W2is weight of crucible and ash after incineration.For all tree components,the average rate of carbon is calculated according to species.To monitor the carbon dynamics according to species,the age of each tree was determined by counting the rings.After drying,the discs were smoothed using sand paper until the rings were clear and countedusing the LINTAB 6 system at the Dendrochronology Laboratory of the World Agroforestry Center(ICRAF)at Nairobi,Kenya.In the Sahel,the rainy season is unimodal;consequently,each ring corresponds to a year of growth(Worbes 2002).The quantity of carbon sequestered according to age makes it possible to determine carbon sequestration potential of each species with a view to enhancing their value in the context of climate change mitigation.Finally,an ANOVA test was applied to determine differences in carbon sequestration between species and within each species between its components.
Development and validation of models
Using R Commander Software version 2.15.3,the data underwent logarithmic transformation.The linear regression was based on the assumption that residuals are normally distributed and their variance is homogeneous(Xiao et al.2011;Mascaro et al.2014).To satisfy the regression linearity conditions,Cook’s distance of residuals,normality and homogeneity of residuals were analyzed.This may be used to estimate the influence of a data point and to identify outliers and eliminate them.It must be homogeneous and not too high or too small compared to the overall observation for residuals.As Zuur et al.(2010)noted,an outlier is an observation that has relatively large or small value relative to the majority value.The observation of variance homogeneity and normality of residuals was made from the studentized residuals of each elaborated model by using cloud points.This approach allows for observing actual residual distribution according to the prediction parameters(Zuur et al.2007).The studentized residuals are expressed as a function of the predicted biomass to observe the constancy of their variation,and as a function of normal quantiles to observe their dispersion according to the diagonal.Linear regression is adequate for a model when homogeneity and normality of its residuals are verified(Makungwa et al.2013).
The allometric model of the type ln(Y)=a+bln(D)+cln(H)+dln(ρ)(Chave et al.2005)was the basic equation from which our models were derived.In this model,Y is the total dry biomass;D,H and ρ are,respectively,diameter at breast height,total height and wood density;and,a,b,c and d are model coefficients.In addition to these three dendrometric parameters,the mean diameter of the crown(Dc)was used in equation development.In the Sahel,crown diameters are an important indicator of stand productivity and environmental changes(Breman and Kessler 1997;Kemmouche et al.2008).In contrast to forest ecosystems,crown diameter is an important indicator of aboveground biomass contained in the branches(Beedy et al.2016)and can be used as an independent variable for estimating tree biomass(Kuyah et al.2012).Depending on the number of predictive variables and especially on the values of the coefficients a,b,c,and d,the following types of models have been tested:
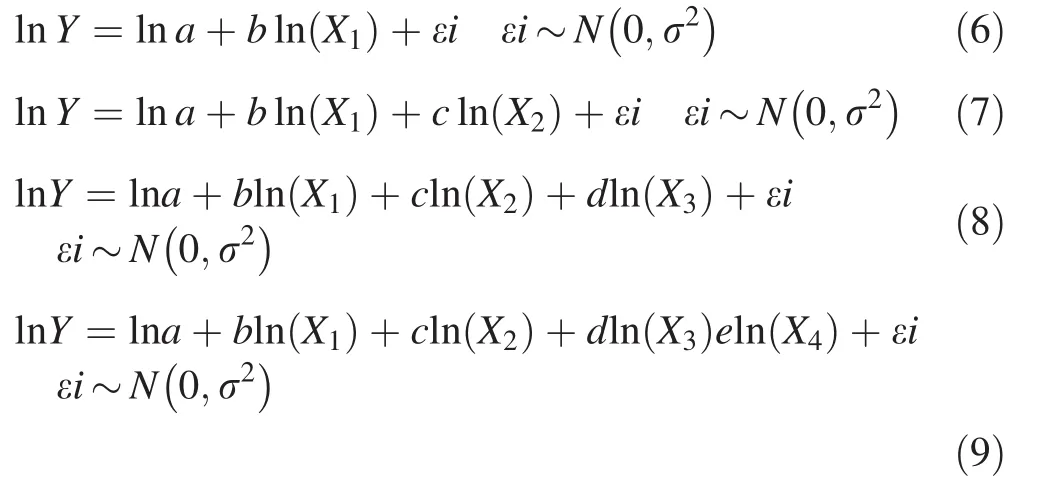
where,ln is the logarithm,Y is aboveground biomass,X1…4,are the independent variables as DBH,H,Dc and ρ,ei is the error,N the normal law with r2as deviation,a,b,c,d and e are coefficients and~errors follow normal distribution.These models were tested to improve the reliability of biomass prediction and to broaden the possibility of choice for each species.
Error analysis
To assess model performance,the overall significance of equations(P value≤0.05)and its coefficients(P≤0.05)as well as the coefficient of determination(R2)were first examined.However,the allometric model may not be validated from a simple value of its coefficient of determination.R2can be high and the model hides a considerable number of errors(Mascaro et al.2011;Sileshi 2014).Therefore,it is necessary to examine the variability of errors in each model in order to evaluate their distribution or size.The mean absolute percentage of error(MAPE)and the root mean square of error(RMSE)were calculated using the following:


where,MAPEis mean absolute percentage of error,RMSEis root mean square of error,Mo and Mp are biomass observed and predicted,and n is the number of trees sampled.
The MAPE expresses the average percentage of error in absolute values and may be misleading when predicting biomass for a model.Instead of a relative sum of errors,the MAPE aggregates errors at the absolute value scale and gives their average in percentage.It reflects the precision and the percentage of what is added to the model.RMSE is a model selection parameter used to aggregate errors into a single predictive power.Errors are raised to the root square before calculating their percentage.This means that RMSE is used when large errors are undesirable in the model(Yao et al.2013).Thus,a low value of MAPE and RMSE indicates a small error model with high predictive power(Yao et al.2013).For multivariate predictive models,in order to avoid the effect of multi-collinearity,analysis of the variance inflation factor(VIF)was added.In general,multi-collinearity is severe for biomass estimation models when VIF is greater than 10(Graham 2003).The expression of VIF avoids the strong correlation that can exist between the predictive variable,an important source of biomass estimation instability(Graham 2003;Sileshi 2014).The variance inflation factor is calculated by the following:

where,VIFis variance inflation factor andis the coefficient of determination of the regression i.Once developed,the correction factor(CF)of each model is calculated to avoid the back transformation problem(Chave et al.2005;Mascaro et al.2014).To return to the arithmetic data,the model is multiplied by the correction factor(CF)calculated on the basis of the following formula:

where CFis the correction factor,MSEis the mean squared error of the regression and Exp the exponential function.
Validation and selection of model
A good fit of model gives a significant equation(P value≤0.05),a coefficient of determination close to 1,a low MAPEand a weak RMSEand/or a VIF≤10.Sileshi(2014)suggests a MAPE≤10%.Finally,the choice of the best model is made on the basis of the weakness of its errors.Only the validated and selected models are presented.
Results
Distribution of dendrometric parameters
The minimum values of DBH,H and Dc were 5.73 and 5.73 cm,3.1 and 1.6,2.65 and 1.92 m for P.africana and F.albida,respectively.The maximum values of the parameters were 44.58 and 65.92 cm,10.8 and 12.2,10.65 and 13.54 m,respectively(Table 1).The correlation is highly significant between DBH and H (R2=0.91,P≤0.001),between DBH and Dc(R2=0.93,P≤0.001)and between H and Dc(R2=0.93,P≤0.001).
Wood density was(0.72±0.06)g/cm3for P.africana and(0.51±0.02)g/cm3for F.albida.The average total biomass per tree was 306.44 kg for P.africana and 433.21 kg for F.albida(Table 2).Total biomass of branches(R2=0.92,P≤0.001)and leaves(R2=0.92,P≤0.001)was significantly correlated with the total biomass of trunks(R2=0.86,P≤0.001)for P.africana.The correlation between total biomass and DBH(R2=0.91, P≤0.001), total height (R2=0.86,P≤0.001)and crown diameter(R2=0.89,P≤0.001)was significantly positive(Fig.3)for P.africana.Similarly for F.albida,the correlation was significant between total biomass and DBH(R2=0.94,P≤0.001),total height(R2=0.76,P≤0.001)and crown diameter(R2=0.84,P≤0.001).The total branch biomass (R2=0.99,P≤0.001)and the total leaf biomass(R2=0.91,P≤0.001)were significantly correlated with the total trunk biomass(R2=0.81,P≤0.001)for F.albida.
Carbon
The rate of sequestered carbon varied according to species.The mean was 55.58±0.76% for P.africana and 56.61±1.64%for F.albida.There was a significant difference in sequestration between the two species(P≤0.05,F=15.87,dl=101).The total amount of carbon sequestered per tree varied from 6.23 kg to 459.27 kg with an average of 170.32 kg for P.africana.It ranged from 8.28 to 1013.49 kg for an average of 245.24 kg for F.albida.The density of P.africana in parkland was 33.02 trees/ha(Moussa et al.2015a),with a carbon sequestration capacity of 0.19×10⁻³to 1.38×10⁻²Mg/ha for an average of 5.11×10⁻³Mg/ha.F.albida was 17.2 trees/ha in the parkland,with a carbon sequestration capacity of 0.14×10⁻³and 1.74×10⁻²Mg/ha for an average of 4.22 10-3Mg/ha.The amount of carbon was higher in branches and trunks than in the leaves(Fig.2).It was 12.79,52.98 and 34.23%,respectively,in leaves,branches and trunks for small diameter P.africana.For the medium diameter class(20–40 cm),the amount of carbon was 6.13,49.45,and 44.41%for leaves,branches,and trunks,respectively,for this same species.Trees of P.africana with large diameters(>40 cm)have the carbon distributed in leaves,branches and trunks at 4.92,51.47 and 43.59%,respectively.For F.albida,the proportion of the carbon was 26.26,28.19,and 45.53%in leaves,branches,and trunks,respectively,for young trees.For the medium diameter class,the amount of sequestered carbon was 14.97,55.88 and 29.14%,respectively,in leaves,branches and trunks for F.albida.Finally,for the same species,the amount of carbon was 9.19,64.20,and 26.61%,respectively in leaves,branches,and trunks for large diameter(Fig.2).For F.albida,the difference in carbon sequestration was not significant between trunk and branches(P=0.91,F=0.08,dl=5),and between leaves and branches(P=0.87,F=0.13,dl=5),and between diameter classes.However,the difference was significant between trunk and leaves(P≤0.05,F=53.3,dl=5).The average stand age was13±10 and 19±8 years for P.africana and F.albida respectively.The average annual carbon sequestered per tree was(7.84±4.81)and(10.71±9.86)kg/year,respectively for P.africana and F.albida.This gives an annual carbon sequestration capacity of 235.35 kg/ha for P.africana and 184.21 kg/ha for F.albida in these parklands.
Selected models
Table 3 presents only the selected models in this study.For models 1,statistical parameters are R2=0.99,MAPE=0.98%and RMSE=1.75%for P.africana.For F.albida the statistical parameters are:R2=0.99,MAPE=1.19%and RMSE=2.37%. For models 2, R2=0.97,MAPE=2.03%,RMSE=3.09%and VIF=6.93 for P.africana.For F.albida,R2=0.98,MAPE=1.37%,RMSE=2.71%and VIF=6.1.For models 3, first category,R2=0.96,MAPE=3.83%,RMSE=5.02%and VIF=1.05–7.29 For P.africana.For F.albida,R2=0.98, MAPE=2.02%, RMSE=2.91% and VIF=1.08–5.46.Finally for the second(model 3′)category,R2=0.98,MAPE=2.16%,RMSE=3.09%and VIF=1.11–8.42 for F.albida(Table 3).

Table 1 Dendrometric parameters of the sample according to the sites

Table 2 Minimum,mean and maximum biomass of the trunk(Mtrunk),branches(Mbranches),leaves(Mleaves)and total(Mtotal)in kg
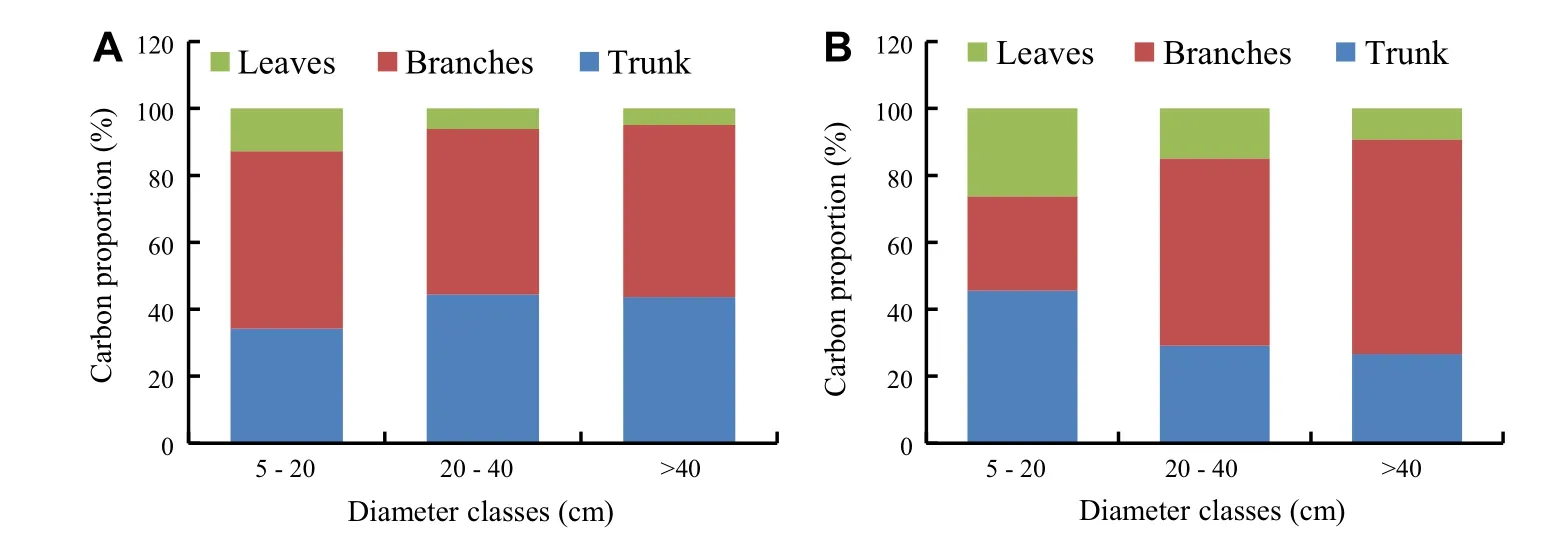
Fig.2 Distribution of sequestered carbon in P.africana(a)and F.albida(b)components by diameter class
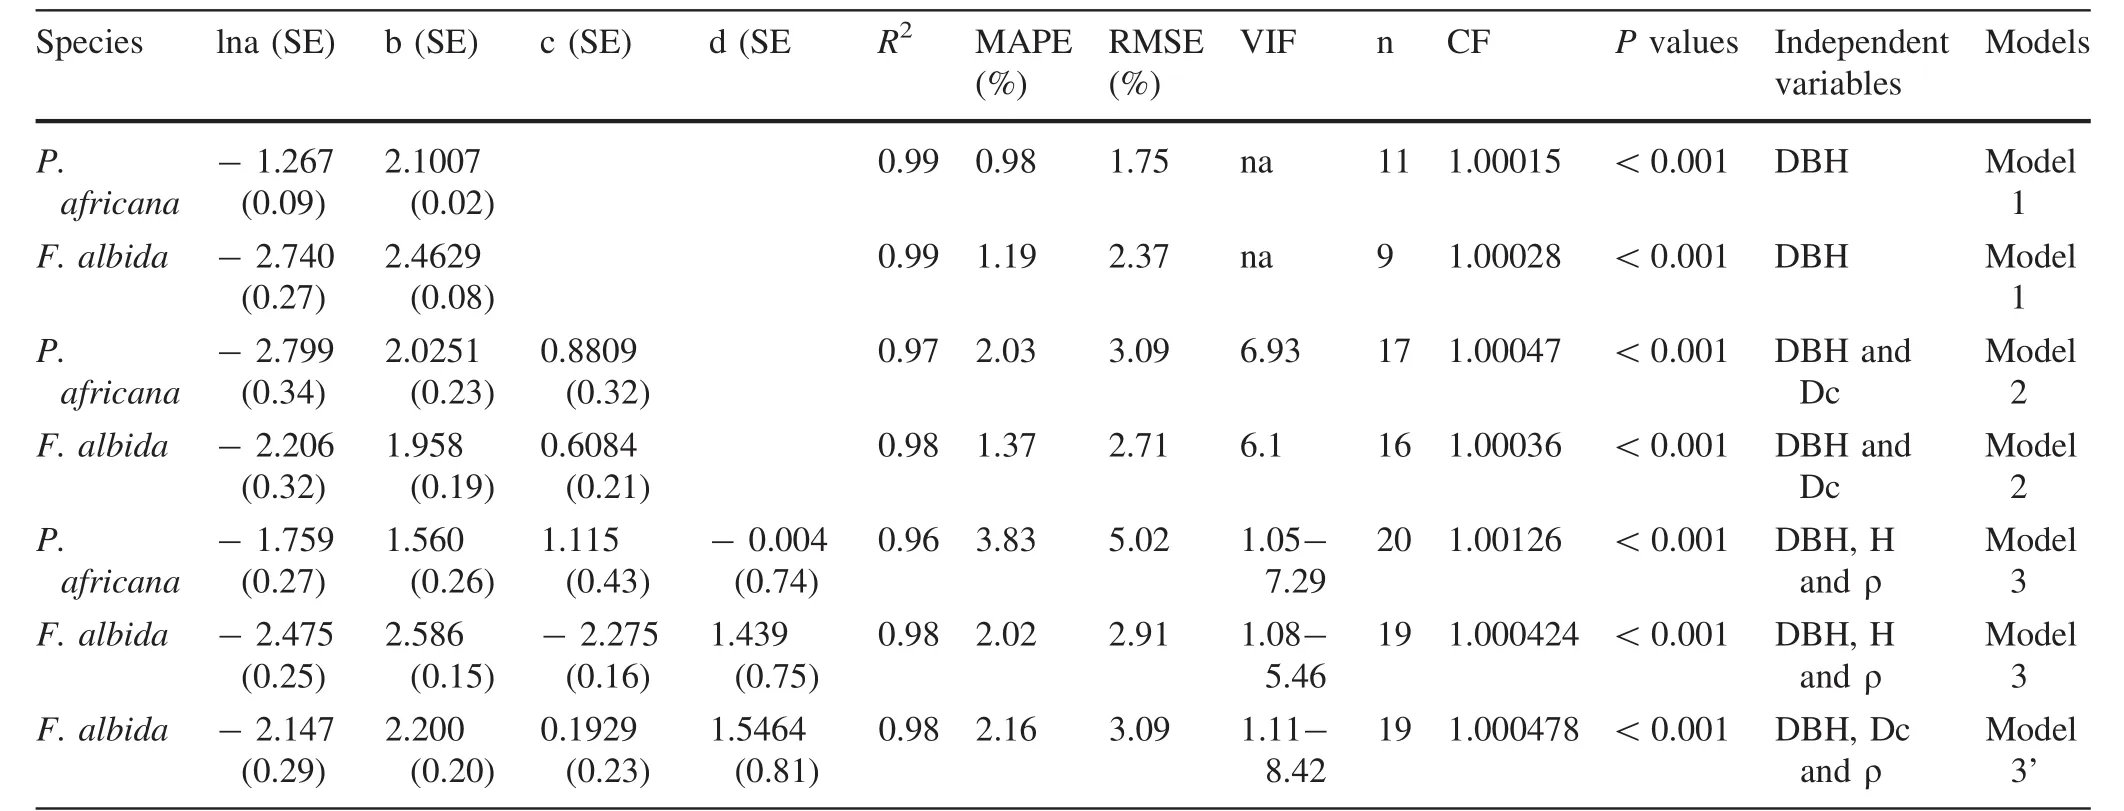
Table 3 Statistic parameters of selected models according to species
Variance of residuals
The clouds of points relative to the studentized residuals distribution,as a function of predicted biomass for each model,are presented in Fig.3.There are less than 2 studentized residuals for each model.Thus,the variance residual homogeneity is one of two necessary conditions for using linear regression to model biomass as a function of dendrometric parameters(Xiao et al.2011;Mascaro
et al.2011).It is necessary to validate the second condition,which is the normality of residuals.
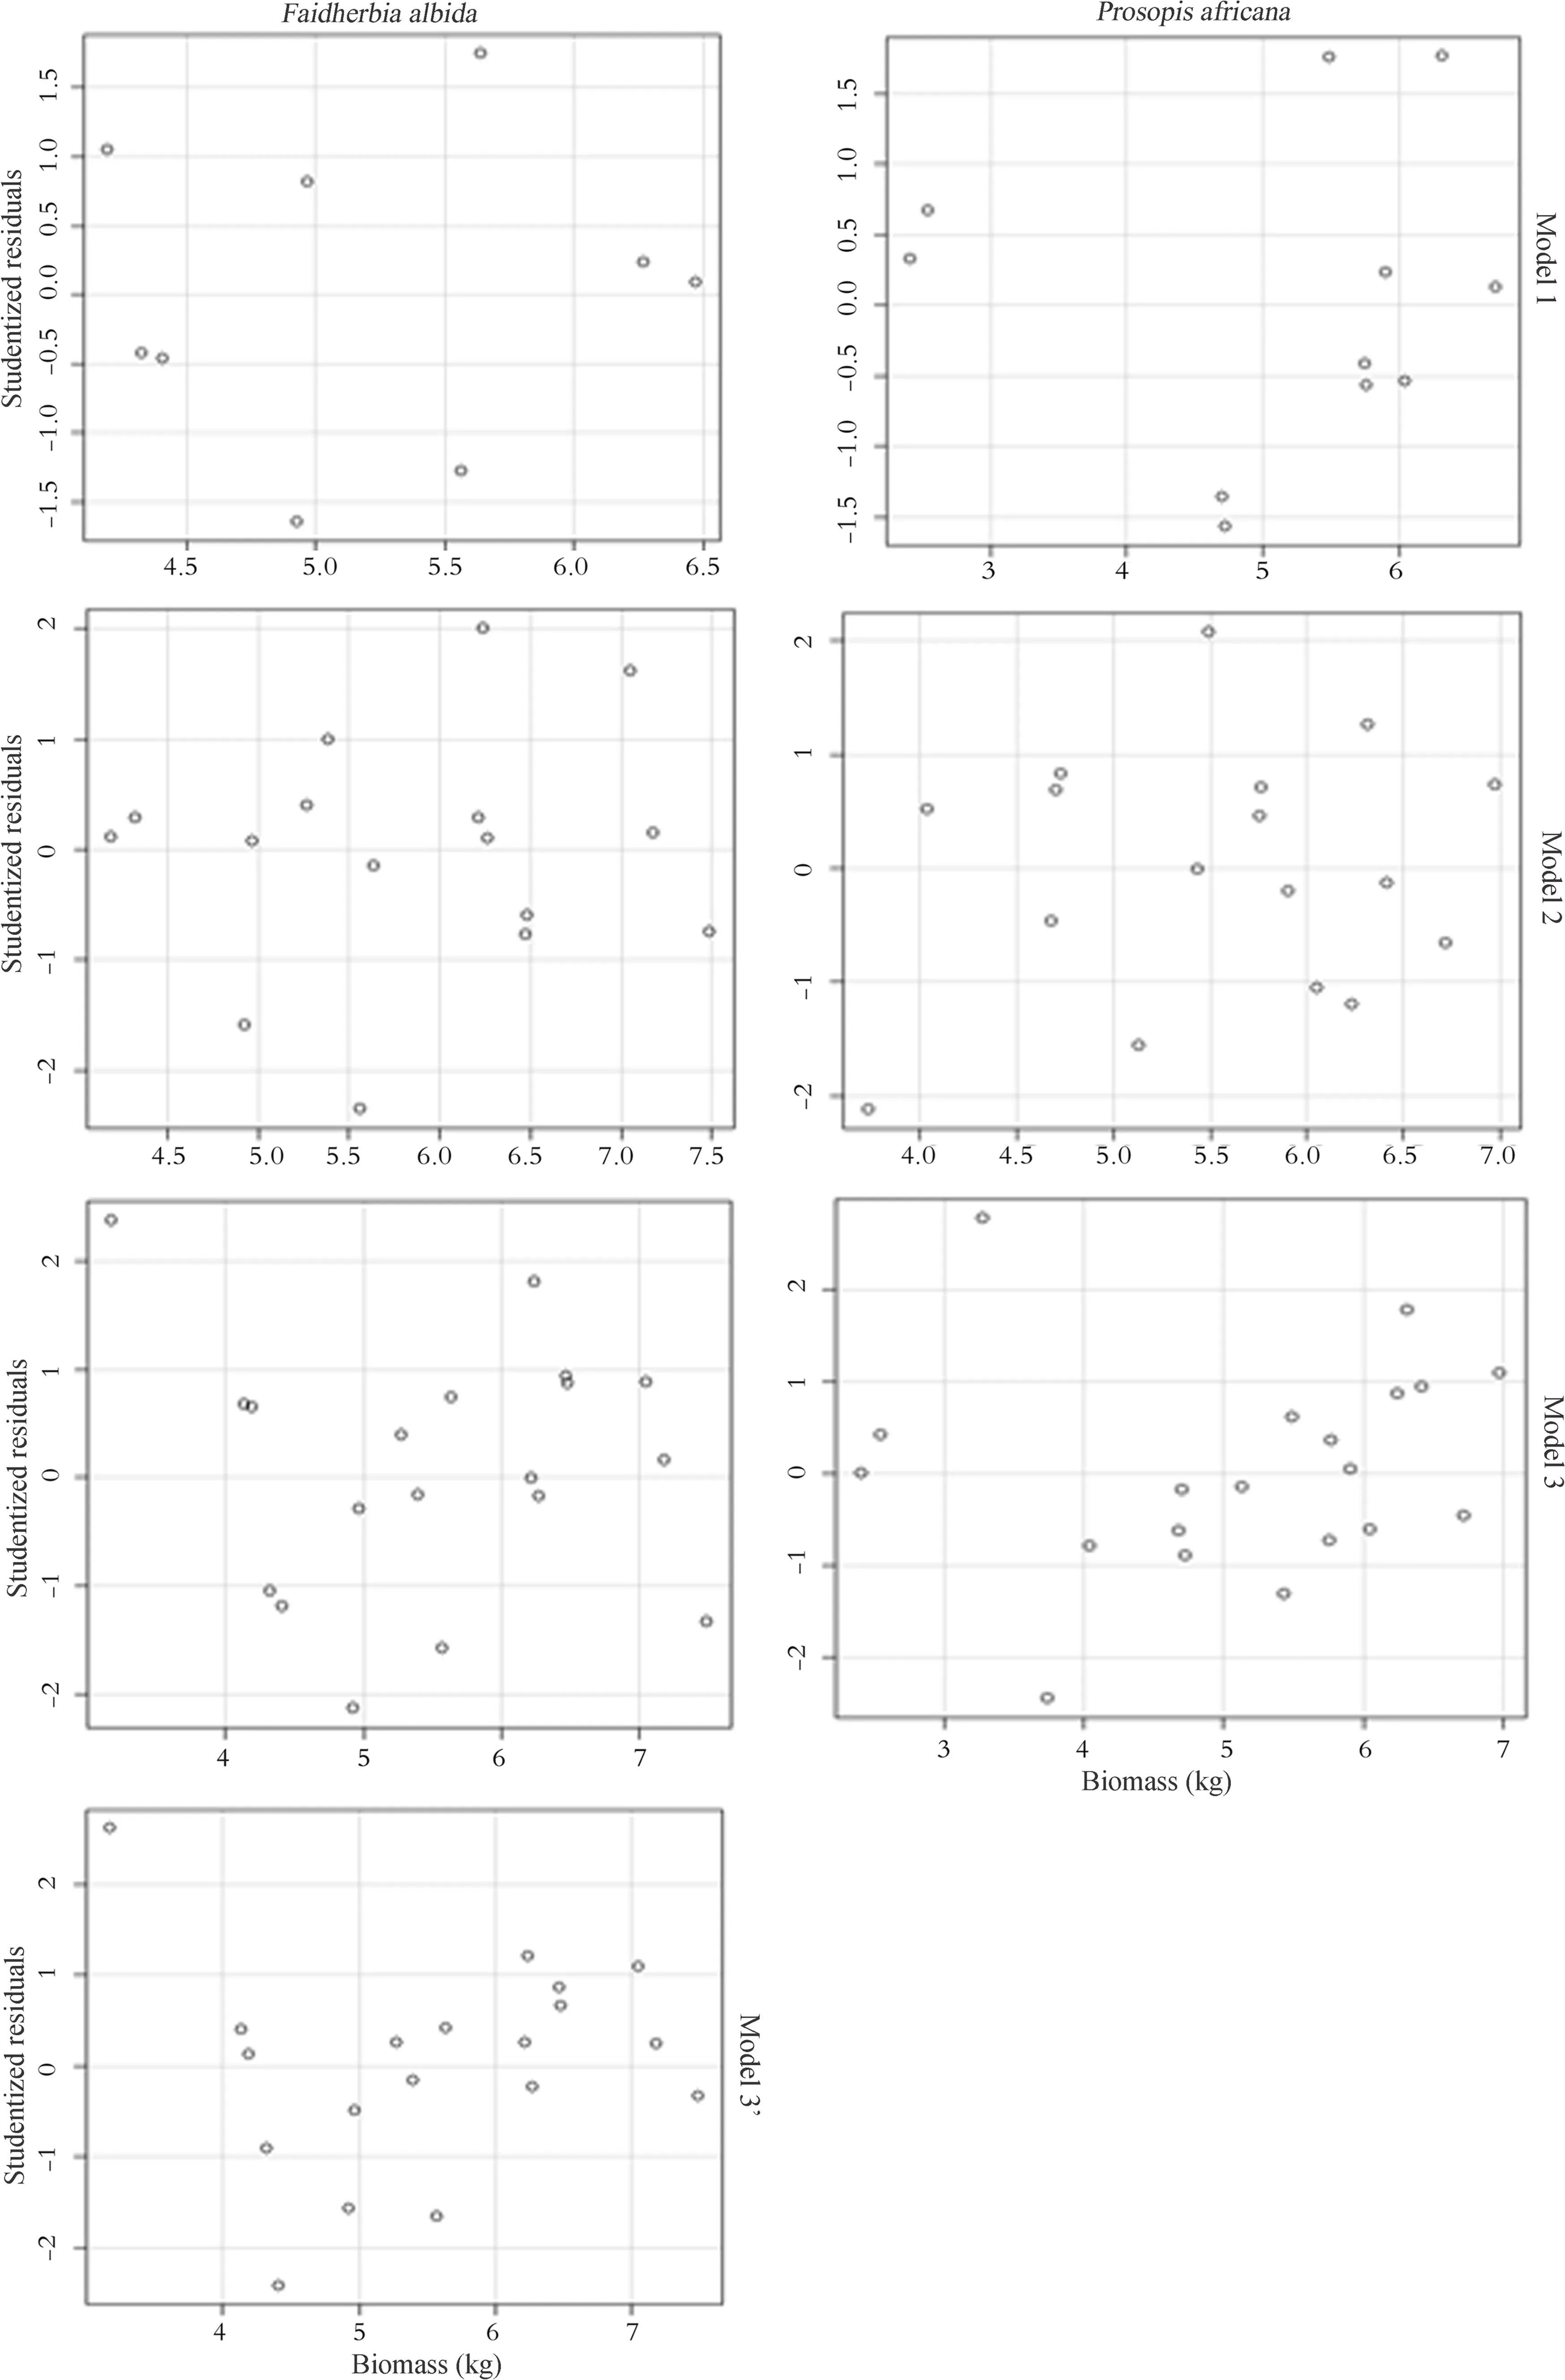
Fig.3 Test for homogeneity of variance of studentized residuals related to the predicted biomass according to the selected models and the species
Normality of residuals
Figure 4 shows the distribution of studentized residuals as a function of normal quantiles distribution along intervals delimited by the quantiles and following the fitting line for each model(Fig.4).This indicates the normal distribution of residuals for each model.The two hypotheses of homoscedacity and normality of residuals satisfy the adequacy of using linear regression.It also con firms the assumption that residuals are normally distributed on a logarithmic scale for linear regression(Xiao et al.2011;Packard 2013).
Quality of adjustment and distribution of errors
The quality of adjustment was evaluated by the analysis of errors,including RMSE and MAPE,for each model.Figure 5 shows the distribution of RMSE according to DBH and species.The size of RMSE is variable depending on the diameter.In general,the error is more concentrated in medium and large diameter trees and presents a fluctuation in value in this study.It is negligible in some small diameter trees.
Figure 6 shows the disaggregation of MAPE within the models and according to species as a function of DBH.As in the case of RMSE,MAPE distribution is also more concentrated in medium to large diameter trees with fluctuating values.For small diameter trees,MAPE is generally low and for some,negligible,except for a few isolated cases.Figure 6 also shows that MAPE increases as the number of independent variables increase.
Discussion
Density
Wood density of trunks was 0.72±0.06 g/cm3for P.africana and 0.51±0.02 g/cm3for F.albida.These results are comparable to those of some studies on wood density in Africa.In Malawi,Beedy et al.(2016)found densities of F.albida in plantations of 0.596 g/cm3and 0.501 g/cm3in agroforestry parklands.Whereas in Burkina Faso,Weber et al.(2008)reported wood density of 0.687 g/cm3for P.africana.For many species in sub-Saharan African forests,Henry et al.(2011)found a range of densities between 0.15 and 1.2 g/cm3.In the agroforestry parklands of Cameroon,Peltier et al.(2007)noted a wood density of 0.62 g/cm3in shea tree(Vitellaria paradoxa Gaertn.),and showed that densities were not homogeneous between compartments of trees.
Carbon
The carbon content was(55.58±0.76)%for P.africana and(56.61±1.64)%for F.albida.These values are different to the carbon default value of 50%in total dry biomass of species given by the UNFCCC(2006).Average sequestered carbon was 170.32 kg/tree for P.africana and 245.24 kg/tree for F.albida.Carbon was more concentrated in branches and trunks than in leaves.This is in agreement to Beedy et al.(2016)for F.albida in Malwi,for which carbon was stored more in the trunk,then in branches,and finally in leaves.They found a carbon sequestration capacity per tree using the default rate of 0.5 between 0.006 and 0.315 Mg/tree in plantations and between 0.1 and 0.615 Mg/tree in parklands.This difference in carbon sequestration per tree compared with our results is likely related to sample size and to rainfall.In Malawi,the rainfall of the study area was between 950 and 1300 mm(Beedy et al.2016),higher than in our study area(526 mm).The largest DBH was 116.0 cm compared with 65.9 cm for this work.For our study,the annual carbon sequestered is 235.36 kg/ha for P.africana and 184.21 kg/ha for F.albida,while the average sequestration per tree is(7.84±4.81)and(10.71±9.86)kg/year,respectively,for P.africana and F.albida.This difference in annual carbon sequestration is related to tree density by hectare of the two species in these parklands.The density is highest for P.africana(30.0 trees/ha)and for F.albida(17.2 tree/ha)(Moussa et al.2015a).Recent studies of aboveground biomass of agroforestry systems have shown a carbon sequestration capacity between 0.3 and 15.1 Mg/ha/year(Nair and Nair 2003;Takimoto et al.2008;Nair et al.2009).Finally,the capacity of agroforestry systems to sequester carbon depends on the management of selected species,soil characteristics,annual rainfall and cultural practices,among others(Mbow et al.2014).These results show the capacity of agroforestry systems in the Sudano-Sahelian zone to sequester carbon and to contribute to climate change mitigation.
Allometric models
The sampling design is the proportionality of the number of trees to the corresponding DBH class in order to improve a good representativeness of the stands(Picard et al.2012)and avoid errors arising from the predominance of one
diameter class over another(Sileshi 2014).In most cases,sampling involves an unbalanced number in favor of small diameter trees over large diameter ones,leading to increased heteroscedacity(Sileshi 2014).The number of samples used for this study was limited to twenty trees per species on two sites because the two species are protected in Niger.The sample size in the literature in fact may be variable for the development of allometric models.Nevertheless,it takes into account resources and time allocated to the study(Picard et al.2012).Allometric models have been developed with a number of trees above 100(Brown 1997;Chave et al.2005;Basuki et al.2009;Sawadogo et al.2010;Makungwa et al.2013).Other models have used fewer than 20(Brown et al.1995;Peltier et al.2007;Ebuy et al.2011;Larwanou et al.2010;Mbow et al.2013).The diameter range for P.africana is(5.7–44.6)cm and(5.7–65.9)cm for F.albida.The range de fines the dendrometric condition of use of a model(Rondeux 1999).According to various studies,the diameter range is variable and depends on the objectives,species or stand,and the sampling design(Zianis and Mencuccini 2004;Chave et al.2005;Sawadogo et al.2010;Makungwa et al.2013;Mbow et al.2013).The methodology for the development of our models was based on logarithmic transformation,the analysis of outliers,and then the verification of normality and homogeneity of residual variances.Logarithmic transformation is an analytical method used in many cases to reduce residual heterogeneity and to approach linear regression(Basuki et al.2009;Xiao et al.2011;Kuyah et al.2012;Makungwa et al.2013;Mascaro et al.2014).The simple transformation of the variables is not sufficient to satisfy the condition of linear regression.In fact,linear regression uses the least squares method with the sum of squares of deviations to estimate the various statistical parameters,including the equation coefficients and errors(Bonate 2011).Absence of normality or homogeneity of residuals undoubtedly leads to an increase in the errors of the squared deviations,to the truncated estimation of these parameters,and consequently to the development of unstable and non-performing models(Graham 2003;Sileshi 2014).Hence,the normality and homogeneity of residual variances is an important starting point for the development of performance models and,above all,confirms the assumption that linear regression better characterizes the data with an addition of normal and homoscedastic errors(Xiao et al.2011).Packard et al.(2011)assumed that errors were normally distributed and summed on the logarithmic scale.The analysis of the normality and the homogeneity of the residuals were first carried out using point clouds.Geometric analysis is important because it makes it possible to obtain the best distributions of the residuals and therefore to draw the best conclusions(Zuur et al.2007).The elimination of outliers is done on the basis of the appreciation of Cook’s distance.The latter measures the effect of suppressing a given observation in a regression.In general,when Cook’sdistance exceeds 2 in absolute value,Sileshi(2014)considers such an observation to be aberrant.However,Zuur et al.(2010)considers aberrant values in a model when Cook’s distance deviates from the majority observations.In the end,all Cook’s distances must not undergo great variability.If this is the case,we can consider that the respective observations bias the estimation of the regression coefficients.The analysis according to the outlier elimination,the normality and the homogeneity of the residuals,is an approach presented by Zuur et al.(2010)and used in numerous publications, in particular Makungwa et al.(2013)and Bayen et al.(2016).The models validated in this study are seven,three for P.africana and four for F.albida.The model expressing the biomass as a function of DBH(model 1),biomass as a function of DBH and Dc(model 2),biomass as a function of DBH,H and ρ(model 3)and finally,biomass as a function of DBH,Dc and ρ (model 3′).Model 1 is the most accurate with lower error values for both P.africana and F.albida.Errors(MAPE and RMSE)increase as the number of independent variables increase in the model.This observation was similar for standard errors(SE)for estimating the coefficients of the different models.Zuur et al.(2010)explained this phenomenon as an in flationary variance effect due to collinearity,i.e.,the strong correlation between the independent variables.More the collinearity is pronounced,more the estimated coefficient of the model is biased,and the model performance decreases due to the increase in errors.Some studies have provided thresholds from which variance inflation becomes severe for biomass estimation models on the basis of the value of the Variance Inflation Factor(VIF).Sileshi(2014)shows that inflation of variances starts to be noticeable from VIF>5.Nevertheless,for Chatterjee and Hadi(2006)and Graham(2003),inflation of variances becomes severe in a model with a VIF>10.For the independent multivariate models of this
study,the VIF was between 1.05 and 8.42.These values may be considered acceptable because they do not exceed the thresholds established by these authors.However,Zuur et al.(2010)show that inflation of variances is already beginning to be felt with a VIF>2.Models developed beyond this value do not mean that they are false but rather announce premises of instability causing the rise of standard errors of the coefficients.Thus,model 1 for both species presents statistical performances compared to models 2 and 3 or 3′.In the West African savannah,allometric equations for estimating biomass of many woody species have been developed,in particular by Sawadogo et al.(2010)and Mbow et al.(2013).The equations validated by Sawadogo et al.(2010)carried several independent variables,and with interactions between them,have errors between 0.30 and 0.70 or more.Mbow et al.(2013)developed polynomial equations with errors less than 20%and standard residual errors less than 0.20.Beyond these studies,numerous allometric equations have been developed in the Sudano-Sahelian zone of West Africa for the estimation of either biomass or volume.But the means of assessing errors and validating equations differ from one study to another(Henry et al.2011;Moussa et al.2015b).Some equations are validated on the basis of their correlation coefficients.On the other hand,generic models,in particular those of Chave et al.(2005),show error variability.For example,for their model II for dry and wet forests,biomass is overestimated between 5.5 and 16.4%.The models developed by Henry et al.(2010)also present a variability of the RMSE for the tropical rain forests of West Africa.However,one of the main criticisms of the logarithmic transformation of data is the back transformation problem which reduces errors to the exponential scale and,above all,creates an imbalance with actual observations(Packard 2013).The calculation of the correction factor(CF)is a response to this concern.Indeed,the arithmetic model is multiplied by the correction factor(Chave et al.2005;Mascaro et al.2014).The correction factor should always be close to 1(Mascaro et al.2011).For this study,the CF is between 1.00015 and 1.00126,substantially equal to 1 for all models developed.Thus,Baskerville(1972)and Wauters et al.(2008)consider it negligible because it does not create a significant difference in the estimation of biomass.
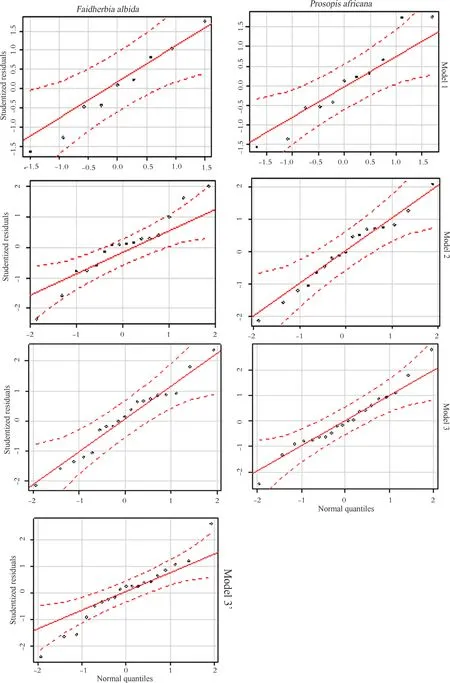
Fig.4 Test of normality for studentized residuals according to the selected model and species
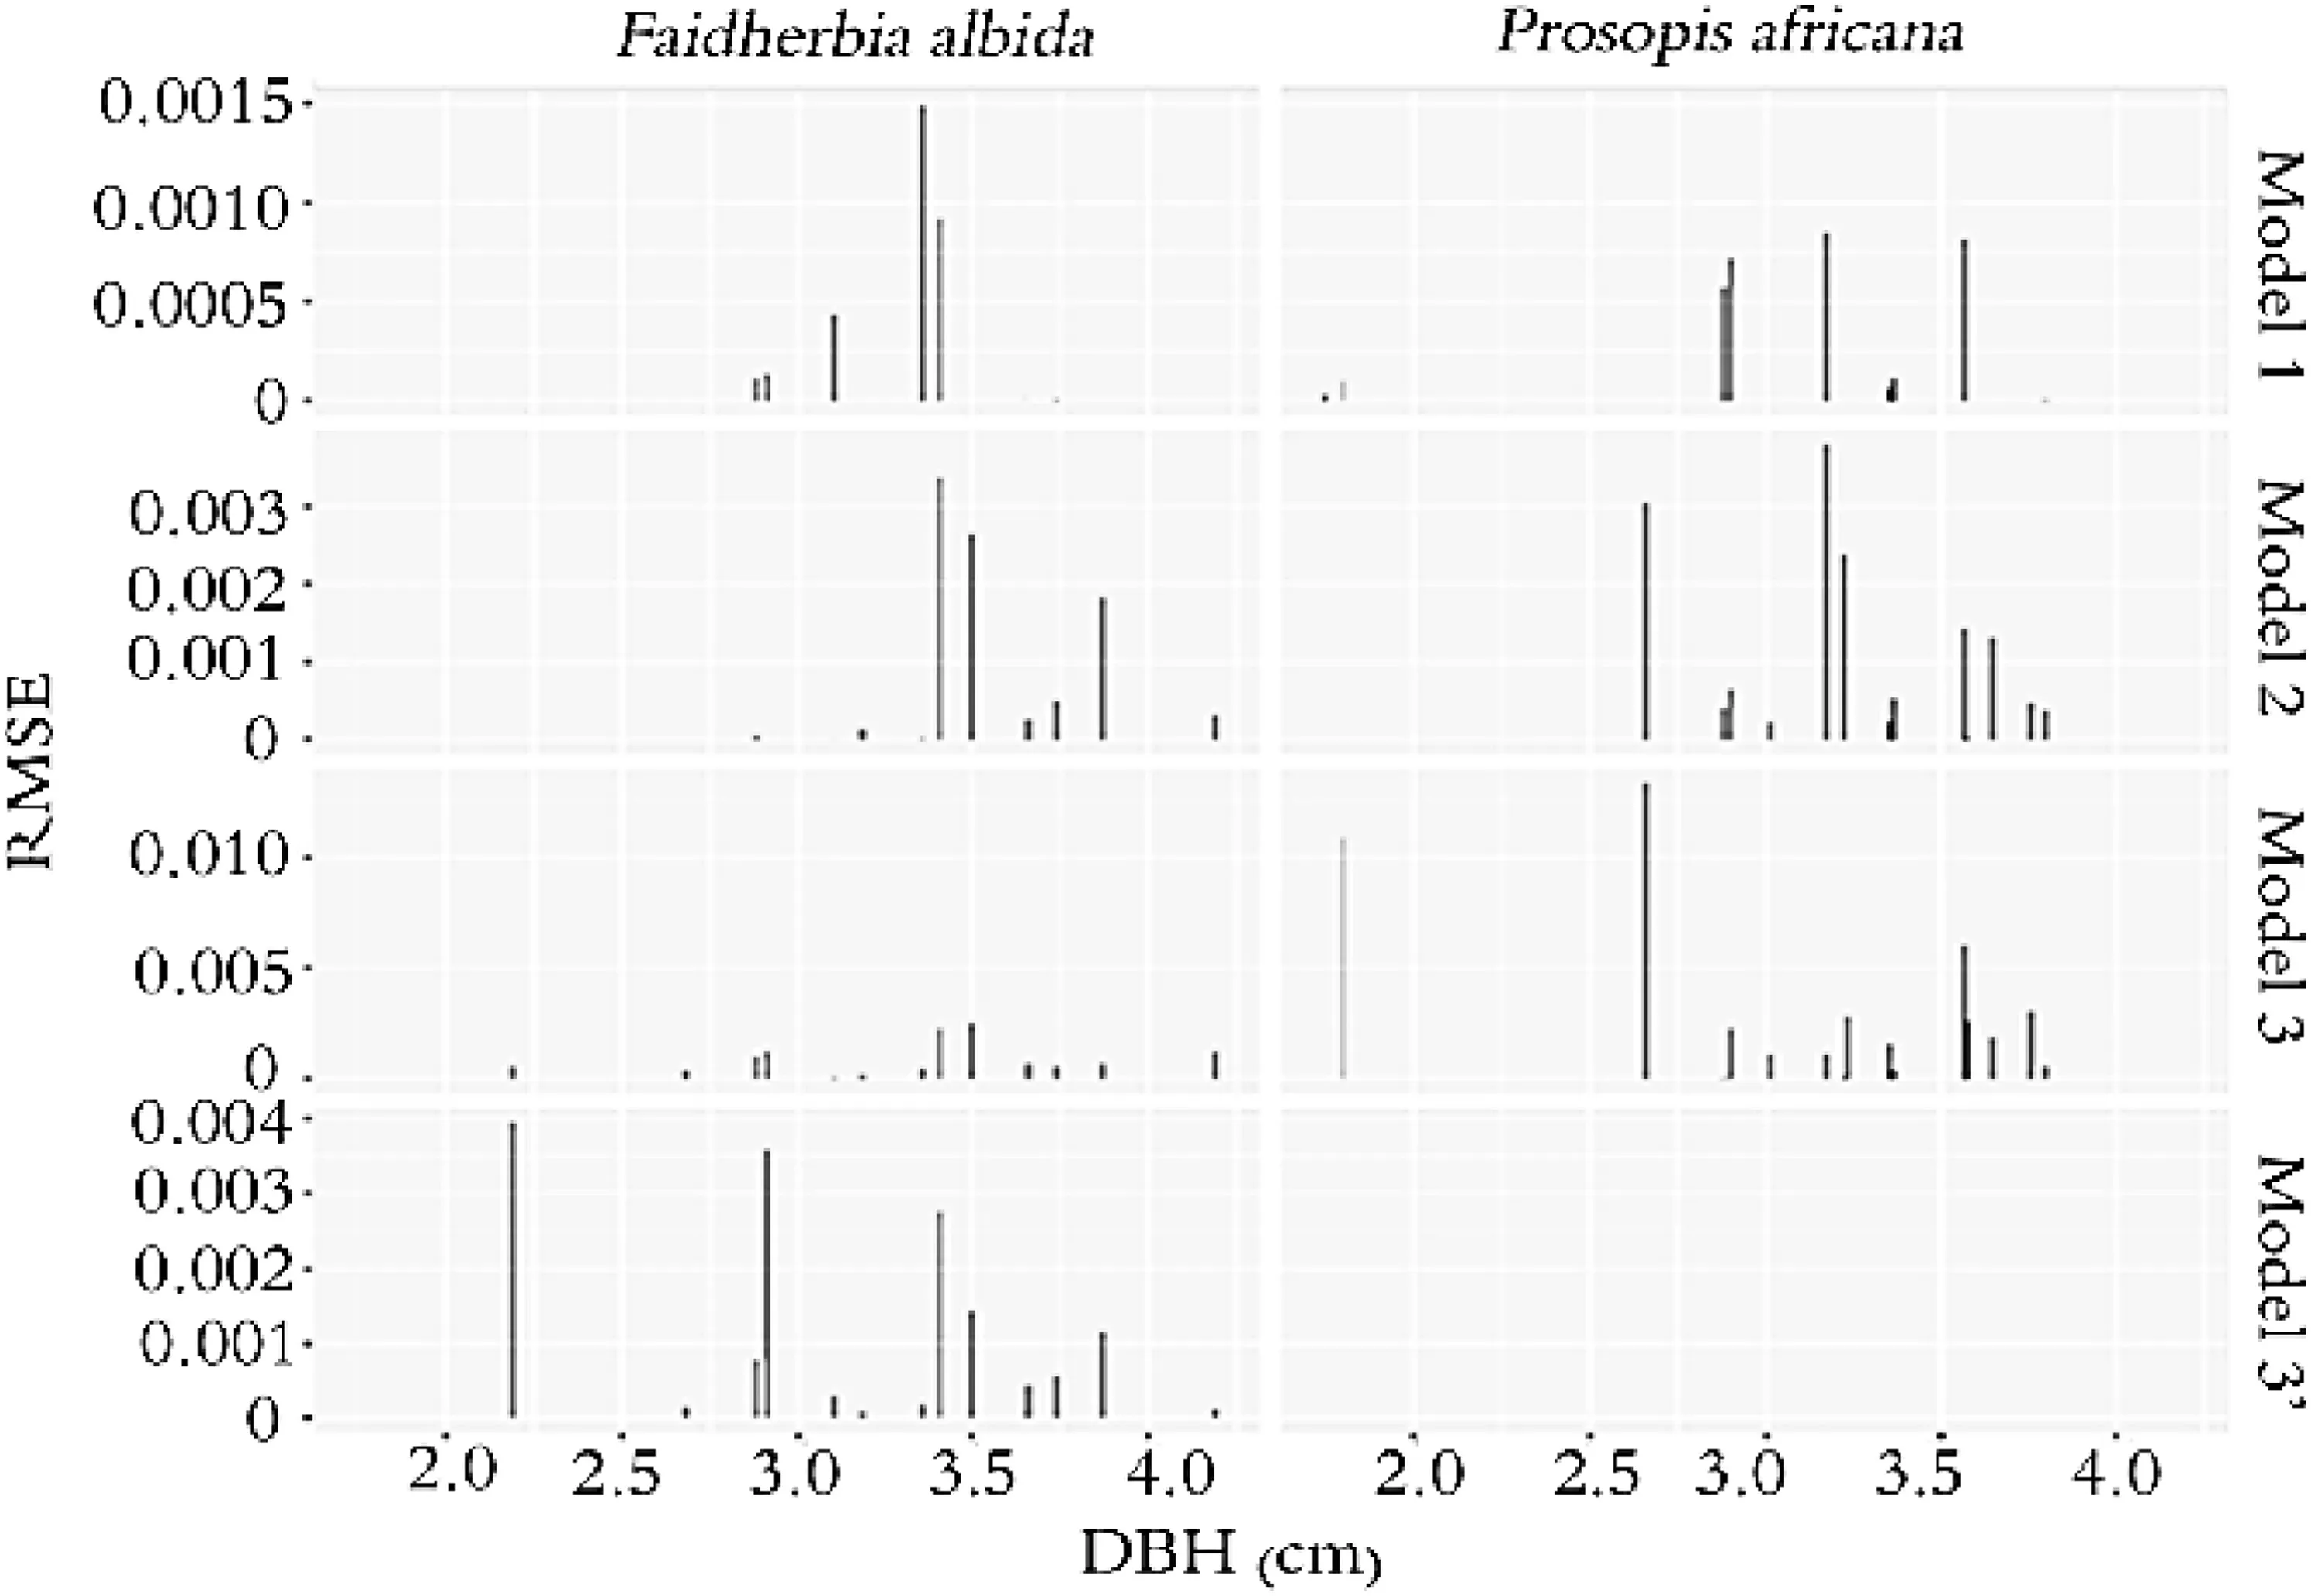
Fig.5 Distribution of root mean square of error(RMSE)according to DBH
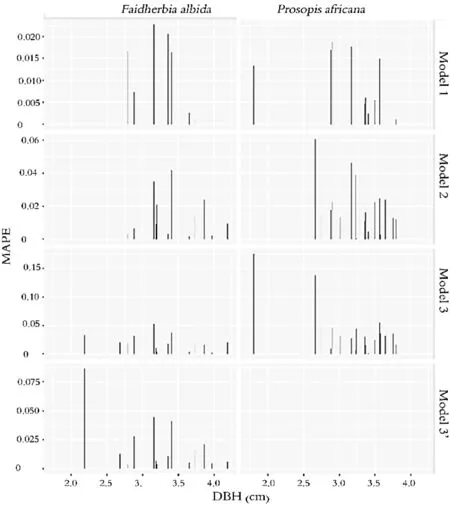
Fig.6 Distribution of mean absolute percentage of error(MAPE)according to DBH and species
Conclusion
This study reports on carbon sequestration capacity of P.africana and F.albida of two agroforestry parklands in south-central Niger.The carbon content is higher in F.albida than in P.africana.This observation is the same for annual carbon sequestration per tree of the two species.However,the amount of carbon sequestered per hectare is higher for P.africana than for F.albida.This is a result of higher tree density per hectare of P.africana than that of F.albida.This study developed allometric models for estimating aboveground biomass of P.africana and F.albida.The validated models are the culmination of a process based mainly on the analysis of errors,in particular MAPE(mean absolute percent of error)and RMSE(root mean square of error)for each of these species.Model 1 in the form lnY=-1.267+2.1007 ln DBH for P.africana and lnY=-2.740+2.4629 ln DBH for F.albida are considered to be the better performers than the other models.The future assessment of the aboveground biomass of P.africana and F.albida in this area on the basis of these models must take into account the dimensions of dendrometric parameters that allowed their development.These results can be used to improve sustainable management of the two species.
AcknowledgementsThe first author would like to thank the African Forest Forum(AFF)and the International Foundation for Science(IFS)for funding(D/563-1)this study.Recognition also goes to the populations of the two sites for their good collaboration during data collection.
 Journal of Forestry Research2018年6期
- Journal of Forestry Research的其它文章
- Black locust(Robinia pseudoacacia L.)as a multi-purpose tree species in Hungary and Romania:a review
- The impact of the environmental factors on the photosynthetic activity of common pine(Pinus sylvestris)in spring and in autumn in the region of Eastern Siberia
- Osmoregulators in Hymenaea courbaril and Hymenaea stigonocarpa under water stress and rehydration
- Effect of nitrogen levels on photosynthetic parameters,morphological and chemical characters of saplings and trees in a temperate forest
- Free amino acid content in trunk,branches and branchlets of Araucaria angustifolia(Araucariaceae)
- Exogenous application of succinic acid enhances tolerance of Larix olgensis seedling to lead stress
