Relationship between vegetation types,soil and topography in southern forests of Iran
Gholamhosein Moradi•Harald Vacik
Abstract For sustainable forest management,understanding the ecological factors that determine vegetation composition are important.Here,the relation between the vegetation composition and environmental factors(elevation,aspect,slope,CaCO3,K,P,C,N,C/N,bulk density,soil porosity,saturation moisture content,EC,pH,sand,silt and clay)was investigated in the Khonj forests,Fars Province,Iran.Characteristic land units,each 200 m2,were chosen for sampling to analyze species composition,soil characteristics and topographic factors.The floristic data were classified using a two-way indicator species analysis(TWINSPAN).Means were then compared using an ANOVA and Duncan multiple range test to detect any variations between groups.Also,the Kaiser–Meyer–Olkin index and Bartlett test were used to measure sampling adequacy.The four vegetation groups identified comprised the species Achillea wilhelmsii,Tanacetum parthenium,Convolvulus spinosus,Capparis spinosa.A detrended canonical correspondence analysis(DCCA)ordination diagram clearly illustrated the relationship between vegetation and environmental factors.According to the results,group 1 with A.wilhelmsii as the indicator species has a positive relation with slope and elevation.T.parthenium was the indicator species of group 2,that appears in areas with high silt and low bulk density and sand.The results showed that group 3 with Convolvulus spinosus as the indicator species was distributed in soils with high bulk density,low silt and pH as well.Group 4 with C.spinosa as the indicator species occurs in sandy soils and low slopes.Using DCCA,we determined the relationship between species and environmental factors more accurately.Results of this study can be used to restore vegetation or maintain species composition in ecological sensitive areas.
Keywords DCCA ·Environmental factors·Khalij-Omani sub-region·TWINSPAN
Introduction
Information about the productivity of forest sites and the near to natural species composition of the vegetation is an important prerequisite to develop sustainable forest management and conservation strategies.In this context,site classification can provide a solid basis for forest planning and controlling.Site classification schemes based on soil characteristics have been developed in several countries(Ellenberg 1988).Forest typologies are therefore often based on site classifications,aiming on a selection of a restricted number of basic units,formulating a clear systematic order by using objective,easily recognizable site characteristics.Most classifications start from structural differences and variations in floristic composition between forest types(van Miegroet 1967),but there is no consensus on the most suitable approach for classification.Vegetation patterns are heterogeneous,the site characteristics can vary greatly and the purposes served by classifications are manifold,and personal attitudes of the phytosociologists perhaps vary equally(Kuchler 1967).
Three principal approaches to ecosystem classification can be distinguished:(1)the combined approach,(2)the independent approach,and(3)the functional approach(Mueller-Dombois and Ellenberg 1974).The combined approach aims at a synthesis of the characteristics of vegetation and environment from the start.It is represented by the work and concepts of Krajina(1969)and Hills(1961).Depending on the concept,ecosystem boundaries may either be determined by plant community boundaries(Sukachev 1945)by soil or landform boundaries(Hills 1961),or by a combination of vegetation and environmental characteristics.This method has been useful in forest site classification studies where ecosystem factors can be used as indicators of more hidden site factors(Vacik et al.2008).The independent approach considers individual factors of the ecosystem as separate entities and evaluates them independently. Subsequently, they are combined on the basis of maps(Mueller-Dombois and Ellenberg 1974).In this case,the correlation of plant communities to their environment is built into established units,and the factors cannot be evaluated independently.Ellenberg(1973)proposed a functional approach,based on classification of the ecosystem,whereas the categories are based on functional relationships and differences.He presented a scheme for classifying the global vegetation into a hierarchy of ecosystems from a functional viewpoint.The most classic and widespread site classification method is based on the indicator value of the understorey vegetation.This plant sociological approach was worked out by Braun-Blanquet(1932),Mueller-Dombois and Ellenberg(1974)and others.
To properly manage forest ecosystems in a region,we need to understand the environmental factors that influence the plant species composition.The absence and presence of species is affected by environmental variables such as soil,climate and topography(Jafari et al.2004).Many studies have shown significant relationships between habitat characteristics,growth and distribution of plants(Abd El-Ghani and Amer 2003;Jafari et al.2004;Hejcmanova-Neerkova and Hejcman 2006;Pérez 2007;Naqinezhad et al.2007;Woldewahid et al.2007;Shaltout et al.2008;Li et al.2008;Dantas and Batalha 2011;Hou and Fu 2014;Kirkpatrick et al.2014;D’Amico et al.2015;Duan et al.2015;Rola et al.2015;Javadi et al.2016;Naderi et al.2016;Sieben et al.2016;Zare Chahouki et al.2016;Naghizadeh et al.2017).The composition of the vegetation might also be altered by changes in the environment(Solon et al.2007).Among the most important components influencing vegetation composition are the soil characteristics(Gavili Kilaneh and Vahabi 2012;Rezaipoorbaghedar et al.2013;Adel et al.2014;Bagheri and Heydari Gharaei 2014;Pourbabaei et al.2015;Javadi et al.2016;Naderi et al.2016;Zare Chahouki et al.2016;Naghizadeh et al.2017),and both vegetation and soil are influenced by topography(Xu et al.2008).Soil factors provide the primary explanation for describing the distribution of the plant communities(Ayyad 1976),and differences in soil properties determine distribution patterns of plants and communities(Rubio and Escudero 2000;Virágh et al.2011).Also,topographical factors can significantly affect the distribution of vegetation and plant species(Bahrami and Ghorbani 2016;Javadi et al.2016;Naghizadeh et al.2017).
Vegetation soil relationships often vary with geographical regions(Gough et al.2000;Hájkováet al.2008;van Dobben and de Vries 2010;Virágh et al.2011).Even on an apparently homogeneous surface,there is a complex mosaic of microhabitats,many related to soil and microtopography(Cañadas et al.2010).The soil texture greatly determines the water retention characteristics of the soil,and the topography also affects the spatial variation of soil water content(Mecke et al.2002).Runoff characteristics including amount,rate,and velocity depend on the type of vegetation cover,rainfall,soil and topography(Klinge 1977).
The southern Iranian forests belong to the Khalij-Omani subregion in the vegetation zone of Sahara-Sindianan and comprise about 5 million hectares(Marvie Mohadjer 2013).Of the few investigations on the relationships between plant ecological groups and environmental factors of Khalij-Omani subregion(Arzani et al.2005;Zare Mehr Jerdi et al.2007;Nadja fiTirehe Shabankareh 2008),Arzani et al.(2005)studied the variations in the vegetation composition on the sand dunes of central and coastal deserts and showed that climatic factors,aspect and altitude of dunes are related to vegetation variations.Zare Mehr Jerdi et al.(2007)found a correlation among vegetation cover,elevation,slope and soil electrical conductivity(EC).Another study on the relationships between ecological factors and plant associations in the Geno protected area in southern Iran showed that,among different environmental factors(topographic and edaphic variables),the most effective factors in the separation of plant communities were EC,altitude,saturation moisture content(SMC),calcium,organic matter,lime,potassium,sodium,sulfate,chloride,magnesium and slope,respectively(Nadja fiTirehe Shabankareh 2008).Also,investigation of soil,topography and vegetation relationship in Khojir National Park showed that vegetation types differed significantly in the percentage of gravel,CaCO3,CaSO4,sand and clay(Javadi et al.2016).However,the results of Adel et al.(2014)in the Caspian region determined EC,pH and heavy metals were the most important variables affecting plant ecological groups.On the other hand,Naghizadeh et al.(2017)showed that elevation,slope,soil depth and lime have the greatest in fluence on vegetation.
The site of the present study is located within the Khonj forests,where the dominant species,Ziziphus spina-christi,is considered as the indicator species of the Khalij-Omani subregion(Moradi et al.2010).Identifying the most important factors that influence plant growth can help managers recommend suitable species to maintain and improve forest biodiversity.Therefore,this study aimed(1)to investigate the relationships between vegetation composition and environmental factors and(2)to determinate the main factors that explain the variation in vegetation.
Materials and methods
Study area
This study took place in the Poshtband region of Khonj city in southeastern Fars Province,Iran(Fig.1).The 1179-ha study area is situated in varies altitude between 685 m and 1000 masl.The mean annual rainfall and temperature are 192.6 mm and 23.7°C,respectively(Meteorological Year Books 1990–2015).The dry season lasts approximately 8 months,and most rainfall(83%)is concentrated between December and April.Dominant tree and shrub types of study area are Ziziphus spina-christi–Ziziphus nummularia and Amygdalus lycioides–Astragalus arbusculinus(Fig.1).
Vegetation sampling
To include a range of different environmental conditions,we selected sample plots based on a land unit map(Fig.2),and two plots were established in every land unit.The area of plots in each plant types was determined by the minimum surface method using a nested plot technique and area/speciescurves(Mueller-Domboisand Ellenberg 1974).After that,to do the same analysis for the whole region and achieve greater accuracy,we considered the area of the plots to be greater than the minimum area(Naderi et al.2016).For avoiding a possible edge effect,square sampling plots(200 m2)were demarcated approximately in the center of each land unit.Also,a handheld global positioning system(GPS)with±3 m accuracy was used for vegetation sampling and siting plots in each land unit.Plant species were collected,identified and documented using information from existing studies on relevant flora(Moradi et al.2010).All vegetation samples were stored in the Herbarium of the Forestry Department,University of Tehran.Species presence,percentage cover and density were recorded within plots.
Soil sampling and analysis
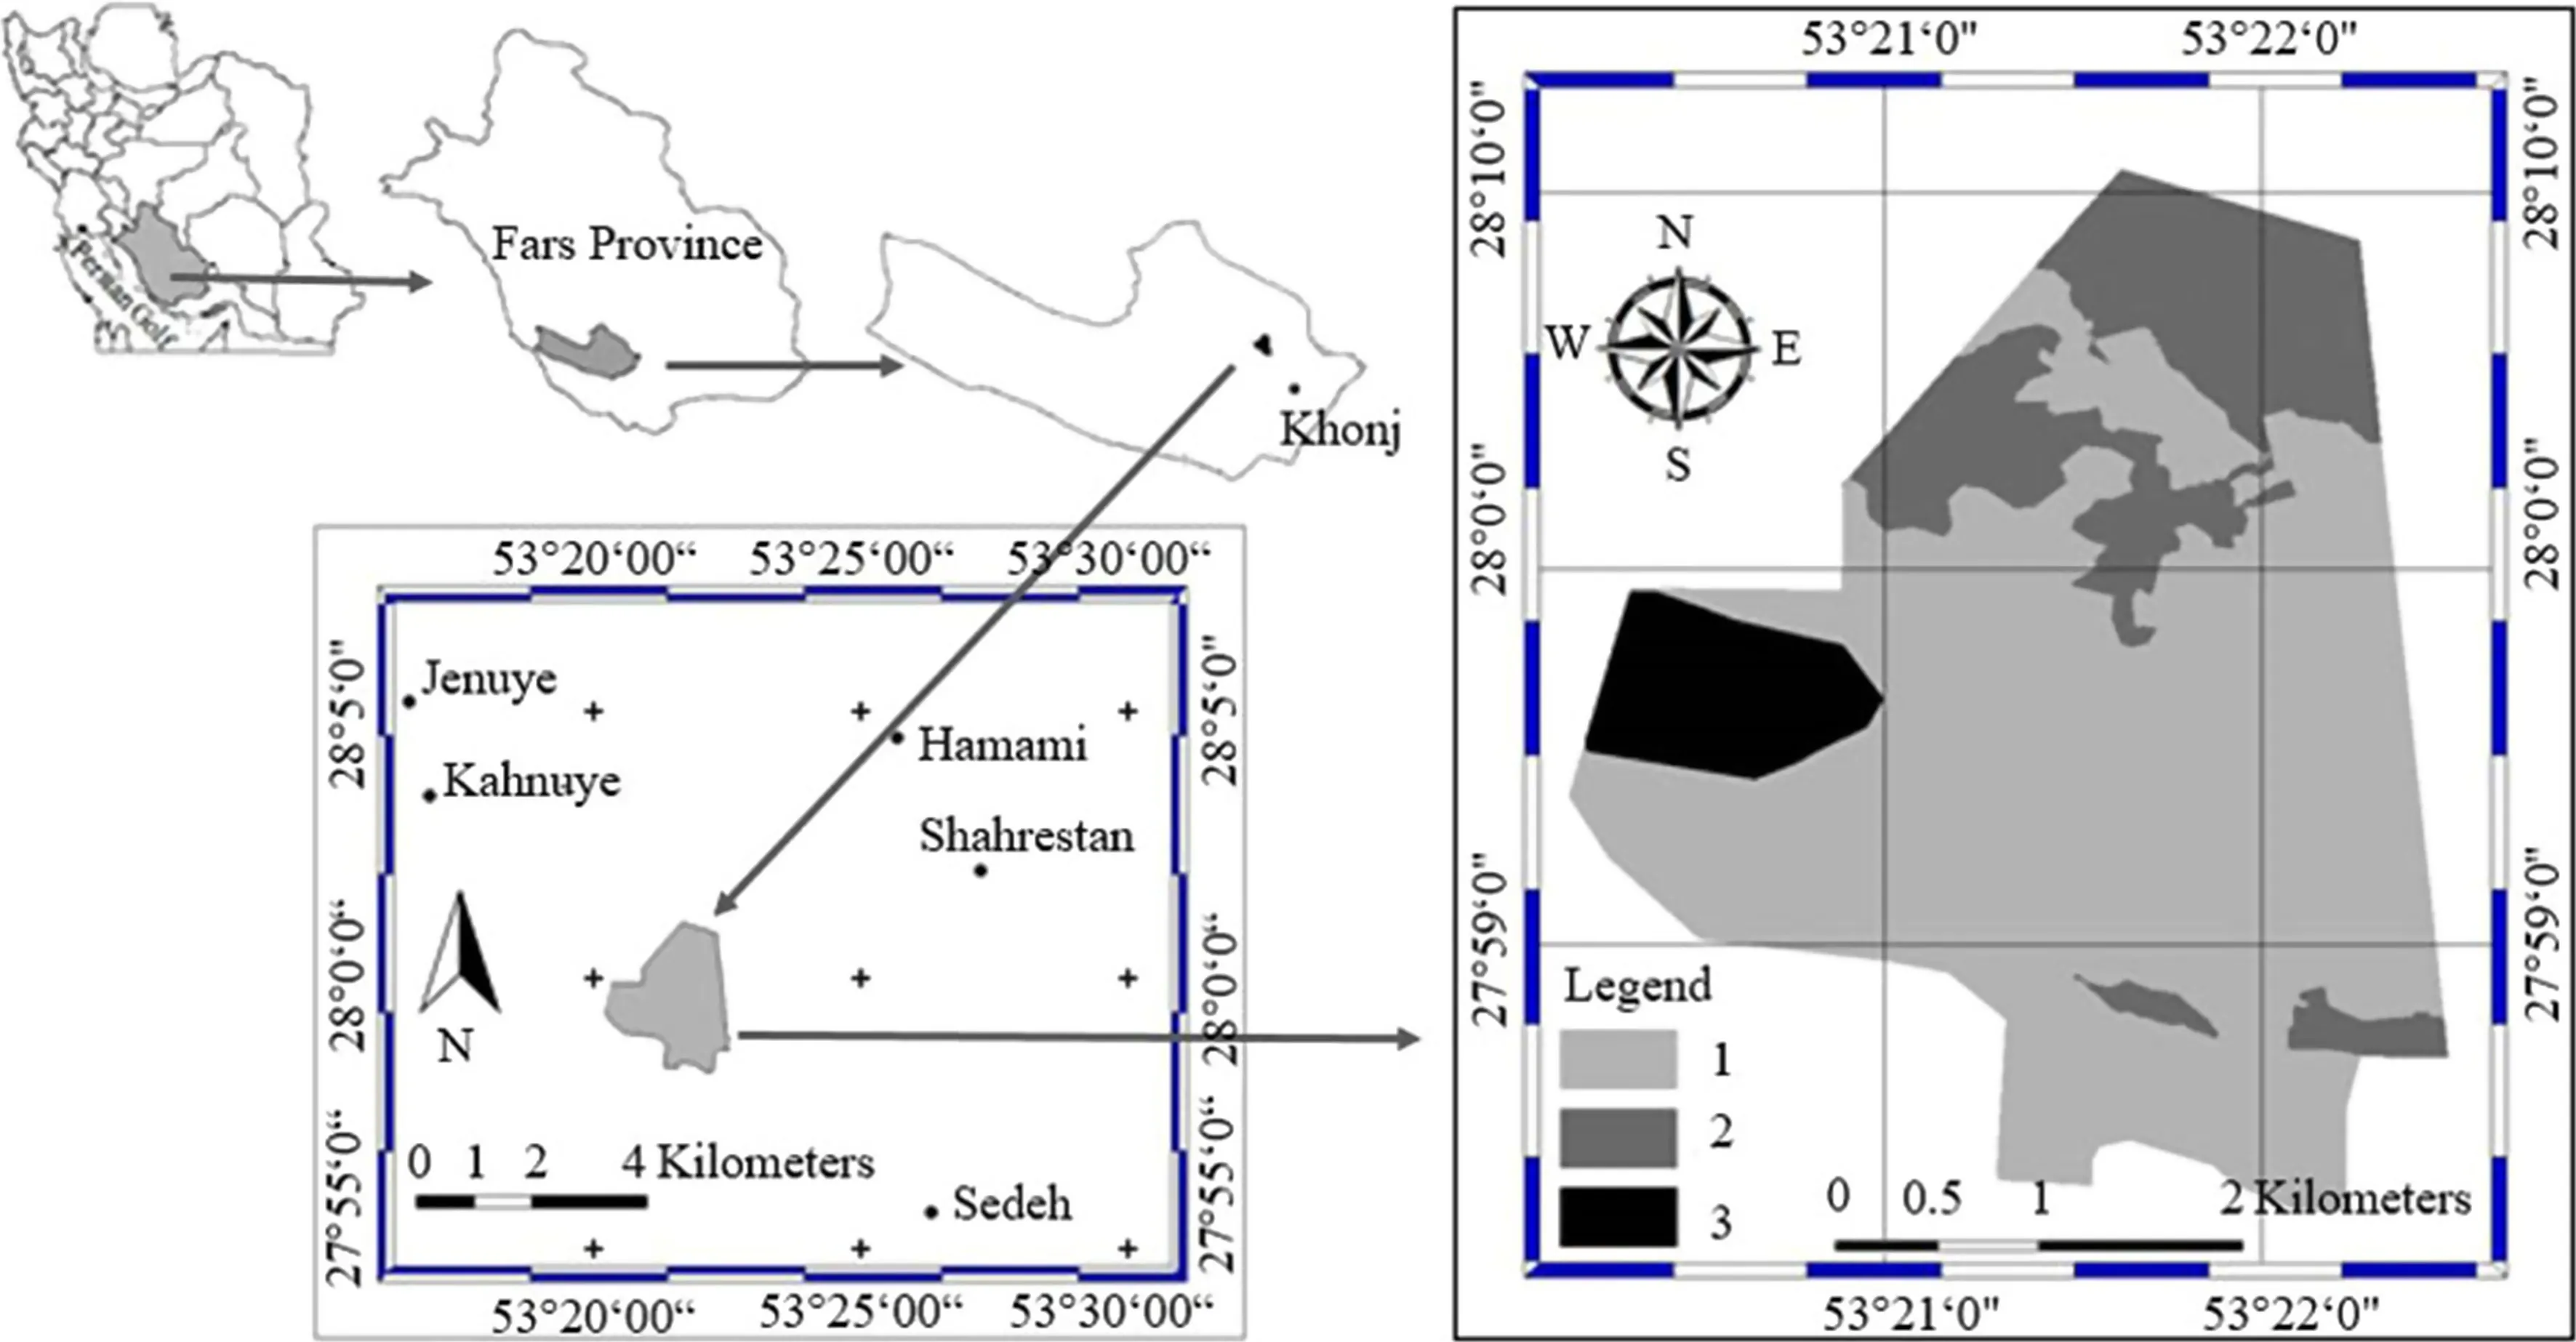
Fig.1 Location of the study area in Iran and different vegetation and land covers(1=Ziziphus spina-christi–Ziziphus nummularia vegetation type,2=Amygdalus lycioides–Astragalus arbusculinus type,3=desert)
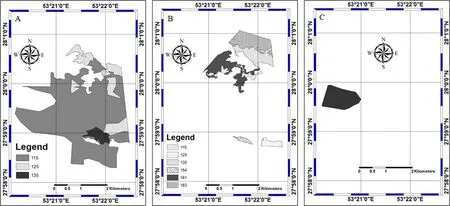
Fig.2 Land unit map of study area for each plant type(a=Ziziphus spina-christi–Ziziphus nummularia type,b=Amygdalus lycioides–Astragalus arbusculinus type,c=desert)(The numbers in the legend,top to bottom,are related to height,slope and aspect,respectively.)
Soil samples from 0–10,10–30,30–60 cm deep were collected from the center of each plot.These depths were selected based on depth of plant species roots in study area and on previous studies(Barnes et al.1998;Resooli and Jafari 2009;Sheykhzadeh et al.2015).Soil analyses were done at the Soil Laboratory of Natural Resources Faculty,University of Tehran.Air-dried soil samples were sieved with a 2.0-mm sieve.Soil texture was determined using a hydrometer analysis(Bouyoucos 1962),and the results used to calculate the percentages of sand,silt and clay.EC and pH were measured in a 1:1 soil–water extract(McLean 1982)using an electric conductivity meter and a glass electrode pH meter,respectively(Rhoades 1982).Saturation moisture content(SMC)was determined by the loss in mass of saturated paste after drying at 105°C for 24 h.Collin’s calcimeter was used to determine the CaCO3content(Nelson 1982),and the Walkely and Black titration method was to estimate organic matter content(OM)(Nelson and Sommers 1982).Total nitrogen content was determined by the Kjeldahl method(Bremner and Mulvaney 1982).The Olsen method was used to determine available phosphorus(Olsen and Sommers 1982).Available potassium(K)was measured using flame photometry(Knudsen et al.1982).Bulk density(Bd)was estimated according to soil texture using CROPWAT 8.0 software(FAO 2009),and the results were used to calculate the soil porosity.
Statistical analysis
The computer program PC-ORD software version 4.14(McCune and Mefford 1999)and CANOCO software version 4(ter Braak and Šmilauer 1998)were used for the classification and ordination of the vegetation tables recorded in the field.The floristic data matrix was classified using a two-way indicator species analysis(TWINSPAN)(McCune and Mefford 1999).The TWINSPAN groups were subjected to an ANOVA to detect any significant variation among the groups according to environmental factors.Duncan’s multiple range test was used to detect variations among groups.The Kaiser–Meyer–Olkin(KMO)measure of sampling adequacy and Bartlett’s test of sphericity were done to measure sampling adequacy (Kaiserand Rice1974).The relationship between group types derived from TWINSPAN and environmental factors was assessed using a detrended canonical correspondence analysis(DCCA).If gradient length will be more than 4,we can use CCA and DCCA(Jafari et al.2009a).But DCCA is the combination of DCA with CCA(Zhang et al.2006).It has several advantages over the indirect ordination and is robust even when assumptions of multivariate normal data structure are violated.Multiple regression is used in DCCA to determine the proportion of variation of each ordination axis explained by environmental variables(Zhang et al.2006).
Results
Based on TWINSPAN,four vegetation groups were identified(Fig.3).The first division gave a primary clustering of communities into two groups,Plantago ovata and Plantago maritima(on the left),with 12 times presence and a coverage ratio(up to 1%cover)and Gymnarrhena micrantha(in the right)with 3 times presence and a coverage ratio(up to 1%cover)were indicator species.Vegetation groups 1,2 and 3 were distinct from group 4 by the abundance of G.micrantha,P.maritime,and P.ovata.Indicator species of the four groups were as follows:group 1:Achillea wilhelmsii,group 2:Tanacetum parthenium,group 3:Convolvulus spinosus,group 4:Capparis spinosa.
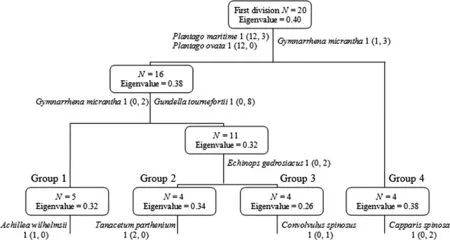
Fig.3 Dendrogram indicating vegetation groups determined by TWINSPAN
Results of the ANOVA showed that among the four groups,CaCO3,bulk density,soil porosity,silt fraction,sand fraction,EC,soil reaction,slope,and elevation differed significantly(Table 1).In Duncan’s multiple range test,in the first group,calcium carbonate in the soil was significantly lower than in the other groups(P<0.05).In group 3,bulk density was significantly higher than in second group,while soil porosity was higher in the second group(P<0.05).The third group of plants grow in sandy soils,and in this group,sand was significantly higher than in the first and second groups(P<0.01).Soil acidity for the first group was higher than in all the other groups,and in the third and fourth groups,acidity was lower than in the others(Table 1).
Results of the KOM measure of sampling adequacy(0.605)and Bartlett’s test of sphericity(approximate χ2:244.637)was shown that the number of samplings is acceptable and adequate(p<0.01).
TWINSPAN groups were superimposed onto the DCCA ordination(Fig.4).The DCCA ordination diagram illustrates clearly the relationship between vegetation and environmental factors(Fig.4).DCCA axis 1 was mainly correlated with elevation,slope and EC(Fig.4).Group 1 with Achillea wilhelmsii as the indicator species had a positive relation with slope and elevation,but a negative relation with EC.Also,group 2 with Tanaccetum parthenium as the indicator species grows on soils with high silt and low bulk density and sand.Group 3 plants with Convolvulus spinosus as the indicator species grow in soils with high bulk density,low silt and pH,whereas group 4 plants with Capparis spinosa as the indicator species grow in sandy soils.
Discussion
In the TWINSPAN classification,the ecological groups formed by the herbaceous,tree,and shrub species reflected environmental characteristics within a limited range,agreeing with the result of Jafari et al.(2002b,2009b).The first vegetation group with Achillea wilhelmsii as the indicator species was found on high acidity,steep slope sites,and calcium carbonate in the soil was lower than the soils for the other groups.A.wilhelmsii,a medicinal species that is broadly distributed in Iran,grows in mountainous areas with shallow to semi-deep soils(Samadi 2014).The species has a positive relation with increasing elevation and appears at higher altitudes,which corresponds with the finding of Samadi(2014).
Tanacetum parthenium is the indicator species of group 2,that appears in areas with high silt and low bulk density and sand,which corresponds with the results of Nasery et al.2008.It too is a medicinal species(Rateb et al.2008;Asgari and Parvin 2013),and its origin is Kazakhstan,Central Asia and Mediterranean regions(Zargari 1996).It is widespread in Europe,Asia and America(Chevallier 2001)and in Iran(Zargari 1996)and often grows at the margins of roads,riversides(Shafaghat 2010),open areas in forests,in nonsaline and moderate to very heavy soils,(Nasery et al.2008).In the study area,this species grows in valleys with sedimentary soils.
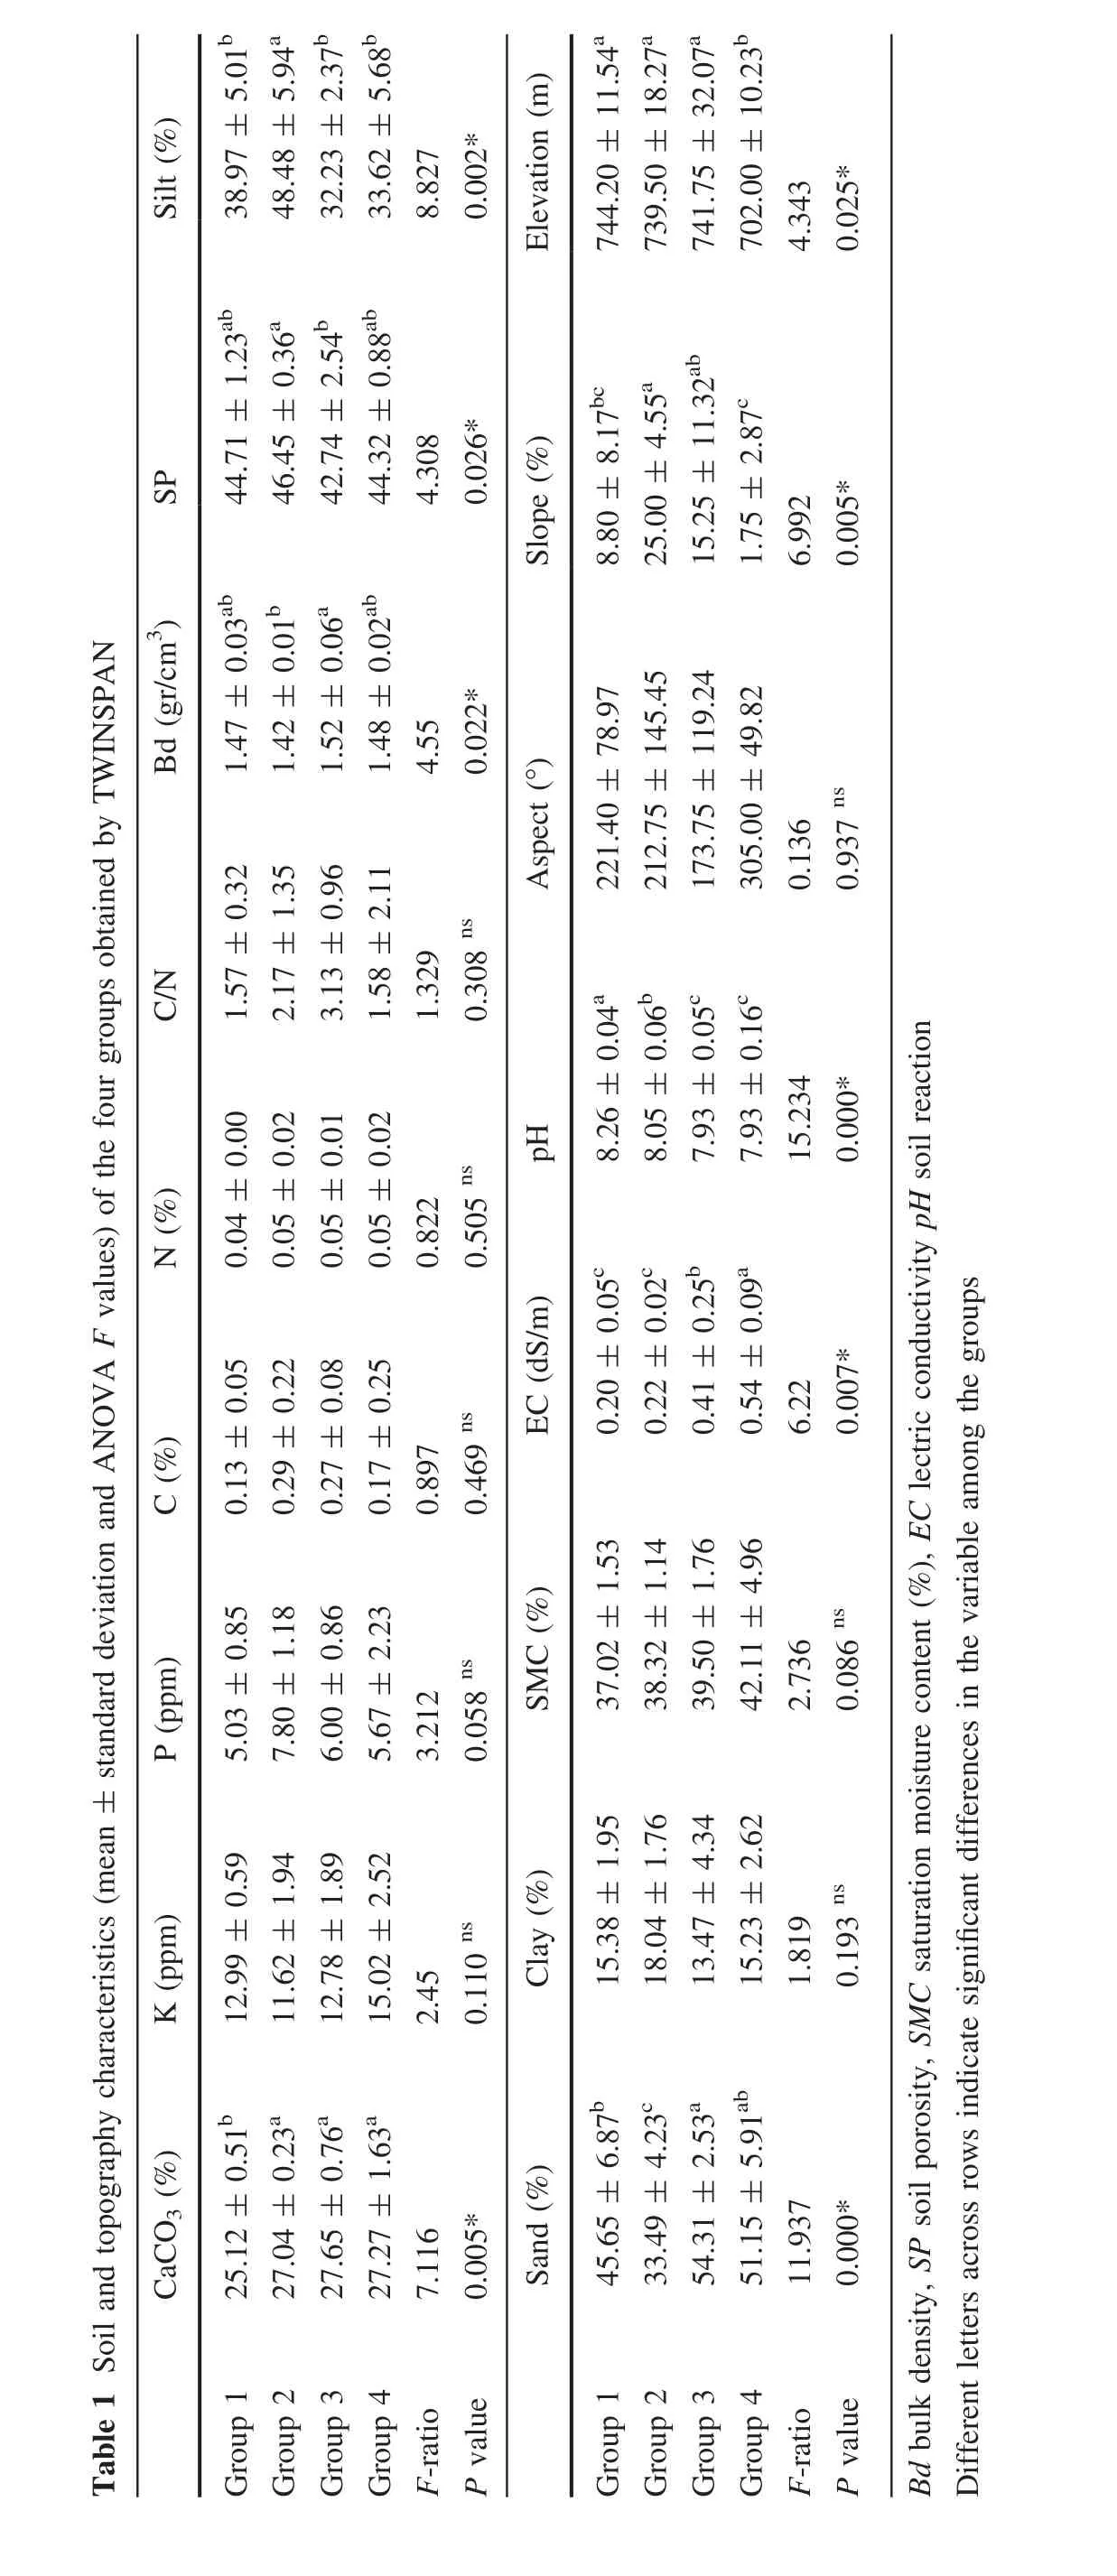
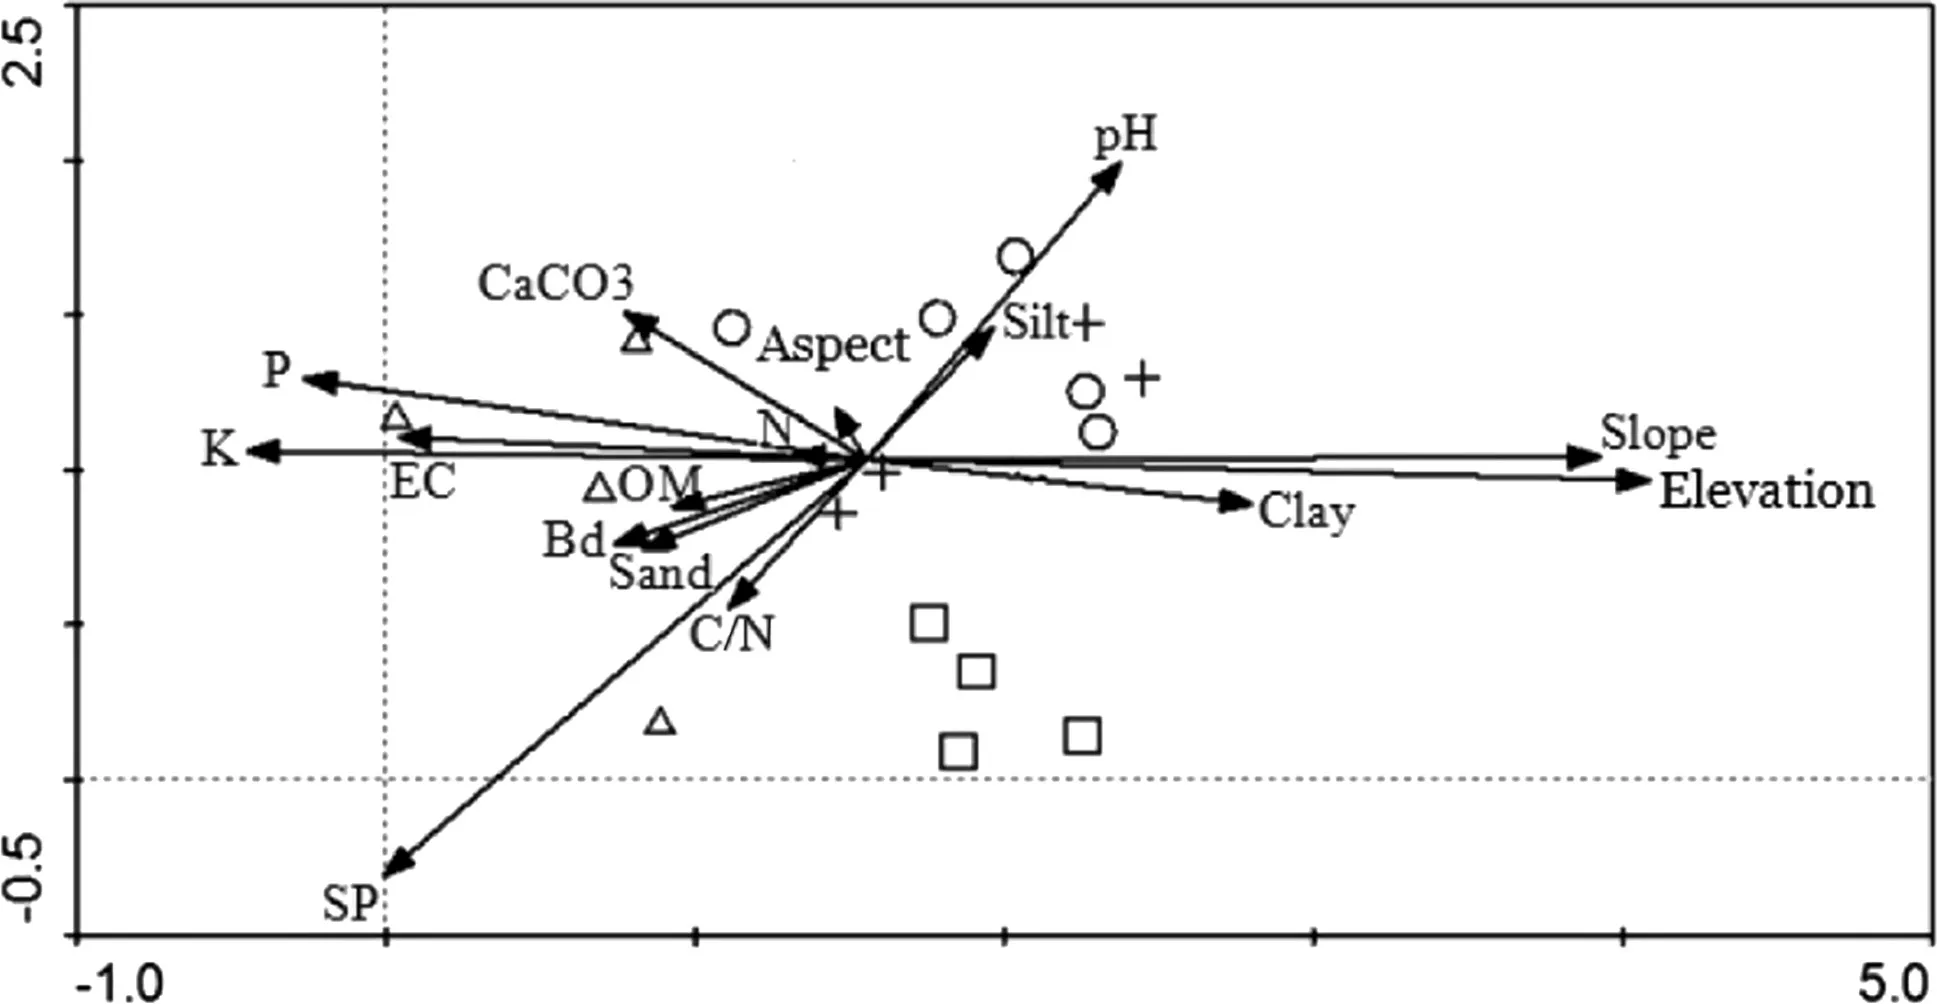
Fig.4 DCCA plots ordination of the group types derived from TWINSPAN(opened circle:group 1,opened triangle:group 2,opened square:group 3,plus:group 4)
The third vegetation group with Convolvulus spinosus as the indicator species grows in areas with high bulk density,low silt and pH as well.
Group 4 with Capparis spinosa as the indicator species occurs in areas with less slope.This study clearly showed that group 4 grows in sandy soils,agreeing with the results of Fakhri et al.2008.On the sites with this species,the amount of sand is higher than first and second groups.In other words,C.spinosa grows well in sandy,well-drained soils(Fakhri et al.2008).Roots of C.spinosa need to grow deeply to reach and absorb water in dry,warm regions.Hence,this species is distributed in deep,sandy soils in the study area,that is,in flat or low-slope areas.C.spinosa is an indicator species in the southern forests of Iran and grows in Mediterranean,tropical,and subtropical regions(Panico et al.2005;Fakhri et al.2008).This species has low ecological demands and thus grows easily in poor soils.Furthermore,its deep and extensive root system is very effective for controlling soil erosion especially on steep slopes.As a multipurpose plant,it can also be used to restore natural resources and stabilize of sandy soils(Fakhri et al.2008).
The relation of environmental factors to ecological groups and indicators species was tested using the PCA,whereas the relation between the environmental factors and each species was analyzed with the DCCA.Elevation and slope were the most important factors influencing the occurrence of plant species.Slope was correlated with plant species composition,consistent with the results of Davies et al.(2007)and Wang et al.(2006),but in contrast to the study by Nadja fiTirehe Shabankareh(2008)in Khalij-Omani subregion that documented elevation as more important than slope.Additionally,the study by Zare Mehr Jerdi et al.(2007)found that elevation and slope are important in determining the vegetation composition.Aspect was the only nonsoil factor that had no correlation with plant species composition;the ecological groups did not differ signi ficantly for aspect(Table 1).
In the study by Zare Mehr Jerdi(2007)in the Khalij-Omani subregion,EC and vegetation were negatively related,while in the present study EC had a positive relationship with some ecological groups that included halophytes.EC can cause imbalances between ions in addition to reducing available water(Ahmadi et al.2007)and is one of the most important factors in the establishment of plant communities in arid environments(Abd El-Ghani and Amer 2003).In areas where the EC is high,many species cannot grow;halophytic species are much more suitable.In the ecological groups of this study,high EC indicated better growth for halophytes.
Results of other studies on the relation between vegetation patterns and soil properties in the dry area of the Iran showed that the main soil factors related to variations in vegetation composition are soil texture,EC,K and CaCO3(Jafari et al.2009b).But in this study,soil texture and CaCO3did not significantly influence composition.On the other hand,EC and K were important factors.These differences can be related to differences in the sampling and analytical techniques or the different ecological groups determined.Additionally,variations in soil characteristics on a microscale within the plots must be considered.
The environmental factors that were identified by the DCCA explained only 41.7%of the variation in the data set,indicating that factors that we did not investigate in the present study may better explain variations in the vegetation composition(Sieben et al.2016).Obvious candidates would be groundwater level,geological factors,grazing and other agricultural activities.Groundwater level has been found to be one of the most important factors influencing plant groups in some studies(Jafari et al.2002a;Heshmati 2003;Naqinezhad et al.2007).So,these factors should be considered in future studies on soil–vegetation relationships.The impact of grazing and agricultural activities on plant compositions in the study area should also be determined(Rahman et al.2009).According to the KMO index,sampling adequacy was mediocre but acceptable(Kaiser and Rice 1974).Future studies would benefit from including more sampling plots.
Conclusions
While the link between environmental factors and ecological groups and indicator species can be investigated by PCA,the DCCA helped to elucidate the relationship between species and environmental factors more accurately.The PCA reduces the number of dimensions needed to explain the variation in environmental characteristics,but these axes would need to be separately analyzed to see if they help to predict vegetation composition.In future research,grouping by TWINSPAN should be compared with grouping by discriminant analysis.The DCCA allowed us to identify two PCs,whereas phosphorus,potassium,saturation moisture content,EC,slope and elevation significantly affected vegetation composition.Understanding the environmental characteristics and ecological needs of each species is needed to propose appropriate species for different regions and within a region.The results of the present study can be used for restoring vegetation or maintaining species composition in ecologically sensitive areas.To improve the level of significance for the results,more sampling plots should be used in future studies.
AcknowledgementsThe authors are grateful to Jeremy T.Lamdholm from the Department of Biology,Saint Mary’s University,Canada,and anonymous reviewers for helpful comments and suggestions.
 Journal of Forestry Research2018年6期
- Journal of Forestry Research的其它文章
- Black locust(Robinia pseudoacacia L.)as a multi-purpose tree species in Hungary and Romania:a review
- The impact of the environmental factors on the photosynthetic activity of common pine(Pinus sylvestris)in spring and in autumn in the region of Eastern Siberia
- Osmoregulators in Hymenaea courbaril and Hymenaea stigonocarpa under water stress and rehydration
- Effect of nitrogen levels on photosynthetic parameters,morphological and chemical characters of saplings and trees in a temperate forest
- Free amino acid content in trunk,branches and branchlets of Araucaria angustifolia(Araucariaceae)
- Exogenous application of succinic acid enhances tolerance of Larix olgensis seedling to lead stress
